



Crude Oil Weekly Outlook: Hormuz News Is Noise, Price Action Leads
Crude Oil Weekly Outlook: Hormuz headlines remain noise, while price action stays in focus as traders navigate sharp volatility swings driven by shifting developments between the US, Iran, and Lebanon. The $76–75 zone remains a critical support level.
Share this:

Headline-driven volatility continues to dominate short-term price swings, but key technical levels remain intact. The $76–74 zone has repeatedly held as support following declines from the $100 level, marking a significant level tied to the previous Middle East escalation in 2025 between the US, Iran, and Israel.
Disruptions around the Strait of Hormuz typically take time to fully unwind across global energy and commodity supply chains, keeping short-term inflation risks and geopolitical premiums elevated.
Frequent shifts in headlines—ranging from the Strait reopening, partial access for commercial shipping, renewed closures, or US naval blockades—should be viewed primarily as short-term volatility drivers, rather than structural trend changes. These developments sit within the broader framework outlined in the Crude Oil Q2 2026 outlook, which defines the bullish, neutral, and bearish zones.
Confirming longer-term reversals requires alignment with shorter timeframes and pattern confirmation, as illustrated in the 2-week and daily WTI charts below.
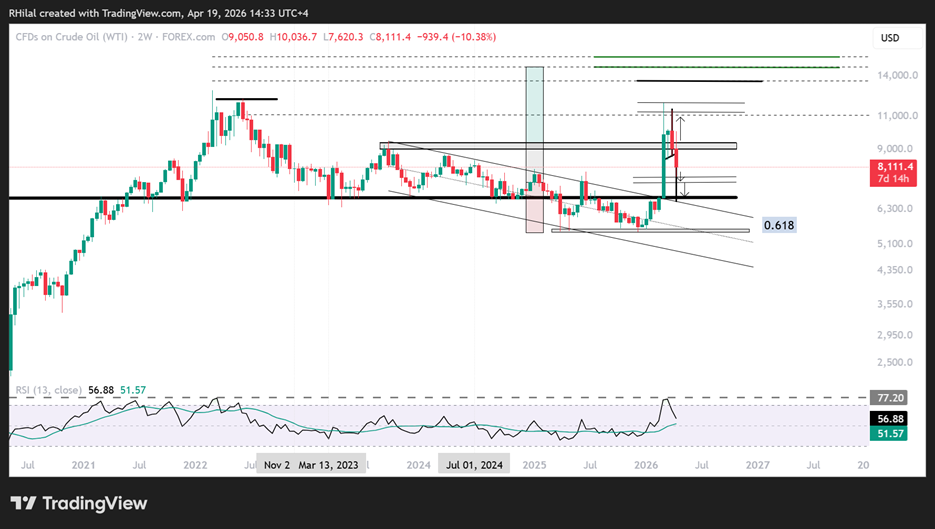
Crude Oil Weekly Outlook: 2 Week Time Frame – Log Scale
Source: Trading view
The latest decline in crude oil has broken below the previously outlined bullish scenario on the 2-week timeframe, shifting the outlook into a transitional zone between bullish continuation and potential bearish consolidation.
Bearish Scenario
With prices now trading near the lower end of the $80 range, key support levels lie at $76 and $74, aligning with highs from last year’s Middle East conflict. A confirmed breakdown below these levels could expose $67, signaling a broader, longer-term consolidation phase.
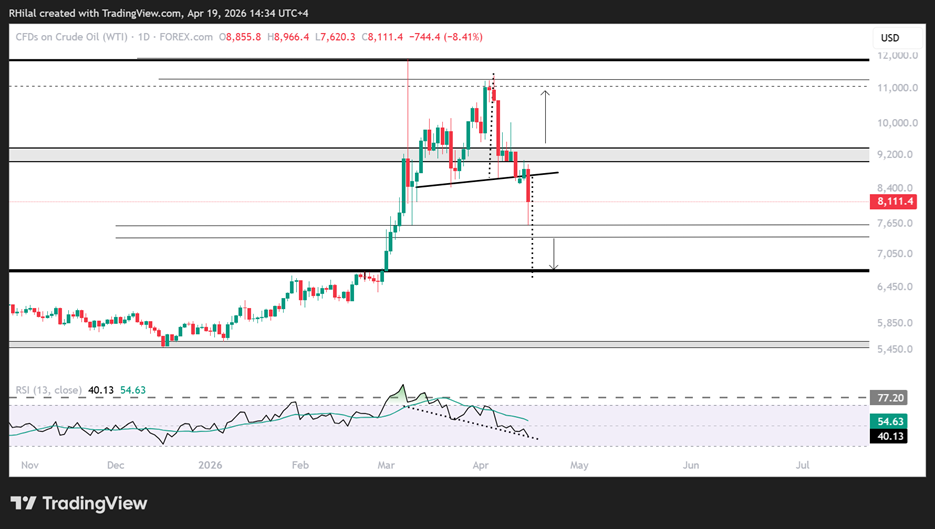
Crude Oil Weekly Outlook: Daily Time Frame – Log Scale
Source: Trading view
The recent reversal was further confirmed by a head and shoulders breakout pattern on the daily timeframe, reinforcing the importance of technical analysis in navigating headline-driven markets. A break below the neckline at $84 triggered a sharp decline toward the $76 zone.
The full measured move of this pattern points toward the $67 level, a historically significant support and resistance zone for crude since 2018. This scenario would require a confirmed breakdown below the $76–75 support zone.
On the upside, if crude manages to recover above the $88–93 zone—aligned with 2023 highs—bullish momentum could re-emerge. This would bring the $115 level back into focus, with potential extension toward the $130–150 range.
Conclusion: Focus on Structure, Not Headlines
Despite ongoing geopolitical developments, price action remains the most reliable guide. While Hormuz-related headlines will continue to drive short-term volatility, sustained trends will be confirmed only through key technical levels and pattern validation.
Written by Razan Hilal, CMT
Follow on X: @Rh_waves
Latest market news




Open an account in minutes
Experience award-winning platforms with fast and secure execution.
Economic calendar
Web Trader platform
Our sophisticated web-based platform is packed with features.
Related articles
S&P 500 forecast: SPX struggles for direction ahead of PPI data
U.S. stocks are struggling for direction on Friday as investors continue to weigh up the fallout from Nvidia’s leadership change, rising Treasury yields and the upcoming U.S. producer price inflation data.


S&P 500 Forecast: SPX rebounds amid revived AI enthusiasm
U.S. stocks are opening higher as returning AI enthusiasm overshadows a jump in Treasury yields.

Tankers Still Get Hit but Brent Crude Oil Keeps Falling
Brent crude oil has turned bearish after breaking its uptrend, as de-escalation signals outweigh tanker strikes near the Strait of Hormuz.
The information on this web site is not targeted at the general public of any particular country. It is not intended for distribution to residents in any country where such distribution or use would contravene any local law or regulatory requirement. The information and opinions in this report are for general information use only and are not intended as an offer or solicitation with respect to the purchase or sale of any currency or CFD contract. All opinions and information contained in this report are subject to change without notice. This report has been prepared without regard to the specific investment objectives, financial situation and needs of any particular recipient. Any references to historical price movements or levels is informational based on our analysis and we do not represent or warranty that any such movements or levels are likely to reoccur in the future. While the information contained herein was obtained from sources believed to be reliable, author does not guarantee its accuracy or completeness, nor does author assume any liability for any direct, indirect or consequential loss that may result from the reliance by any person upon any such information or opinions.
Futures, Options on Futures, Foreign Exchange and other leveraged products involves significant risk of loss and is not suitable for all investors. Losses can exceed your deposits. Increasing leverage increases risk. Spot Gold and Silver contracts are not subject to regulation under the U.S. Commodity Exchange Act. Contracts for Difference (CFDs) are not available for US residents. Before deciding to trade forex, commodity futures, or digital assets, you should carefully consider your financial objectives, level of experience and risk appetite. Any opinions, news, research, analyses, prices or other information contained herein is intended as general information about the subject matter covered and is provided with the understanding that we do not provide any investment, legal, or tax advice. You should consult with appropriate counsel or other advisors on all investment, legal, or tax matters. References to FOREX.com or GAIN Capital refer to StoneX Group Inc. and its subsidiaries. Please read Characteristics and Risks of Standardized Options.