



ASX 200 Outlook: Options Expiry Could Keep the Index Range-Bound
The ASX 200 is expected to open slightly firmer, but options expiry and key gamma resistance suggest another choppy session.
Share this:

The ASX 200 is expected to open slightly firmer following a modest gain in SPI 200 futures overnight, although today's options expiry could keep price action range-bound. While the technical backdrop has improved modestly, the options market continues to point to strong resistance overhead, suggesting traders may be better served fading rallies than chasing a bullish breakout.
I also prefer "Could Keep the Index Range-Bound" over "Could Cap Gains" because it better reflects the analysis: you're expecting two-way trading rather than simply limited upside.
View related analysis:
View related analysis:
ASX 200 Price Action and Options Expiry Analysis
ASX 200 Market Snapshot
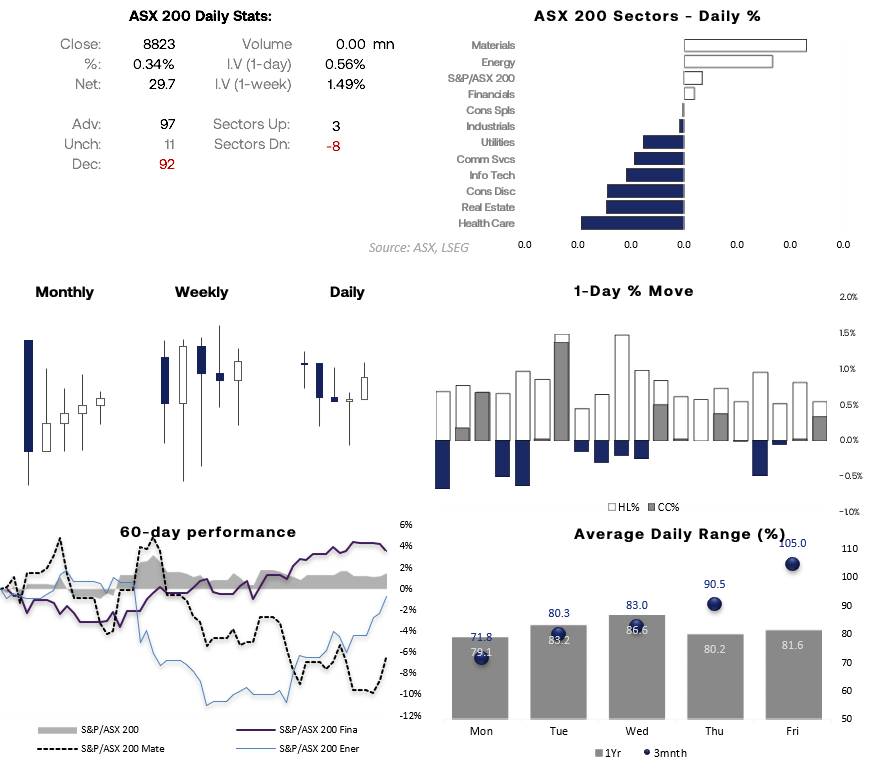
- The ASX 200 rose 0.34% to 8823, although market breadth was mixed with 97 advancers versus 92 decliners.
- Materials and Energy led gains, while Health Care, Real Estate and Consumer Discretionary were the weakest sectors.
- The index is attempting to recover after several softer sessions, but the daily trend remains choppy.
- One-day implied volatility fell to 0.56%, although 1-week implied volatility remains elevated at 1.49% ahead of key event risk.
- Friday is historically the most volatile trading day, with an average daily range of 81.6 points over the past year and 105 points over the past three months.
- Ultimately, leadership remains narrow, suggesting the rally lacks broad participation and may struggle to sustain gains unless market breadth improves.
Source: ASX, LSEG
Materials Lead While the ASX Lags Global Peers
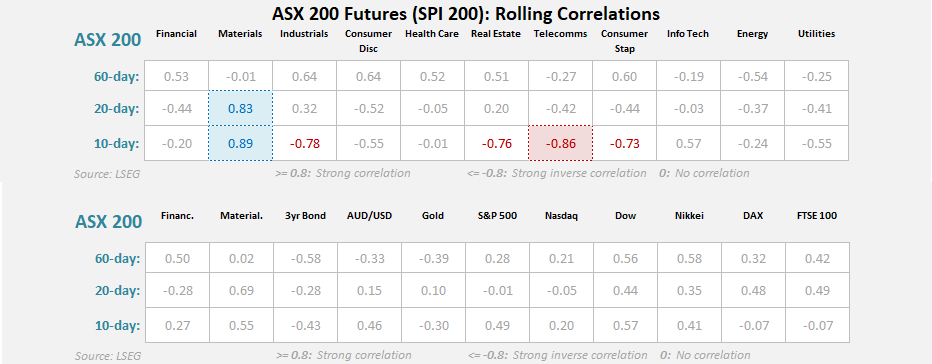
- Materials remain the key sector for ASX traders, with Industrials and Telecommunications also showing improving relative strength.
- The Financials sector continues to outperform over the past 60 days, helping underpin the broader index despite mixed sector leadership.
- Unlike many global equity markets, the ASX 200 continues to underperform, highlighting its relatively independent price action.
Source: ASX, LSEG
ASX 200 Technical Analysis
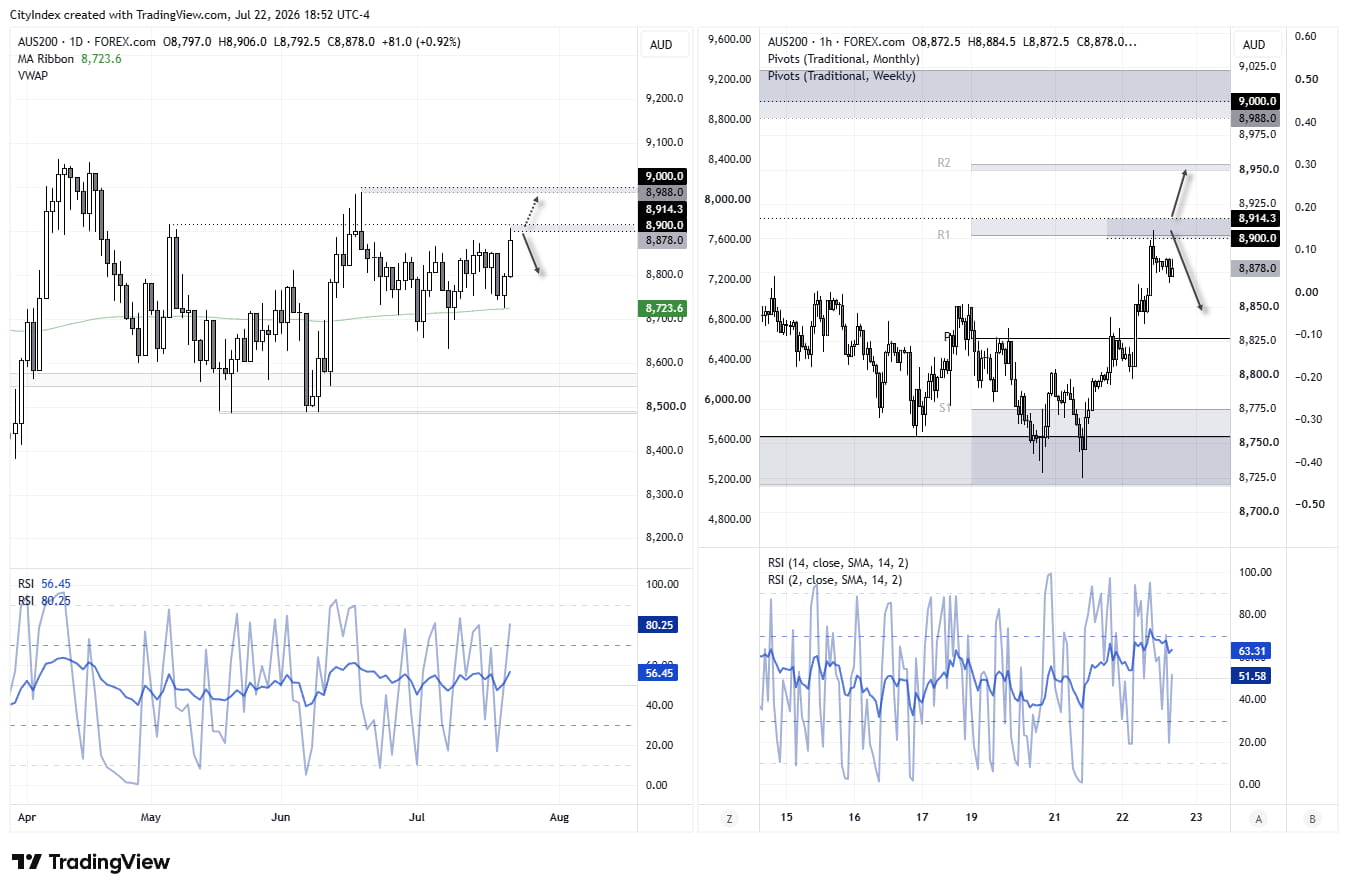
The daily ASX cash chart (left) shows price action has remained choppy, with the index effectively moving sideways throughout July. That said, there is a slight bullish bias as the 200-day EMA continues to provide support. Even so, rallies have repeatedly stalled around 8850. With today marking options expiry, I remain sceptical that the positive lead from SPI 200 futures overnight will be enough to trigger a bullish breakout in the ASX 200 cash market. If anything, a move into resistance could provide an opportunity for bears to fade the rally with tactical shorts.
Options Expiry Points to Another Range-Bound Session
Today's expiry profile favours more range trading unless a fresh catalyst emerges. 8975 is the dominant gamma ceiling, with 8900 providing secondary resistance. Together, they create a strong resistance zone into today's close. On the downside, 8775 is the key gamma floor, where heavy put positioning should help support pullbacks unless price is accepted below it.
Next week's options positioning also favours range trading. 8800–8825 is shaping up as the key battleground, while call open interest at 8900 and 8950 should continue to cap rallies. A sustained break above 8900 would open the door to 8975, while acceptance below 8775 would shift focus to the major floor at 8675.
Source: ASX, ASX24, TradingView
ASX 200 Options Summary
- 8975 is the major gamma ceiling, with 8900 acting as secondary resistance.
- 8775 is the key gamma floor and should support pullbacks unless price is accepted below it.
- 8800–8825 is the main battleground, favouring choppy, range-bound trading.
- A sustained break above 8900 exposes 8975.
- Acceptance below 8775 shifts focus to the 8675 gamma floor.


ASX 200 Levels
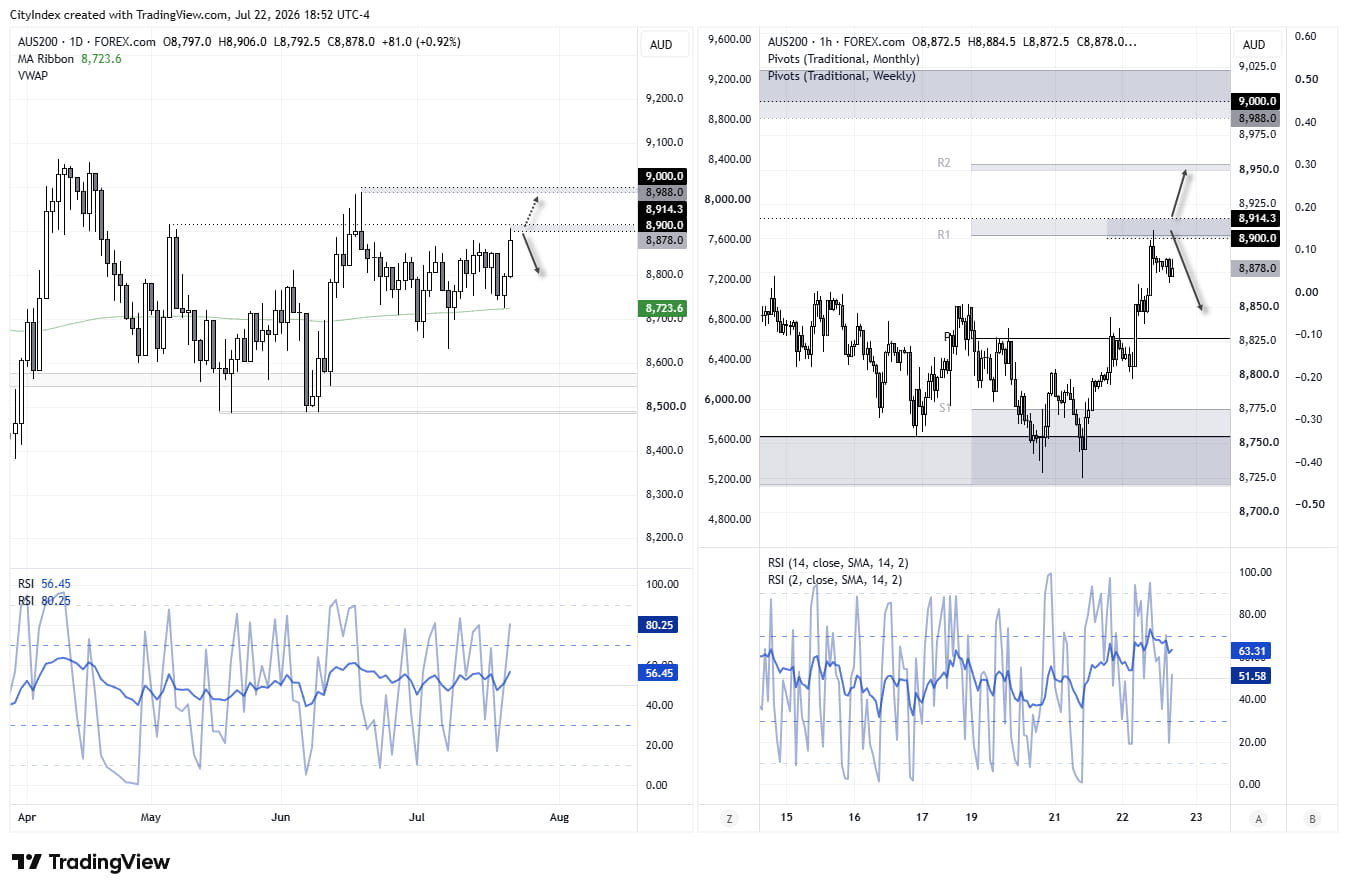
The 1-hour chart shows a strong rally towards 8900, with a small bull flag forming into the close. Bulls may have another crack at 8900, although weak volume on the rally suggests traders should watch for reversal patterns that could trigger mean reversion lower. Alternatively, a sustained break and hold above 8900 would strengthen the case for a move towards 9000 next week.
View the full economic calendar
View the full economic calendar
-- Written by Matt Simpson
Follow Matt on Twitter @cLeverEdge
How to trade with City Index
You can trade with City Index by following these four easy steps:
- Open an account, or log in if you’re already a customer
• Open an account in the UK
• Open an account in Australia
• Open an account in Singapore
- Search for the market you want to trade in our award-winning platform
- Choose your position and size, and your stop and limit levels
- Place the trade
Related tags:



Open an account in minutes
Experience award-winning platforms with fast and secure execution, and enjoy tight spreads from 0.5 pts on FX and 0.3 pts on indices.
Economic calendar
Web Trader platform
Our sophisticated web-based platform is packed with features.
Related articles

Canadian Dollar Defies Soft CPI as Inflation Expectations Rise
The Canadian dollar strengthens despite CPI missing expectations, as rising long-term inflation expectations complicate the BoC outlook for USD/CAD and AUD/CAD.

AUD/USD: Are Record Short Bets a Breakout Signal or Sentiment Extreme?
Record AUD/USD futures shorts raise the risk of a bearish breakout, but stretched positioning and bullish divergences suggest bears should remain cautious.

Bitcoin Bulls Eye Weekend Bounce as Nasdaq Finds Support
Bitcoin bulls eye a weekend bounce as Nasdaq finds support, BTC holds $80k and bullish reversal signals emerge alongside stronger correlations.
This report is intended for general circulation only. It should not be construed as a recommendation, or an offer (or solicitation of an offer) to buy or sell any financial products. The information provided does not take into account your specific investment objectives, financial situation or particular needs. Before you act on any recommendation that may be contained in this report, independent advice ought to be sought from a financial adviser regarding the suitability of the investment product, taking into account your specific investment objectives, financial situation or particular needs.
StoneX Financial Pte. Ltd., may distribute reports produced by its respective foreign entities or affiliates within the StoneX group of companies or third parties pursuant to an arrangement under Regulation 32C of the Financial Advisers Regulations. Where the report is distributed to a person in Singapore who is not an accredited investor, expert investor or an institutional investor (as defined in the Securities Futures Act), StoneX Financial Pte. Ltd. accepts legal responsibility to such persons for the contents of the report only to the extent required by law. Singapore recipients should contact StoneX Financial Pte. Ltd. at 6826 9988 for matters arising from, or in connection with the report.
In the case of all other recipients of this report, to the extent permitted by applicable laws and regulations neither StoneX Financial Pte. Ltd. nor its associated companies will be responsible or liable for any loss or damage incurred arising out of, or in connection with, any use of the information contained in this report and all such liability is hereby expressly disclaimed. No representation or warranty is made, express or implied, that the content of this report is complete or accurate.
StoneX Financial Pte. Ltd. is not under any obligation to update this report.
Trading CFDs carries a high level of risk that may not be suitable for some investors. Consider your investment objectives, level of experience, financial resources, risk appetite and other relevant circumstances carefully. The possibility exists that you could lose some or all of your investments, including your initial deposits. If in doubt, please seek independent expert advice. Visit www.forex.com/en-sg/terms-and-policies for the complete Risk Disclosure Statement.