



ASX 200 Outlook: SPI Futures Rise, But Resistance Looms Over Rally
SPI 200 futures rose 0.6% overnight, but bearish reversal signals and nearby GEX resistance suggest ASX 200 traders may prefer fading rallies.
Share this:

The ASX 200 suffered another sharp selloff on Thursday, with a bearish engulfing candle forming around its 200-day EMA and monthly pivot point. While SPI 200 futures recovered overnight alongside Wall Street, resistance levels between 8675 and 8750 could prove difficult to overcome if the latest optimism surrounding US-Iran peace talks fades.
View related analysis:
View related analysis:
ASX 200 Rally Faces Key Resistance After Bearish Engulfing Signal
ASX 200 Market Snapshot
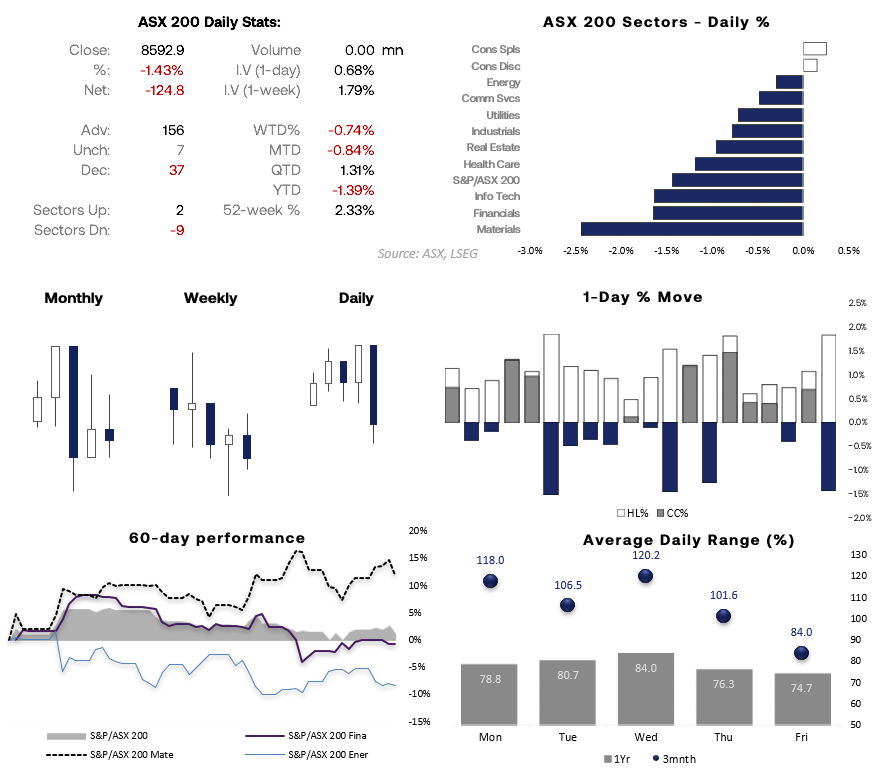
- The ASX 200 suffered a selloff exceeding 1% for the third time in less than two weeks, forming a notable bearish engulfing day
- 9 of the 11 ASX 200 sectors declined, led by Materials (XMJ), Financials (XFJ) and Tech (XTJ), while Consumer Staples (CSJ) and Consumer Discretionary (XDJ) declined
- While the volatility of Thursday could appeal to bears, note that Friday has the lowest daily average range of the week at 85 points over the past year, or 84 points over the past three months
Source: ASX, LSEG
ASX 200 Sector Leaders Flash Bearish Reversal Signals
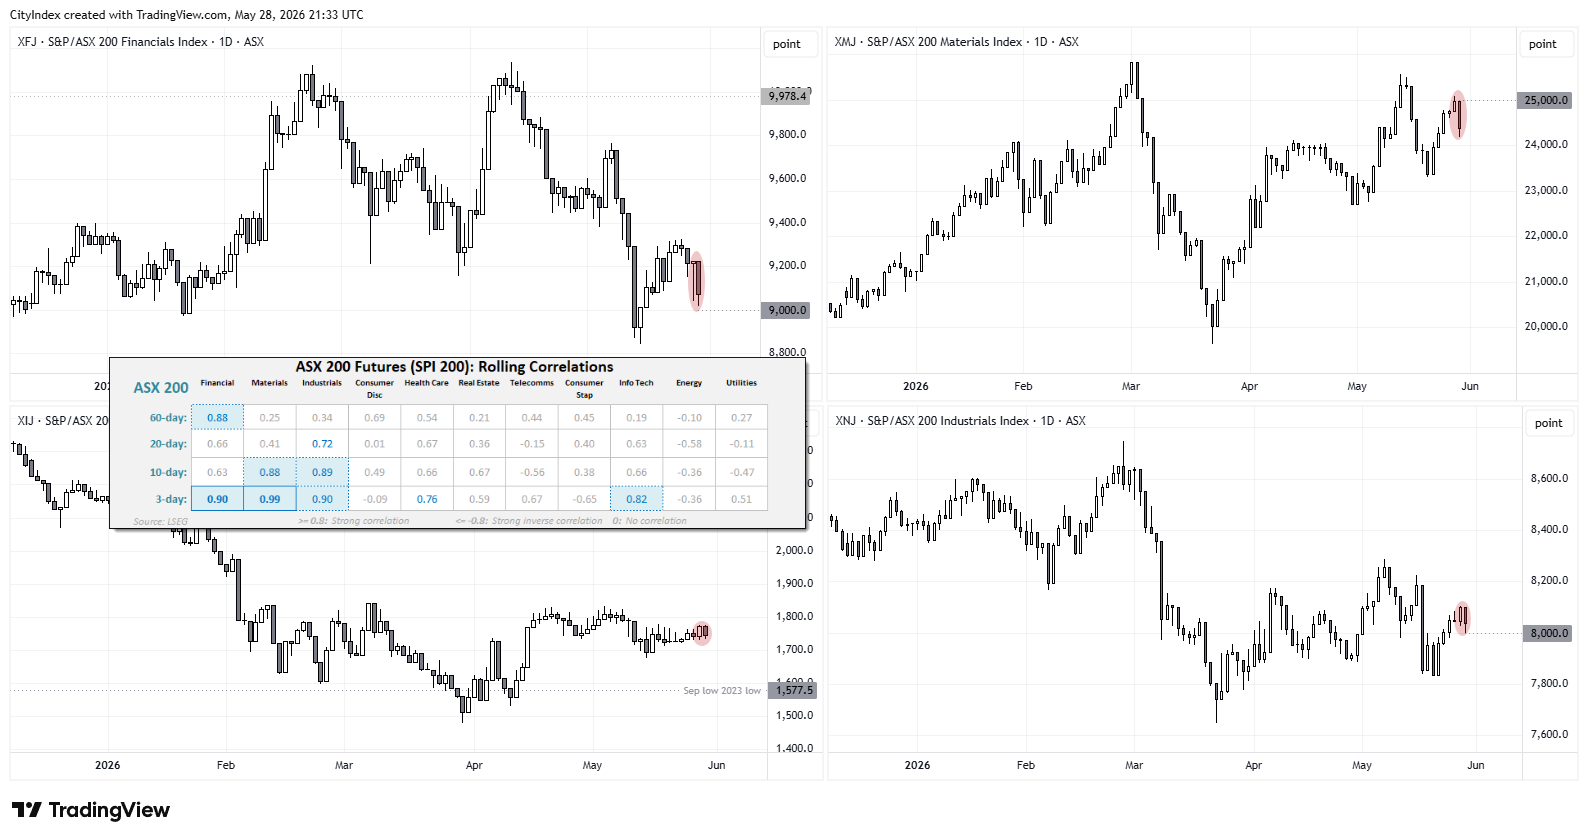
- Financials (XFJ) and Materials (XMJ) — the two largest sectors, accounting for more than half of the ASX 200's market capitalisation — have been the primary drivers of index direction over the past three trading days.
- Correlations have also remained strong with Industrials (XIJ) and Technology (XTJ), although their respective index weightings are much smaller.
- All four sectors traded lower on Thursday. Three formed bearish engulfing candles (where the open and close sit outside the prior day's open and close), while XIJ formed a dark cloud cover, a two-bar bearish reversal pattern.
- XMJ is hinting at a swing high and potential lower high near 25,000. Industrials are threatening a break below 8,000, while attention turns to XFJ to see whether it can hold above 9,000 today.
- That said, it is the last trading day of the month so traders may need to brace themselves for fickle moves as portfolio managers balance their books
Source: ASX, LSEG, TradingView


ASX 200 Technical Analysis
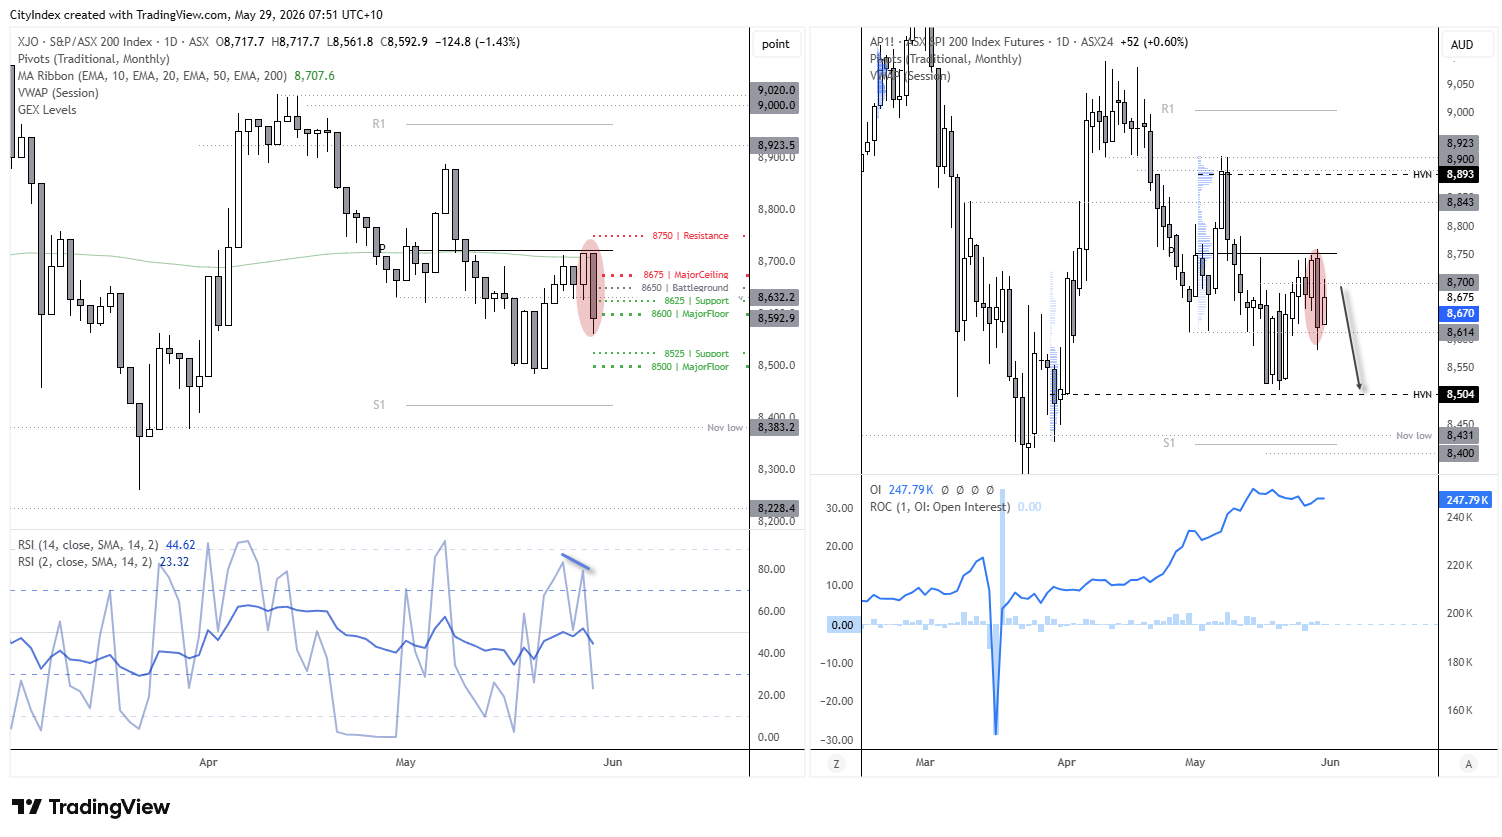
Thursday's bearish engulfing candle formed around the 200-day EMA and monthly pivot point, while a bearish divergence in RSI (2) suggests momentum may be rolling over. Unless headlines surrounding US-Iran peace talks gain further traction, the candle has the hallmarks of a swing high.
SPI 200 futures rose 0.6% overnight, although open interest remained subdued, suggesting the move largely tracked Wall Street rather than reflecting strong domestic conviction. Resistance was found around 8700 overnight, while the monthly pivot point sits closer to 8750 on SPI futures. That leaves me looking to fade rallies into the 8700-8750 zone, particularly if the market struggles to accept above the 8675 gamma ceiling.
ASX 200 GEX Levels and Options Positioning
Options positioning highlights 8675 as the dominant call wall, while 8650 remains a nearby magnet and 8600 a key downside floor. Should the overnight optimism fade, bears may seek opportunities to re-engage shorts around 8675, 8700 or even 8750, with the downside focus returning towards yesterday's cash-market range.
Source: ASX, ASX24, TradingView
View the full economic calendar
View the full economic calendar
-- Written by Matt Simpson
Follow Matt on Twitter @cLeverEdge
How to trade with City Index
You can trade with City Index by following these four easy steps:
- Open an account, or log in if you’re already a customer
• Open an account in the UK
• Open an account in Australia
• Open an account in Singapore
- Search for the market you want to trade in our award-winning platform
- Choose your position and size, and your stop and limit levels
- Place the trade
Related tags:
Latest market news




Open an account in minutes
Experience award-winning platforms with fast and secure execution, and enjoy tight spreads from 0.5 pts on FX and 0.3 pts on indices.
Economic calendar
Web Trader platform
Our sophisticated web-based platform is packed with features.
Related articles
Gold weekly outlook: XAU/USD holds above $4,000 despite strong US jobs data
Gold has held above $4,000 despite a much stronger-than-expected October jobs report. Fawad Razaqzada explains why lower yields and the tech sell-off have supported the metal, and why next week's US CPI could decide its next move.

Australian Dollar Short-term Outlook: AUD/USD 3% Plunge Puts Multi-Month Range at Risk 11 6 2026
A sharp equity-led selloff has driven AUD/USD toward critical June-low support, with strong NFP data adding pressure ahead of next week’s U.S. CPI.

Nasdaq 100 forecast: Tech stocks rebound but AI concerns linger
The Nasdaq 100 rebound has run into former support as fears over AI regulation and spending linger. Fawad Razaqzada explains why he maintains a cautious forecast and where the key levels sit.
This report is intended for general circulation only. It should not be construed as a recommendation, or an offer (or solicitation of an offer) to buy or sell any financial products. The information provided does not take into account your specific investment objectives, financial situation or particular needs. Before you act on any recommendation that may be contained in this report, independent advice ought to be sought from a financial adviser regarding the suitability of the investment product, taking into account your specific investment objectives, financial situation or particular needs.
StoneX Financial Pte. Ltd., may distribute reports produced by its respective foreign entities or affiliates within the StoneX group of companies or third parties pursuant to an arrangement under Regulation 32C of the Financial Advisers Regulations. Where the report is distributed to a person in Singapore who is not an accredited investor, expert investor or an institutional investor (as defined in the Securities Futures Act), StoneX Financial Pte. Ltd. accepts legal responsibility to such persons for the contents of the report only to the extent required by law. Singapore recipients should contact StoneX Financial Pte. Ltd. at 6826 9988 for matters arising from, or in connection with the report.
In the case of all other recipients of this report, to the extent permitted by applicable laws and regulations neither StoneX Financial Pte. Ltd. nor its associated companies will be responsible or liable for any loss or damage incurred arising out of, or in connection with, any use of the information contained in this report and all such liability is hereby expressly disclaimed. No representation or warranty is made, express or implied, that the content of this report is complete or accurate.
StoneX Financial Pte. Ltd. is not under any obligation to update this report.
Trading CFDs carries a high level of risk that may not be suitable for some investors. Consider your investment objectives, level of experience, financial resources, risk appetite and other relevant circumstances carefully. The possibility exists that you could lose some or all of your investments, including your initial deposits. If in doubt, please seek independent expert advice. Visit www.forex.com/en-sg/terms-and-policies for the complete Risk Disclosure Statement.