



ASX 200 Under Pressure as Tech-Led Risk Aversion Spreads
The ASX 200 extends losses as risk-off sentiment weighs on equities, with traders monitoring key support levels around 8600 and 8500.
Share this:

The ASX 200 fell for a second consecutive session on Friday as a technology-led risk-off move spread across global markets. Materials and energy stocks led declines, while healthcare outperformed in a defensive rotation. With volatility elevated, sector correlations strengthening and key support levels coming into focus, traders are assessing whether the recent pullback marks a deeper correction or a pause within the broader recovery from March lows.
View related analysis:
View related analysis:
Risk-Off Mood Weighs on ASX 200 as Tech Weakness Spreads
ASX 200 Market Snapshot
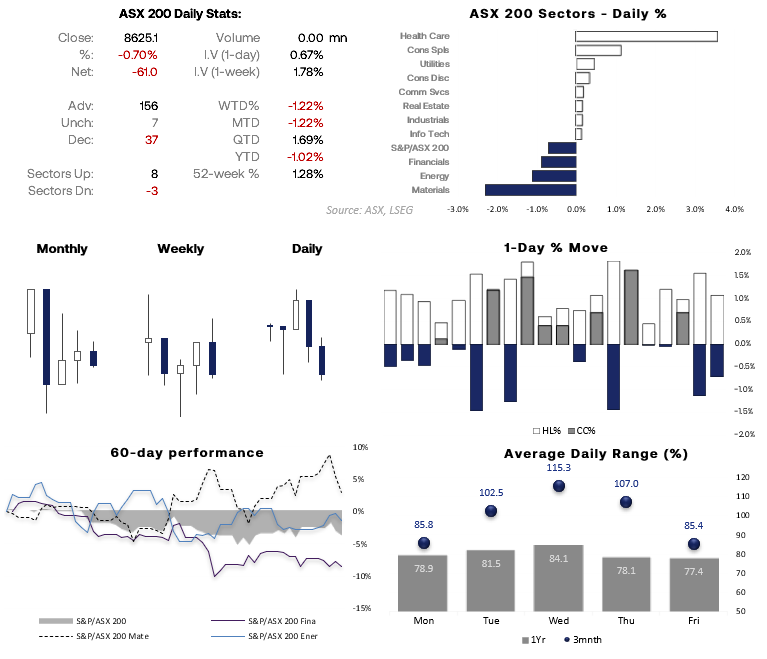
- The ASX 200 closed lower for a second consecutive session on Friday, caught up in the risk-off sentiment emanating from the technology sector.
- Eight of the 11 sectors closed lower, led by Materials (-2.3%) and Energy (-1.1%), while Healthcare (+3.5%) led the three sectors that finished higher.
- SPI 200 futures were little changed overnight.
- Average daily ranges have tended to increase between Monday and Wednesday over the past three months, peaking at 115.3 points and averaging 102.5 points on Tuesdays.
- Volatility has then tailed off into Thursday and Friday, easing to an average daily range of 85.4 points.
- This suggests volatility has been elevated over the past quarter compared with the past year, with 1-year average daily ranges peaking at 84.1 points on Wednesdays and averaging 81.5 points on Tuesdays.
Source: ASX, LSEG
Risk-Off Sentiment Reshapes ASX 200 Sector Relationships
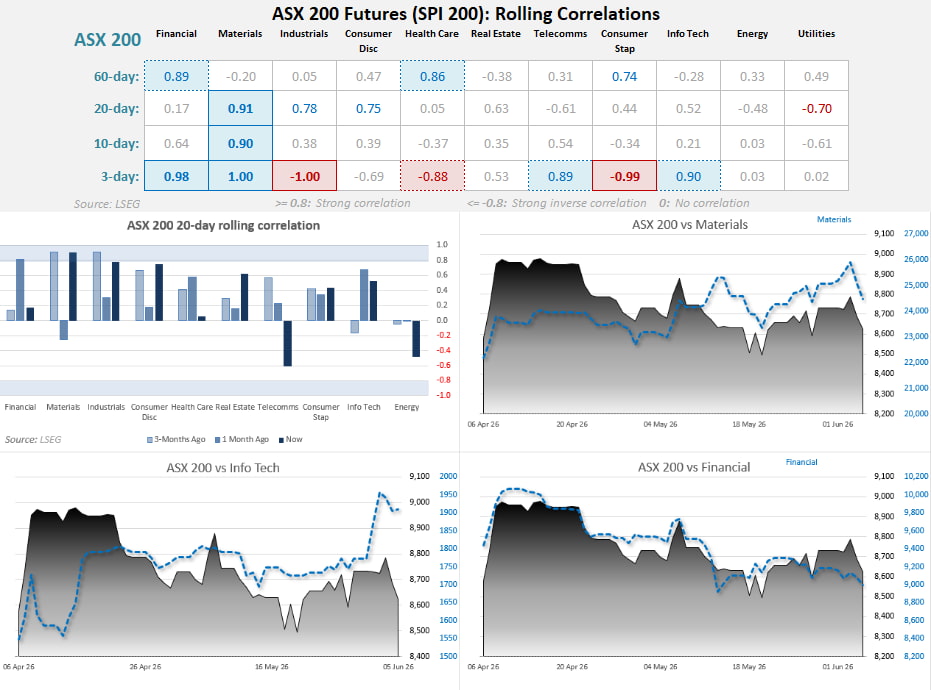
- The materials sector (XMJ) retains one of the strongest correlations with the ASX 200, with readings of 0.90 across the 10- and 20-day lookbacks, rising to a perfect 1.00 over the past three days.
- The risk-off tone driven by renewed Fed hike expectations has seen correlations strengthen across asset classes, with markets increasingly trading either alongside or against broader risk sentiment and the US dollar.
- This has lifted the 3-day correlation between the ASX 200 and the Information Technology sector (XIJ) to 0.90, while Telecommunications (XTJ) has risen to 0.89.
- Meanwhile, Industrials (XNJ) and Consumer Staples (XSJ) acted as defensive havens during the risk-off move late last week.
Source: ASX, LSEG
ASX 200 Technical Analysis
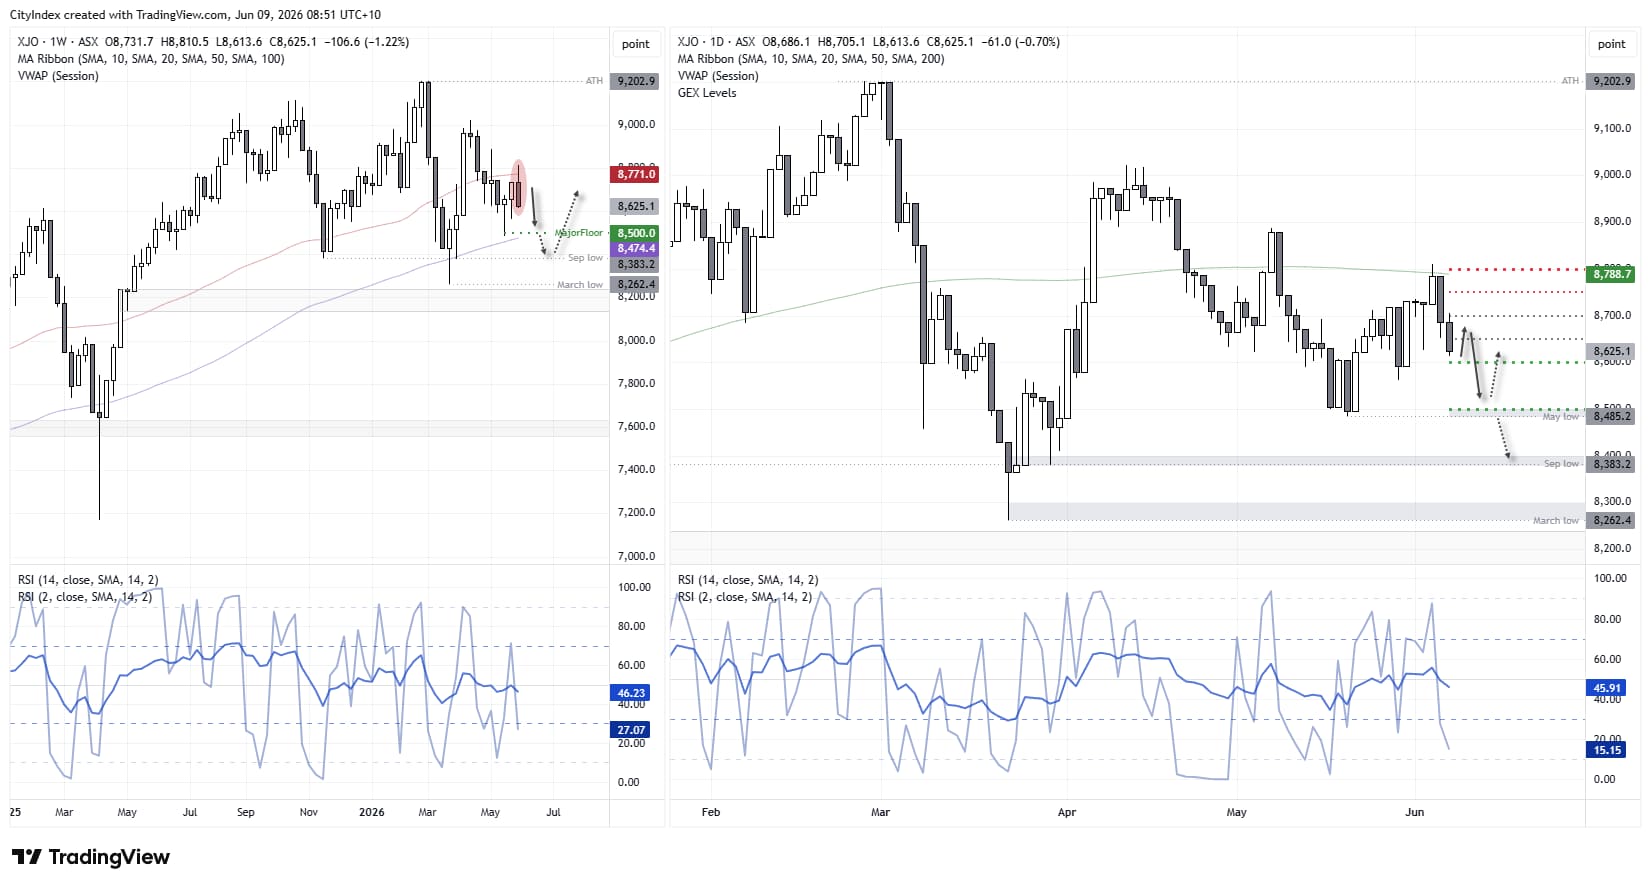
The rally from the May low met resistance at the 200-day SMA before momentum turned lower, shedding half of its gains in just two days. This left a bearish engulfing candle on the weekly chart after the advance stalled around the 50-week SMA. A move back towards 8500, near the May low, remains possible, although I'm reluctant to turn outright bearish given the ASX 200 has already staged a solid recovery from its March low.


ASX 200 Faces Key Test at 8600 Support
A major options support level sits nearby at 8600, and with SPI 200 futures little changed overnight, the index may be able to find some stability today. For now, my bias is that traders will look to fade rallies within Friday's range and target the swing lows around 8500. That area also aligns with a large concentration of put options, making it an important support zone if downside momentum extends.
The risk to the bearish view is that traders fail to break below 8600, which remains a key options support level. Until we see acceptance beneath that level, bears may prefer to wait for a corrective bounce towards 8700 before re-engaging, particularly if prices continue to gravitate towards the large options positioning clustered around that strike.
Source: ASX, TradingView
View the full economic calendar
View the full economic calendar
-- Written by Matt Simpson
Follow Matt on Twitter @cLeverEdge
How to trade with City Index
You can trade with City Index by following these four easy steps:
- Open an account, or log in if you’re already a customer
• Open an account in the UK
• Open an account in Australia
• Open an account in Singapore
- Search for the market you want to trade in our award-winning platform
- Choose your position and size, and your stop and limit levels
- Place the trade
Related tags:
Latest market news




Open an account in minutes
Experience award-winning platforms with fast and secure execution, and enjoy tight spreads from 0.5 pts on FX and 0.3 pts on indices.
Economic calendar
Web Trader platform
Our sophisticated web-based platform is packed with features.
Related articles
S&P 500, Nasdaq, Dow and Russell 2000 For the Week Ahead
Stocks started to shake last week and there was even a hint of this in the prior week. The question now is whether we’re at the point where buyers may abandon pullbacks as get closer to mid-term elections.
Gold weekly outlook: XAU/USD remains stuck between a rock and a hard place
Gold remains at risk of staging a deeper correction. Though the dollar has eased back a bit along with yields, both still remain fundamentally supported.

USD/JPY Weekly Outlook: Volatility Has Left the Building
The yen has ignored broad dollar weakness, falling Treasury yields and renewed market turbulence. Yet its relationship with US interest rates remains intact. So why is USD/JPY going absolutely nowhere fast?

This report is intended for general circulation only. It should not be construed as a recommendation, or an offer (or solicitation of an offer) to buy or sell any financial products. The information provided does not take into account your specific investment objectives, financial situation or particular needs. Before you act on any recommendation that may be contained in this report, independent advice ought to be sought from a financial adviser regarding the suitability of the investment product, taking into account your specific investment objectives, financial situation or particular needs.
StoneX Financial Pte. Ltd., may distribute reports produced by its respective foreign entities or affiliates within the StoneX group of companies or third parties pursuant to an arrangement under Regulation 32C of the Financial Advisers Regulations. Where the report is distributed to a person in Singapore who is not an accredited investor, expert investor or an institutional investor (as defined in the Securities Futures Act), StoneX Financial Pte. Ltd. accepts legal responsibility to such persons for the contents of the report only to the extent required by law. Singapore recipients should contact StoneX Financial Pte. Ltd. at 6826 9988 for matters arising from, or in connection with the report.
In the case of all other recipients of this report, to the extent permitted by applicable laws and regulations neither StoneX Financial Pte. Ltd. nor its associated companies will be responsible or liable for any loss or damage incurred arising out of, or in connection with, any use of the information contained in this report and all such liability is hereby expressly disclaimed. No representation or warranty is made, express or implied, that the content of this report is complete or accurate.
StoneX Financial Pte. Ltd. is not under any obligation to update this report.
Trading CFDs carries a high level of risk that may not be suitable for some investors. Consider your investment objectives, level of experience, financial resources, risk appetite and other relevant circumstances carefully. The possibility exists that you could lose some or all of your investments, including your initial deposits. If in doubt, please seek independent expert advice. Visit www.forex.com/en-sg/terms-and-policies for the complete Risk Disclosure Statement.