




AUD/JPY: Can this FX barometer of risk breakout in 2024?
AUD/JPY is a classic barometer of risk appetite, so for it to stand any chance of breaking the 2022 highs one has to assume no economic landing and continued gains on Wall Street.
Share this:

The ever-so dovish BOJ allowed risk to extend its Santa’s Rally on Tuesday, and for AUD/JPY to get very close to testing a key resistance zone around 99. Whilst I see the potential for it to test this area as we head into January, I remain unconvinced it will simply break above it given the significance of the level. If anything, it could pull back as Santa’s rally fizzles out and the Christmas hangovers weigh on the ‘buy anything’ optimism we appear to be seeing right now.
Still, whilst the RBA do not appear to be on track to hike rates again soon (if at all), the central bank remains relatively hawkish compared with the ultra-dovish BOJ. AUD/JPY is benefitting from the positive yield differential between the two base rates, alongside Santa’s rally which allows risk assets such as the Australian dollar benefit.
In fact, a closer look at its average daily returns in December shows that AUD/JPY tends to generate up days more than 50% of the time between December 20th through to 27th. Most notably is Boxing day with the highest positive average return and second highest win rate of 76.2%.
AUD/JPY technical analysis (monthly chart):
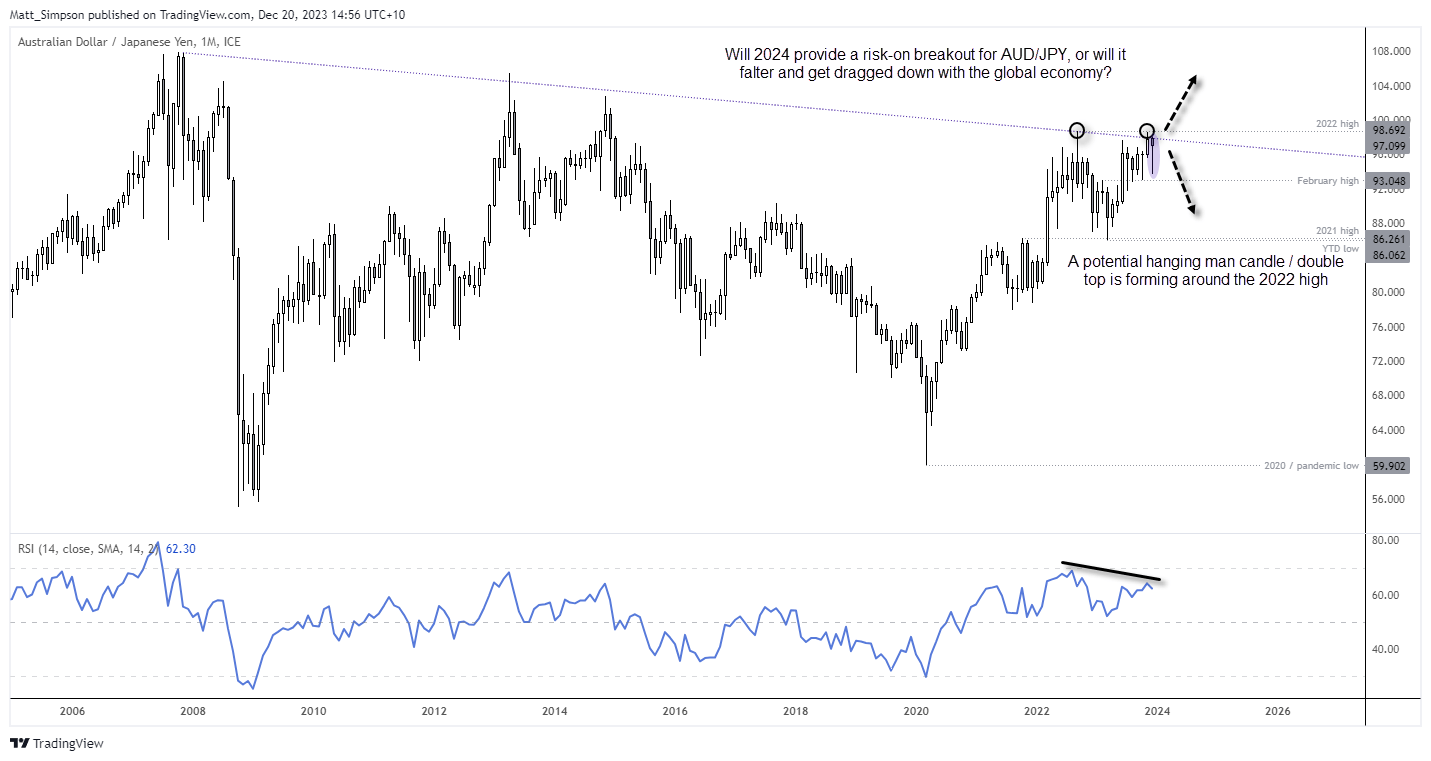
The Aussie yen rose an impressive 64.8% from the March 2020 low to 2022 high. The rally met a spurious trendline before retreating, but I have decided to keep it up and the November monthly candle closed almost perfectly on it to show the markets do seem to be watching it.
I think the biggest question this timeframe leaves with me is whether we’ll see a break above the 2022 high next year, or have we seen the early stages of an almighty double top? Because each scenario requires a very different landscape.
If US equities extend their rallies next year as the global economy skips any sort of landing yet inflation is also tamed, then yes we could very well see a breakout on AUD/JPY due to a risk-on environment. But if the wheels of the global economy fall off and we finally enter the much-telegraphed recession, then AUD/USD is a classic candidate to roll over from key resistance levels and at least produce a deep pullback.
And whilst AUD/JPY has a positive expectancy heading into the new year, take note that its current candle formation is of a hanging man at a key resistance level. This also coincides with a bearish divergence on the RSI 14.
AUD/JPY technical analysis (weekly chart):
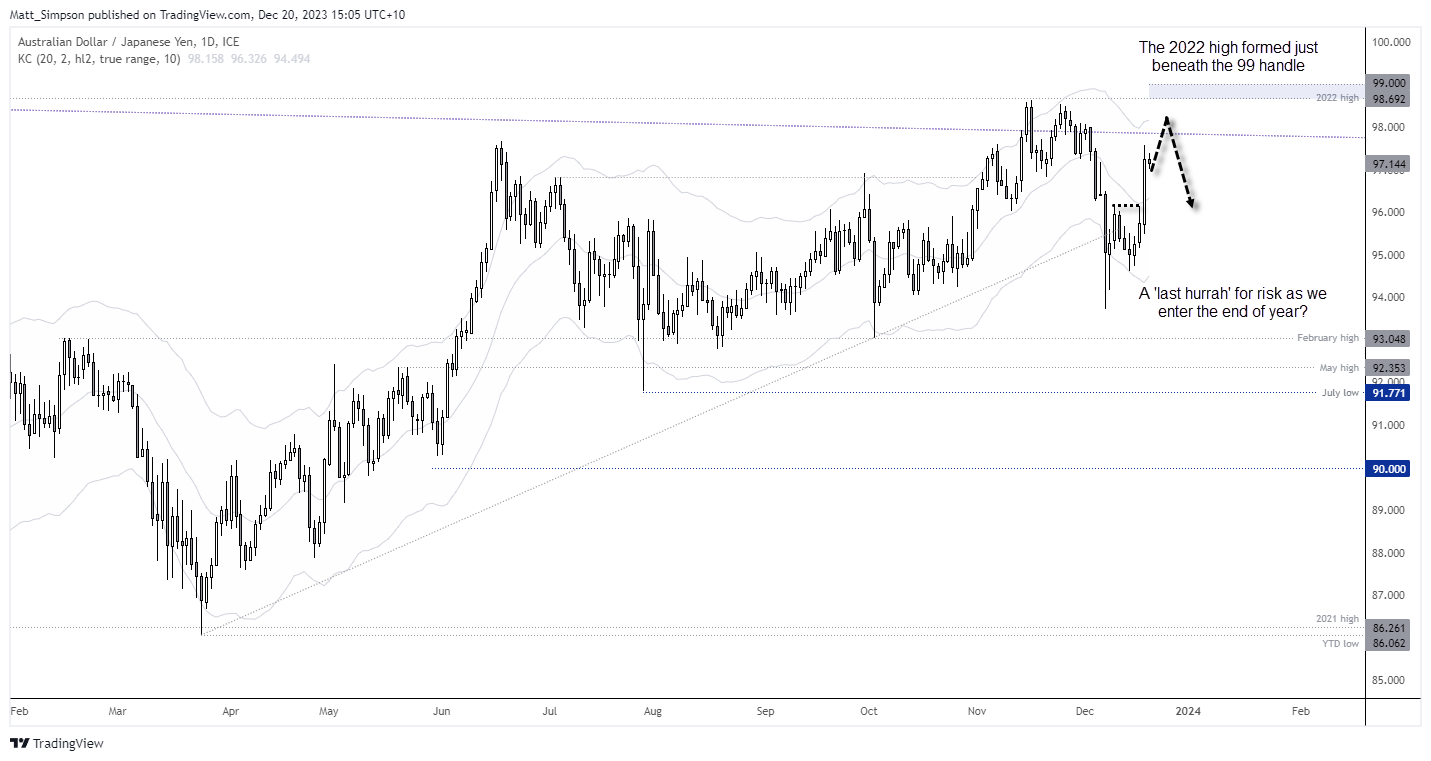
Thanks to the BOJ standing pat, AUD/JPY enjoyed its best day in four months on Tuesday. The strong single-day rally could even be enough to label the trendline break as false given it broke swiftly above a prior cycle high to warn of a bullish trend change on the daily timeframe.
But can it now simply break to new highs? If Santa’s rally can maintain its gravity-defying momentum then perhaps it can at least test the 2022 high, but I would be surprised to see it simply break and hold above the 99 handle. Therefore, I have a cautious bullish bias for the remainder of the month, which will be quickly binned at the first sign of a bearish momentum shift around these highs (such as bearish engulfing candles).
AUD/JPY technical analysis (1-hour chart):
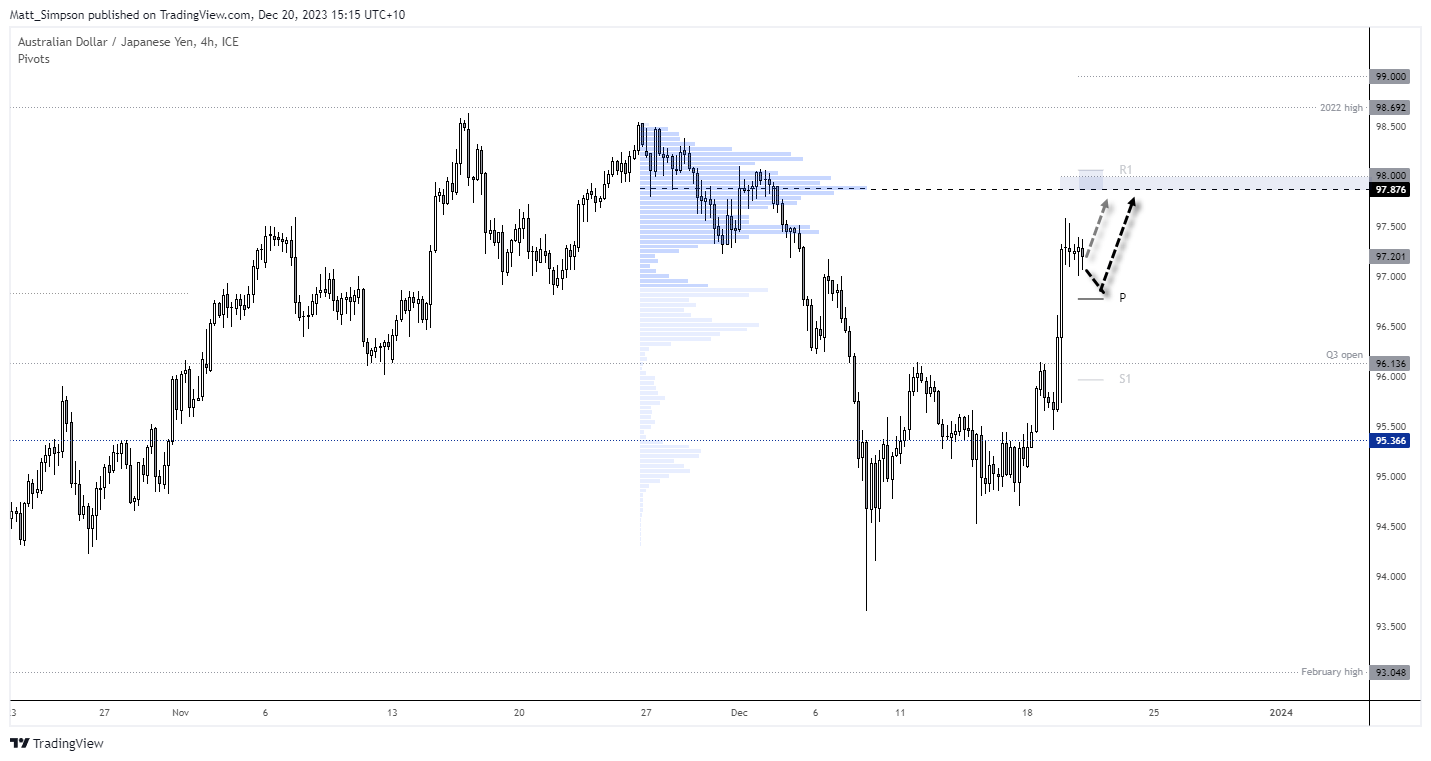
Bulls could seek evidence of if a swing low around the daily pivot point for a long towards 98 – a level which houses the daily R1 pivot and high-volume node from the prior decline. Alternatively, bulls could seek a break above the current consolidation, although this diminishes the reward to risk ratio.
-- Written by Matt Simpson
Follow Matt on Twitter @cLeverEdge
How to trade with City Index
You can trade with City Index by following these four easy steps:
- Open an account, or log in if you’re already a customer
• Open an account in the UK
• Open an account in Australia
• Open an account in Singapore
- Search for the market you want to trade in our award-winning platform
- Choose your position and size, and your stop and limit levels
- Place the trade
Related tags:
Latest market news




Open an account in minutes
Experience award-winning platforms with fast and secure execution, and enjoy tight spreads from 0.5 pts on FX and 0.3 pts on indices.
Economic calendar
Web Trader platform
Our sophisticated web-based platform is packed with features.
Related articles
Fed, DXY, EUR/USD, GBP/USD, USD/CAD, Gold Weekly Technical Outlook 10 26 2026
Sr. Technical Strategist Michael Boutros highlights the levels that matter on the USD Majors, commodities, and equity indices charts this week.
EUR/USD Update: Euro Weakness Returns Ahead of Central Bank Decisions
A new trading week is underway and the euro continues to show signs of weakness in the short term. This can be seen in the recent performance of EUR/USD, which has fallen nearly 0.5% over the last three trading sessions, reflecting a relatively consistent loss of momentum in the European currency.


US Dollar Bulls Hold Firm, but Euro Warns of Squeeze Risk | COT Report
US dollar bulls remain firmly positioned, but record euro shorts have failed to break EUR/USD support, raising the risk of a short-covering rally.
This report is intended for general circulation only. It should not be construed as a recommendation, or an offer (or solicitation of an offer) to buy or sell any financial products. The information provided does not take into account your specific investment objectives, financial situation or particular needs. Before you act on any recommendation that may be contained in this report, independent advice ought to be sought from a financial adviser regarding the suitability of the investment product, taking into account your specific investment objectives, financial situation or particular needs.
StoneX Financial Pte. Ltd., may distribute reports produced by its respective foreign entities or affiliates within the StoneX group of companies or third parties pursuant to an arrangement under Regulation 32C of the Financial Advisers Regulations. Where the report is distributed to a person in Singapore who is not an accredited investor, expert investor or an institutional investor (as defined in the Securities Futures Act), StoneX Financial Pte. Ltd. accepts legal responsibility to such persons for the contents of the report only to the extent required by law. Singapore recipients should contact StoneX Financial Pte. Ltd. at 6826 9988 for matters arising from, or in connection with the report.
In the case of all other recipients of this report, to the extent permitted by applicable laws and regulations neither StoneX Financial Pte. Ltd. nor its associated companies will be responsible or liable for any loss or damage incurred arising out of, or in connection with, any use of the information contained in this report and all such liability is hereby expressly disclaimed. No representation or warranty is made, express or implied, that the content of this report is complete or accurate.
StoneX Financial Pte. Ltd. is not under any obligation to update this report.
Trading CFDs carries a high level of risk that may not be suitable for some investors. Consider your investment objectives, level of experience, financial resources, risk appetite and other relevant circumstances carefully. The possibility exists that you could lose some or all of your investments, including your initial deposits. If in doubt, please seek independent expert advice. Visit www.forex.com/en-sg/terms-and-policies for the complete Risk Disclosure Statement.