





AUD/USD, NZD/USD: Antipodeans in orbit as China proxies pop
The antipodean rally is rolling on, led by the Kiwi’s clean breakout and a bullish Aussie not far behind. With strong correlations to cyclical plays in China, could fresh U.S. trade tensions be the next hurdle—or the next catalyst?
Share this:

- Kiwi at fresh YTD highs after clearing major resistance
- Aussie nearing breakout, uptrend capping for now
- Strong link to China proxies: HSI, copper, silver
- Sentiment towards U.S. trade policy remains key driver
Summary
It’s been another big session of buying across the antipodean currencies in Asia, continuing the pattern seen in recent days. The Kiwi continues to outperform, sending NZD/USD to fresh YTD highs. The Aussie is not far behind, sitting just beneath key resistance. Zooming in, both pairs are showing strong linkages to cyclical plays tied to China, suggesting sentiment towards U.S. tariff policy remains a key driver near-term.
AUD, NZD Enjoy Asia Buying Spree
You can see the monotonous bid in AUD/USD and NZD/USD on the five-minute tick chart below, with the start of the Asian session indicated by the vertical dashed lines. Often, buying in both pairs has kicked in as larger markets across the region come online, including Japan and China. The Kiwi, in particular, has attracted strong demand in recent sessions.
Source: TradingView
It’s also notable that the bid in both pairs occurred alongside strong countertrend bounces in Chinese and China-linked markets. The correlation analysis below confirms the close alignment both the Aussie and Kiwi have had with Hang Seng futures (red), Hang Seng Tech futures (yellow), COMEX copper futures (blue) and the spot silver price (black) over the past five days.
Source: TradingView
Sure, the timeframe is limited and carries the usual caveats—but the relationship between the antipodean currencies and these markets has been close to perfect. That’s not easily dismissed as coincidence.
AUD/USD Nears Key Upside Test
Source: TradingView
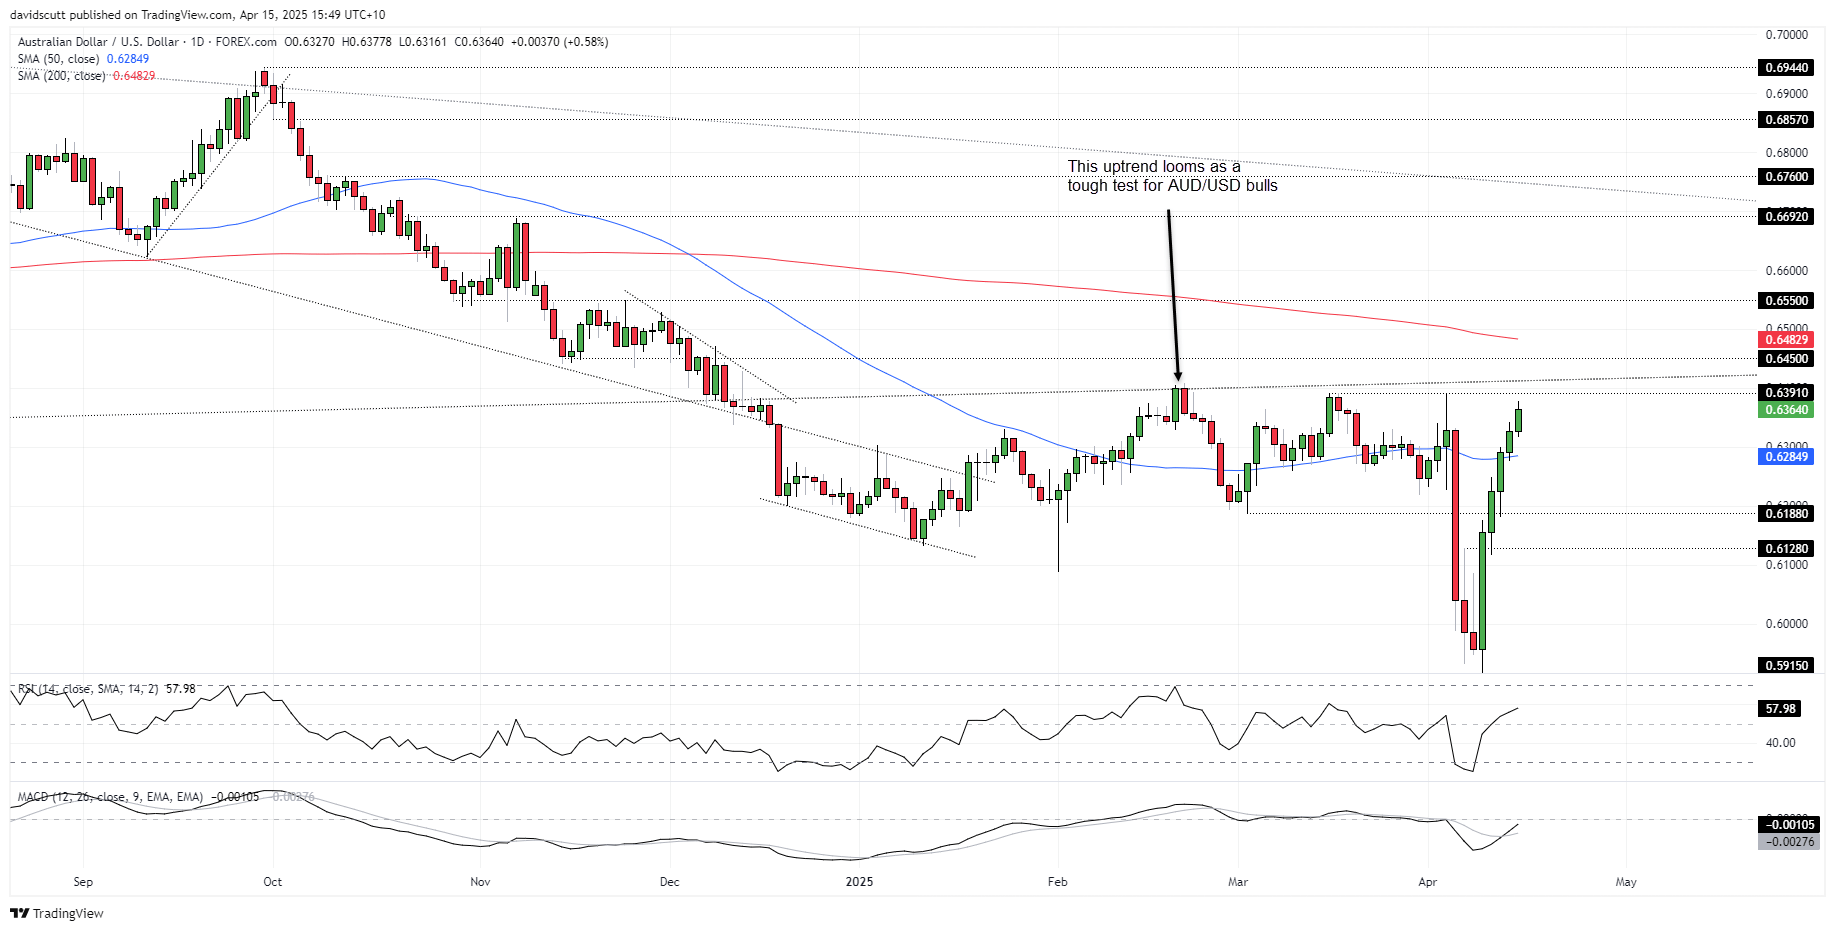
AUD/USD is now threatening to break to fresh YTD highs, closing in on key uptrend resistance. It’s found around .6415 today, with minor horizontal resistance located just ahead of it at .6391.
Momentum indicators are swinging bullish, with RSI (14) trending higher but not yet overbought. MACD is offering a more nuanced picture—crossing the signal line from below, but still below zero. The broader message: upside momentum is building.
If AUD/USD breaks and holds above the uptrend, .6450, the 200-day moving average, and .6550 are levels to watch. On the downside, a reversal from current levels would bring the 50-day moving average into play.
NZD/USD Clears 200DMA
Source: TradingView
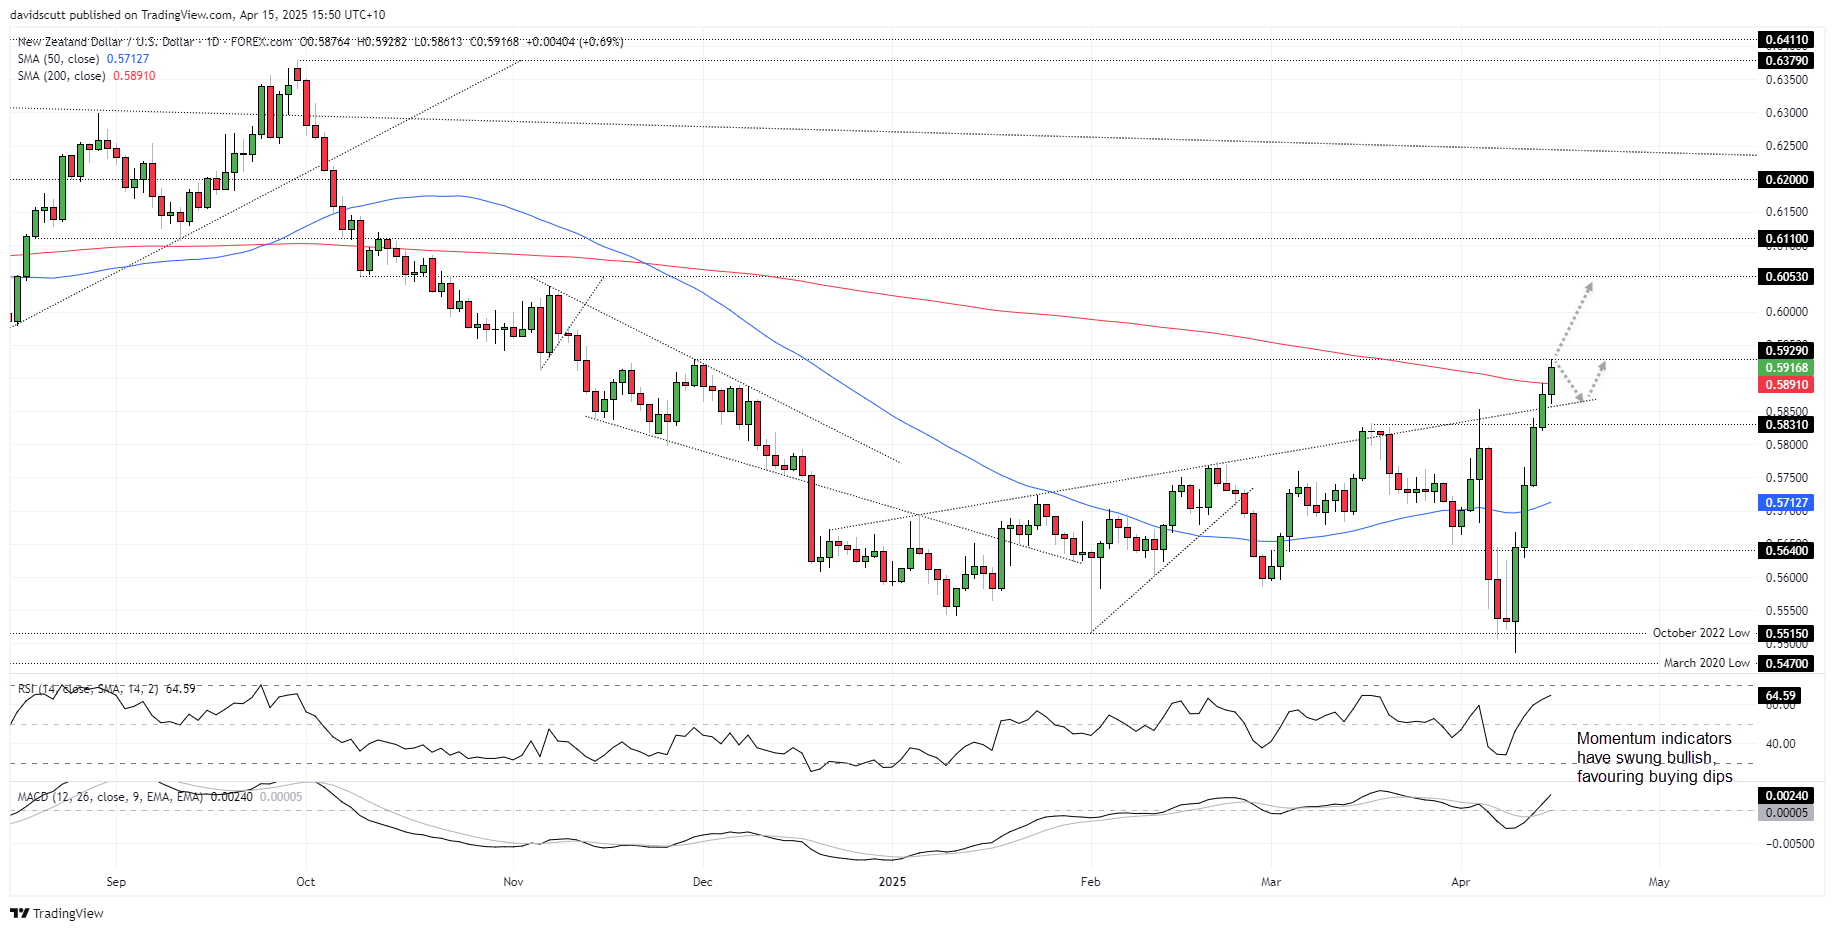
NZD/USD has already gone one better than the Aussie, hitting YTD highs on Monday after breaking and closing above uptrend resistance established in late 2024. The Kiwi has extended the move today, climbing above the 200-day moving average before stalling at the November 2024 swing high of .5929. That’s the first topside level to watch, with a break putting .6053 on the radar for bulls. Having already cleared them, the 200-day moving average and uptrend may now attract buyers on any pullback.
Both RSI (14) and MACD sit in positive territory and are trending higher, favouring a bullish bias. That suggests buying dips over selling rips may be the more fruitful approach for now.
-- Written by David Scutt
Follow David on Twitter @scutty
How to trade with City Index
You can trade with City Index by following these four easy steps:
- Open an account, or log in if you’re already a customer
• Open an account in the UK
• Open an account in Australia
• Open an account in Singapore
- Search for the market you want to trade in our award-winning platform
- Choose your position and size, and your stop and limit levels
- Place the trade
Related tags:
Latest market news




Open an account in minutes
Experience award-winning platforms with fast and secure execution, and enjoy tight spreads from 0.5 pts on FX and 0.3 pts on indices.
Economic calendar
Web Trader platform
Our sophisticated web-based platform is packed with features.
Related articles
Canadian Dollar Analysis: USD/CAD Returns to July Highs Ahead of NFP
The Canadian dollar continues to face one of its most challenging environments in recent months when it comes to maintaining strength against the U.S. dollar. The weakness of the Canadian currency is clearly reflected in USD/CAD, which has now recorded nine consecutive bullish sessions and gained more than 1.7% during that period.
US Dollar Technical Outlook: DXY Bulls Meet Resistance at Yearly Highs 10 1 2026
The U.S. Dollar has held firm despite fading Fed hike bets, but Friday’s payrolls could test the rally’s staying power.


Dow Jones forecast: Stock markets under pressure from multiple sources
When looking at the major tech-heavy US indices like the S&P 500 or the Nasdaq 100, you wouldn’t think that the stock market is particularly weak. Yet, beneath the surface, the market is far from healthy right now. Investors are evidently just piling into the big tech and AI names, and as a result, market breadth is deteriorating. Other indices like the small cap Russell 2000 and the Dow Jones are starting to reflect that weakness.

This report is intended for general circulation only. It should not be construed as a recommendation, or an offer (or solicitation of an offer) to buy or sell any financial products. The information provided does not take into account your specific investment objectives, financial situation or particular needs. Before you act on any recommendation that may be contained in this report, independent advice ought to be sought from a financial adviser regarding the suitability of the investment product, taking into account your specific investment objectives, financial situation or particular needs.
StoneX Financial Pte. Ltd., may distribute reports produced by its respective foreign entities or affiliates within the StoneX group of companies or third parties pursuant to an arrangement under Regulation 32C of the Financial Advisers Regulations. Where the report is distributed to a person in Singapore who is not an accredited investor, expert investor or an institutional investor (as defined in the Securities Futures Act), StoneX Financial Pte. Ltd. accepts legal responsibility to such persons for the contents of the report only to the extent required by law. Singapore recipients should contact StoneX Financial Pte. Ltd. at 6826 9988 for matters arising from, or in connection with the report.
In the case of all other recipients of this report, to the extent permitted by applicable laws and regulations neither StoneX Financial Pte. Ltd. nor its associated companies will be responsible or liable for any loss or damage incurred arising out of, or in connection with, any use of the information contained in this report and all such liability is hereby expressly disclaimed. No representation or warranty is made, express or implied, that the content of this report is complete or accurate.
StoneX Financial Pte. Ltd. is not under any obligation to update this report.
Trading CFDs carries a high level of risk that may not be suitable for some investors. Consider your investment objectives, level of experience, financial resources, risk appetite and other relevant circumstances carefully. The possibility exists that you could lose some or all of your investments, including your initial deposits. If in doubt, please seek independent expert advice. Visit www.forex.com/en-sg/terms-and-policies for the complete Risk Disclosure Statement.