



Bitcoin Breaks Out in a Big Way as Anti-Dollar Flows Shift from Gold
The delayed fuse between BTC/USD and Gold was lit this week and BTC/USD is now working on its strongest week since last September with a current 14.2% gain.
Share this:

BTC/USD Talking Points:
- The $65k level was hard resistance that gave bulls difficulty over a few different tests, but that’s now in the rearview following a massive breakout on the back of increased Treasury buybacks.
- I had written about this on Monday, highlighting the bullish structure in Bitcoin as a higher-low support hold led to another push towards that $65k level. Now buyers are in the driver’s seat as BTC/USD is approaching its strongest weekly outing since last September before the 125k top was set.

While much of the world likes to equate Bitcoin and Gold as being anti-dollar competitors, the reality is timing in the two markets is often quite different. I highlighted this on Monday, how there’s been a tendency for gold to lead the way higher and then for Bitcoin to take over on more than one occasion. This was a big part of the Covid boom in the summer of 2020, when Gold found resistance at $2k in August of that year and, at the time, Bitcoin was vying to get back above the $12k marker. Of course, Gold then ranged for three-plus years as BTC/USD went through multiple cycles, eventually setting a high at $69k.
Another episode appeared around the second election win of Donald Trump, who courted the crypto crowd quite clearly ahead of his November win. About a week before that, with Trump ahead in the polls, Gold prices calmed and pulled back after a near 40% run in the prior seven months. Bitcoin then got bullish in a very big way and once again, as Gold prices calmed BTC/USD went vertical.
More recently, however, BTC/USD has been on its back foot, even as Gold put in another significant rally late last year. So, when Gold came to life again a few weeks ago following the FOMC meeting and the BoJ intervention, it seemed there was little expectation that BTC/USD would follow.
But – as I highlighted two weeks ago the bullish structure in Bitcoin was still there, and the cryptocurrency had held higher-lows at a significant spot and that kept the door open for an eventual re-test and then break of the $65k handle, and that’s what’s panned out over the past 24 hours.
BTC/USD Daily Chart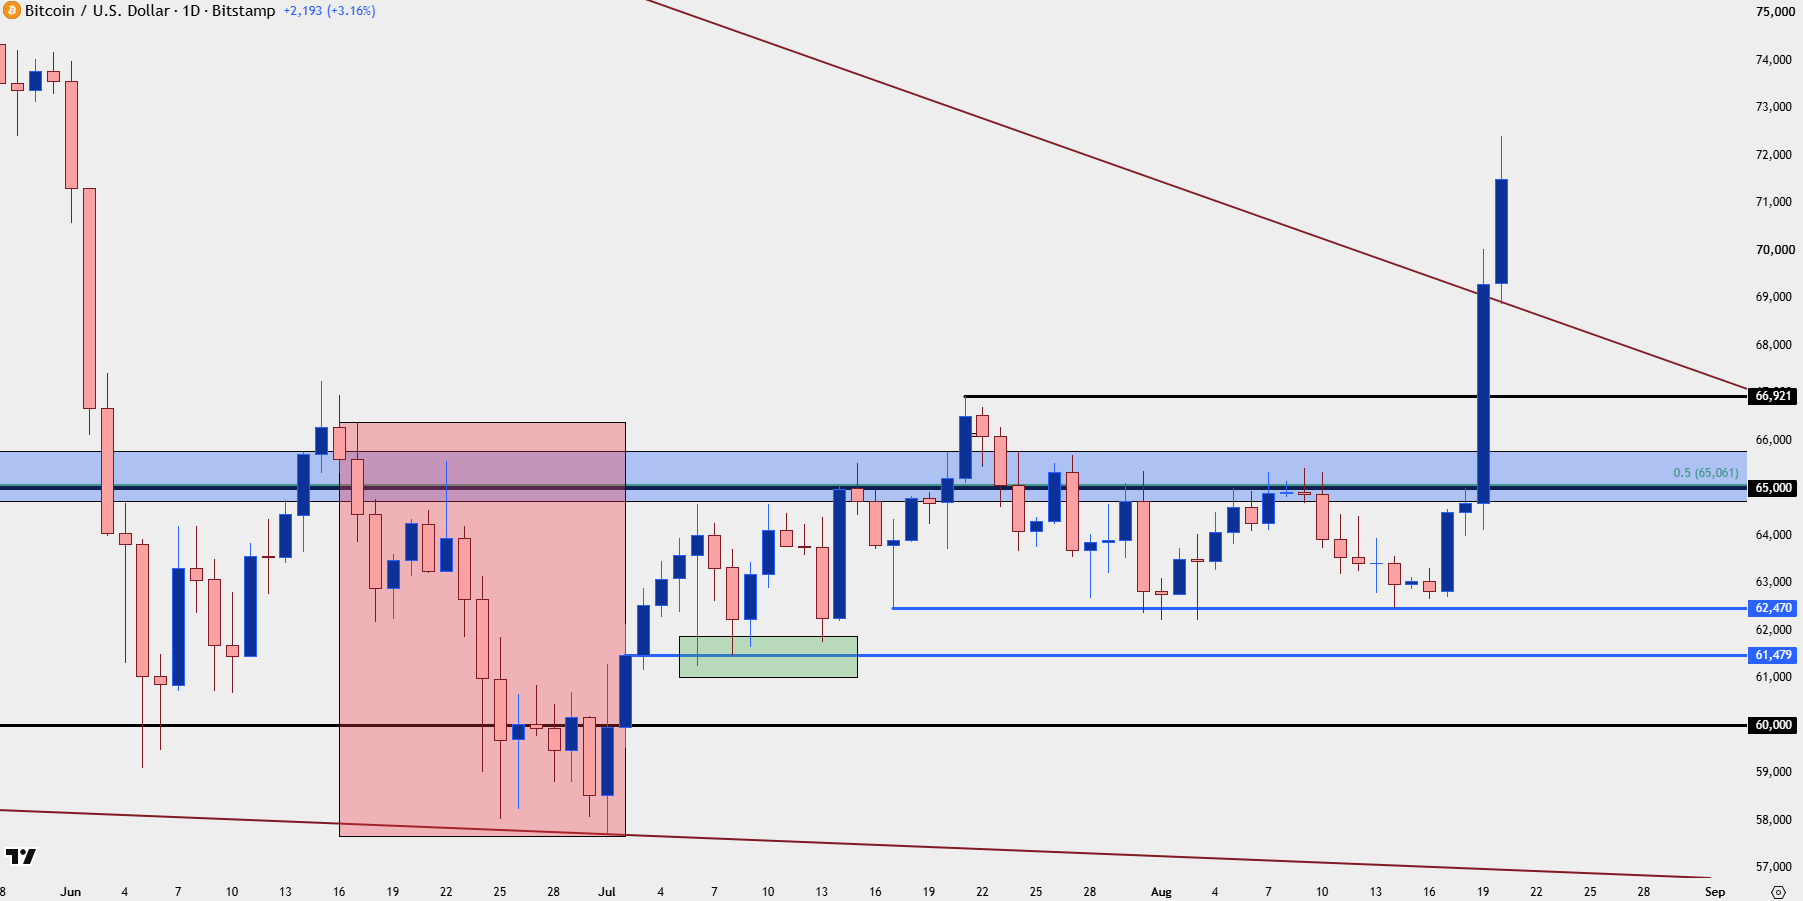
Chart prepared by James Stanley; data derived from Tradingview
BTC/USD – Has the Train Left the Station?
The complication now is just how aggressive the move priced-in, and with such a rally into a new trend there was likely a lot of short squeezing taking place. But traders without positions are now faced with an unenviable set of choices: Either chase an overbought move or wait and see if it pulls back to allow for entry into a fresh bullish trend. To be clear, neither is perfect and only time will tell which is optimal. But, for the trader, the choice is essentially to yield to excitement or risk missing the boat, and only one of those choices comes with the assurance of lost capital in unfavorable scenarios.
The big picture hope – given the current structure there’s now a fresh breakout in Bitcoin from the weekly chart, as price is pushing through the top of a falling wedge formation. If that’s to continue, then there should be a new trend to follow, which could allow for entry or re-entry on pullbacks, if that new theme is to come to pass.
BTC/USD Weekly Chart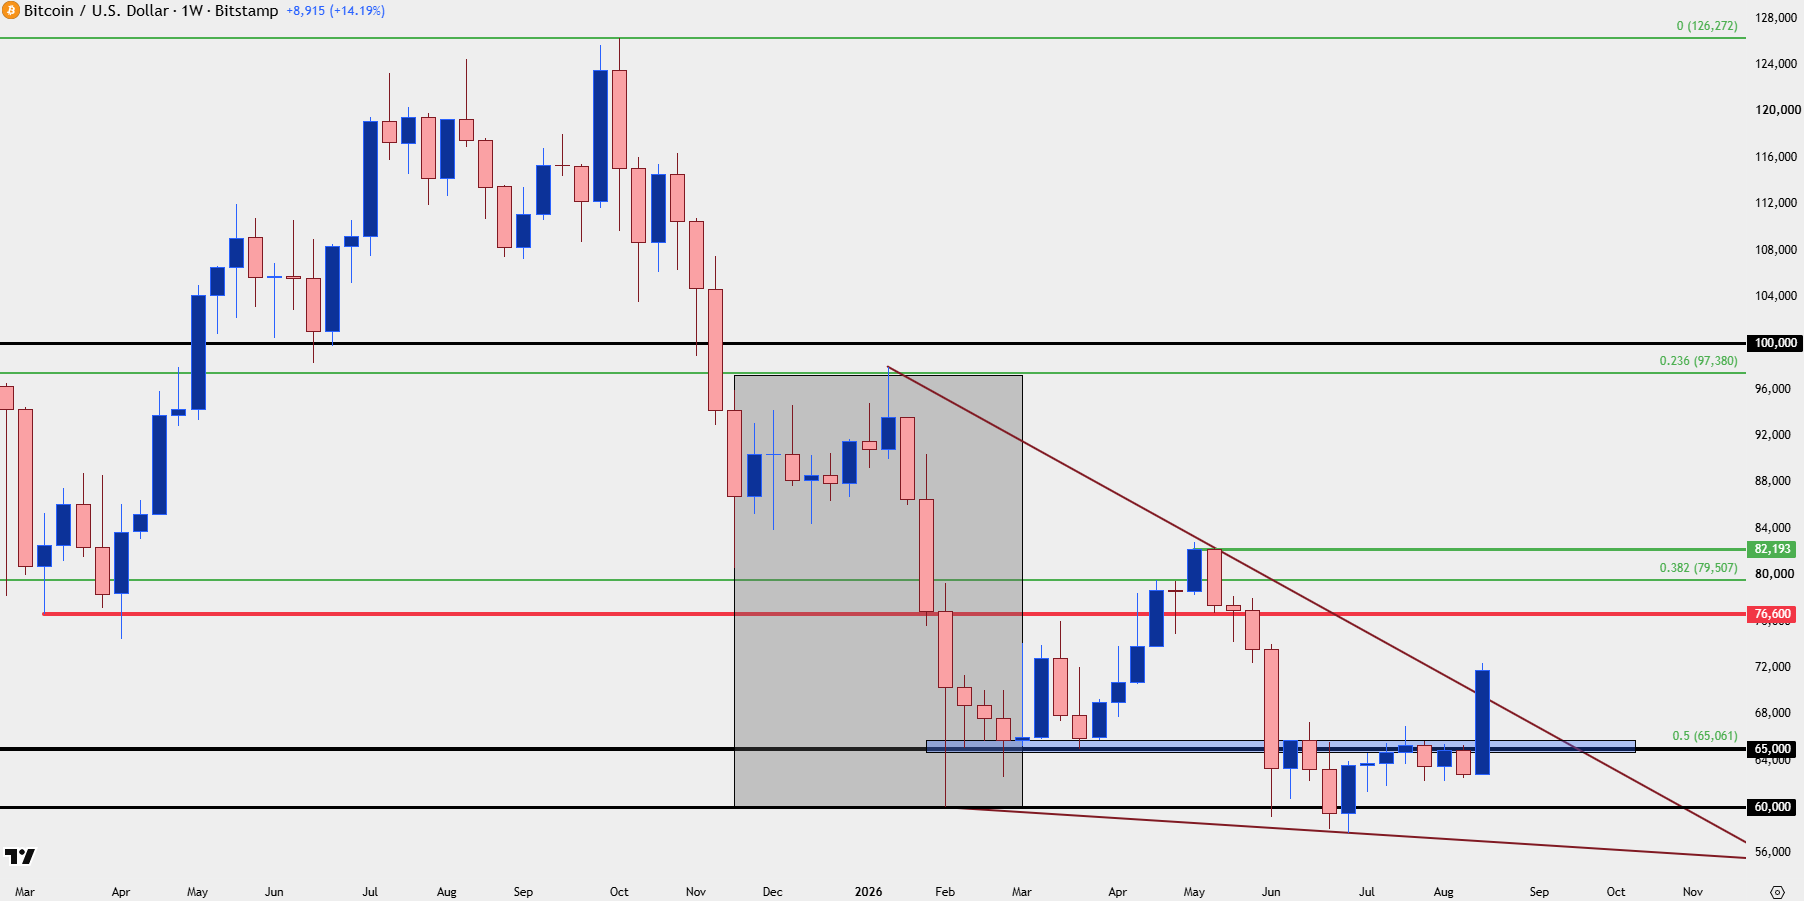
Chart prepared by James Stanley; data derived from Tradingview
BTC/USD Shorter-Term
Another reason that I think this move is at least partially fueled by a short squeeze is the dynamics behind price action, as each recurrent test of resistance has been met by a strong extension of the move. And there’s been a big jump at both 65k and 70k, so stops on short positions sitting at or just above those thresholds become another jolt of demand when price triggers execution.
At this point, the rally has stalled at a prior swing low, just inside of 72,500. And for this to be a ‘healthy’ trend, we should see some profit taking given the massive leap, which sets up for the possibility of a 70k re-test, and below that, the prior resistance at 67k also jumps out as important.
While the 70k level might seem like a stretch from where we’re at now, it’s right around a 23.6% retracement of the rally from this week alone, so that sets up for an attractive spot for bulls to defend in that profit taking scenario.
BTC/USD Four-Hour Chart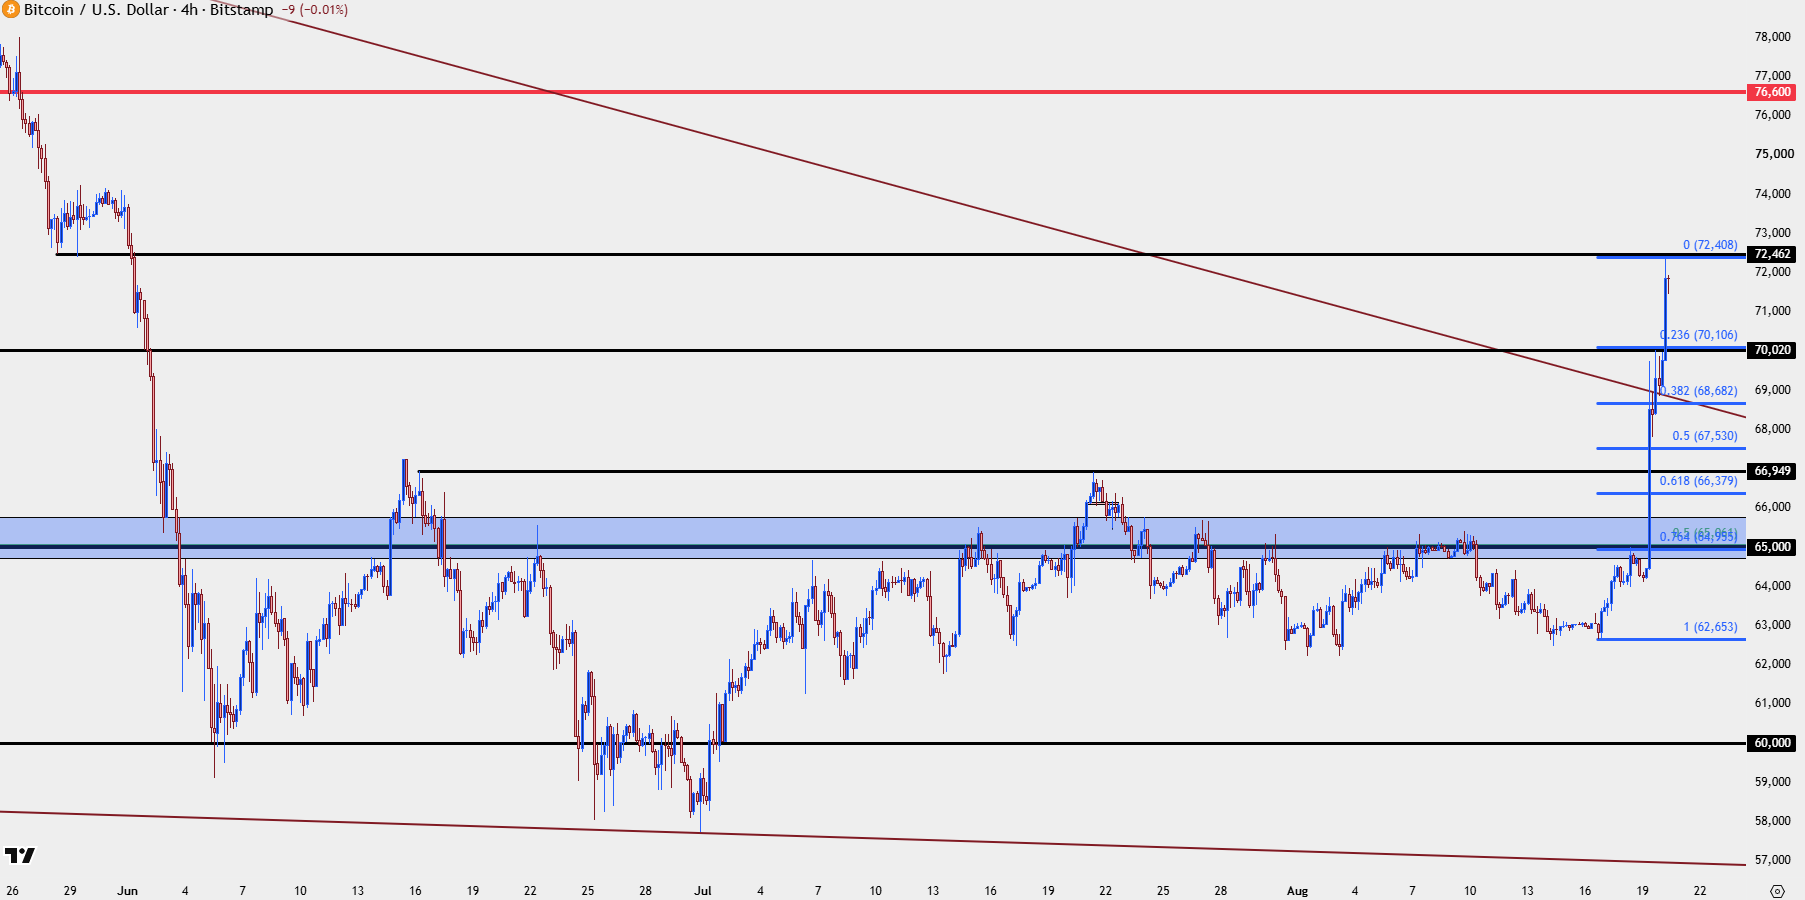
Chart prepared by James Stanley; data derived from Tradingview
--- written by James Stanley, Senior Market Analyst, Global Macro
Related tags:
Latest market news




Open an account in minutes
Experience award-winning platforms with fast and secure execution, and enjoy tight spreads from 0.5 pts on FX and 0.3 pts on indices.
Economic calendar
Web Trader platform
Our sophisticated web-based platform is packed with features.
Related articles
US Dollar Price Action Setups: EUR/USD, USD/JPY, GBP/USD, USD/CAD
The Dollar is working on its second consecutive red week and while sellers didn’t exactly pounce on fresh lows, there’s an opening door for bears to make a move.

USD/JPY Sinks to Familiar Support as Risk Off Fears Grow
Stocks are selling off in both the US and Japan and USD/JPY has started to show a degree of strain, with a pullback to a key support level even as USD-strength remains in-force elsewhere.

EUR/USD Tries to Turn, Stumbles So Far
Both US Dollar strength and EUR/USD weakness were looking long-in-the-tooth last week, and the initial semblance of reversal started to show. But kicking into a new trend has been harder than imagined so far.
This report is intended for general circulation only. It should not be construed as a recommendation, or an offer (or solicitation of an offer) to buy or sell any financial products. The information provided does not take into account your specific investment objectives, financial situation or particular needs. Before you act on any recommendation that may be contained in this report, independent advice ought to be sought from a financial adviser regarding the suitability of the investment product, taking into account your specific investment objectives, financial situation or particular needs.
StoneX Financial Pte. Ltd., may distribute reports produced by its respective foreign entities or affiliates within the StoneX group of companies or third parties pursuant to an arrangement under Regulation 32C of the Financial Advisers Regulations. Where the report is distributed to a person in Singapore who is not an accredited investor, expert investor or an institutional investor (as defined in the Securities Futures Act), StoneX Financial Pte. Ltd. accepts legal responsibility to such persons for the contents of the report only to the extent required by law. Singapore recipients should contact StoneX Financial Pte. Ltd. at 6826 9988 for matters arising from, or in connection with the report.
In the case of all other recipients of this report, to the extent permitted by applicable laws and regulations neither StoneX Financial Pte. Ltd. nor its associated companies will be responsible or liable for any loss or damage incurred arising out of, or in connection with, any use of the information contained in this report and all such liability is hereby expressly disclaimed. No representation or warranty is made, express or implied, that the content of this report is complete or accurate.
StoneX Financial Pte. Ltd. is not under any obligation to update this report.
Trading CFDs carries a high level of risk that may not be suitable for some investors. Consider your investment objectives, level of experience, financial resources, risk appetite and other relevant circumstances carefully. The possibility exists that you could lose some or all of your investments, including your initial deposits. If in doubt, please seek independent expert advice. Visit www.forex.com/en-sg/terms-and-policies for the complete Risk Disclosure Statement.