



Bitcoin, DJIA Outlook: Risk-Off Sentiment Holds
Bitcoin, DJIA Outlook: Bitcoin and the Dow Jones Industrial Average are facing renewed risk-off pressure as crude oil prices and U.S. Treasury yields continue to move higher.
Share this:

Bitcoin and the Dow Jones Industrial Average are facing renewed risk-off pressure as crude oil prices and U.S. Treasury yields continue to move higher.
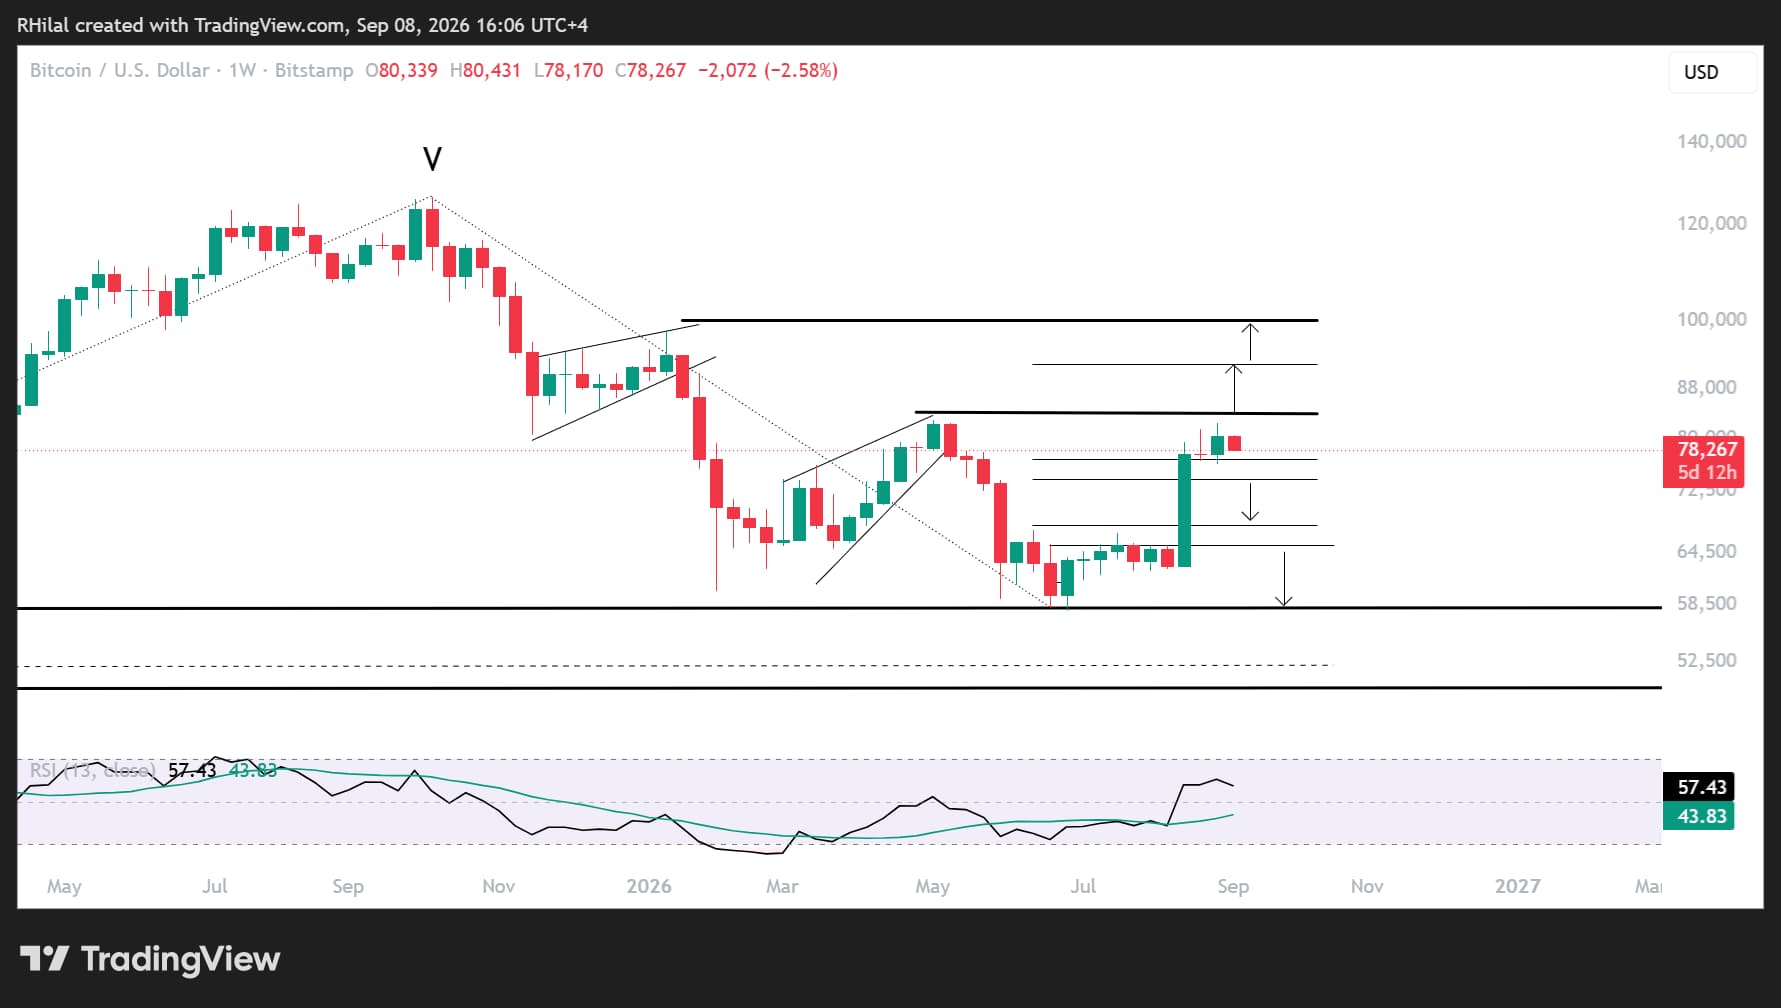
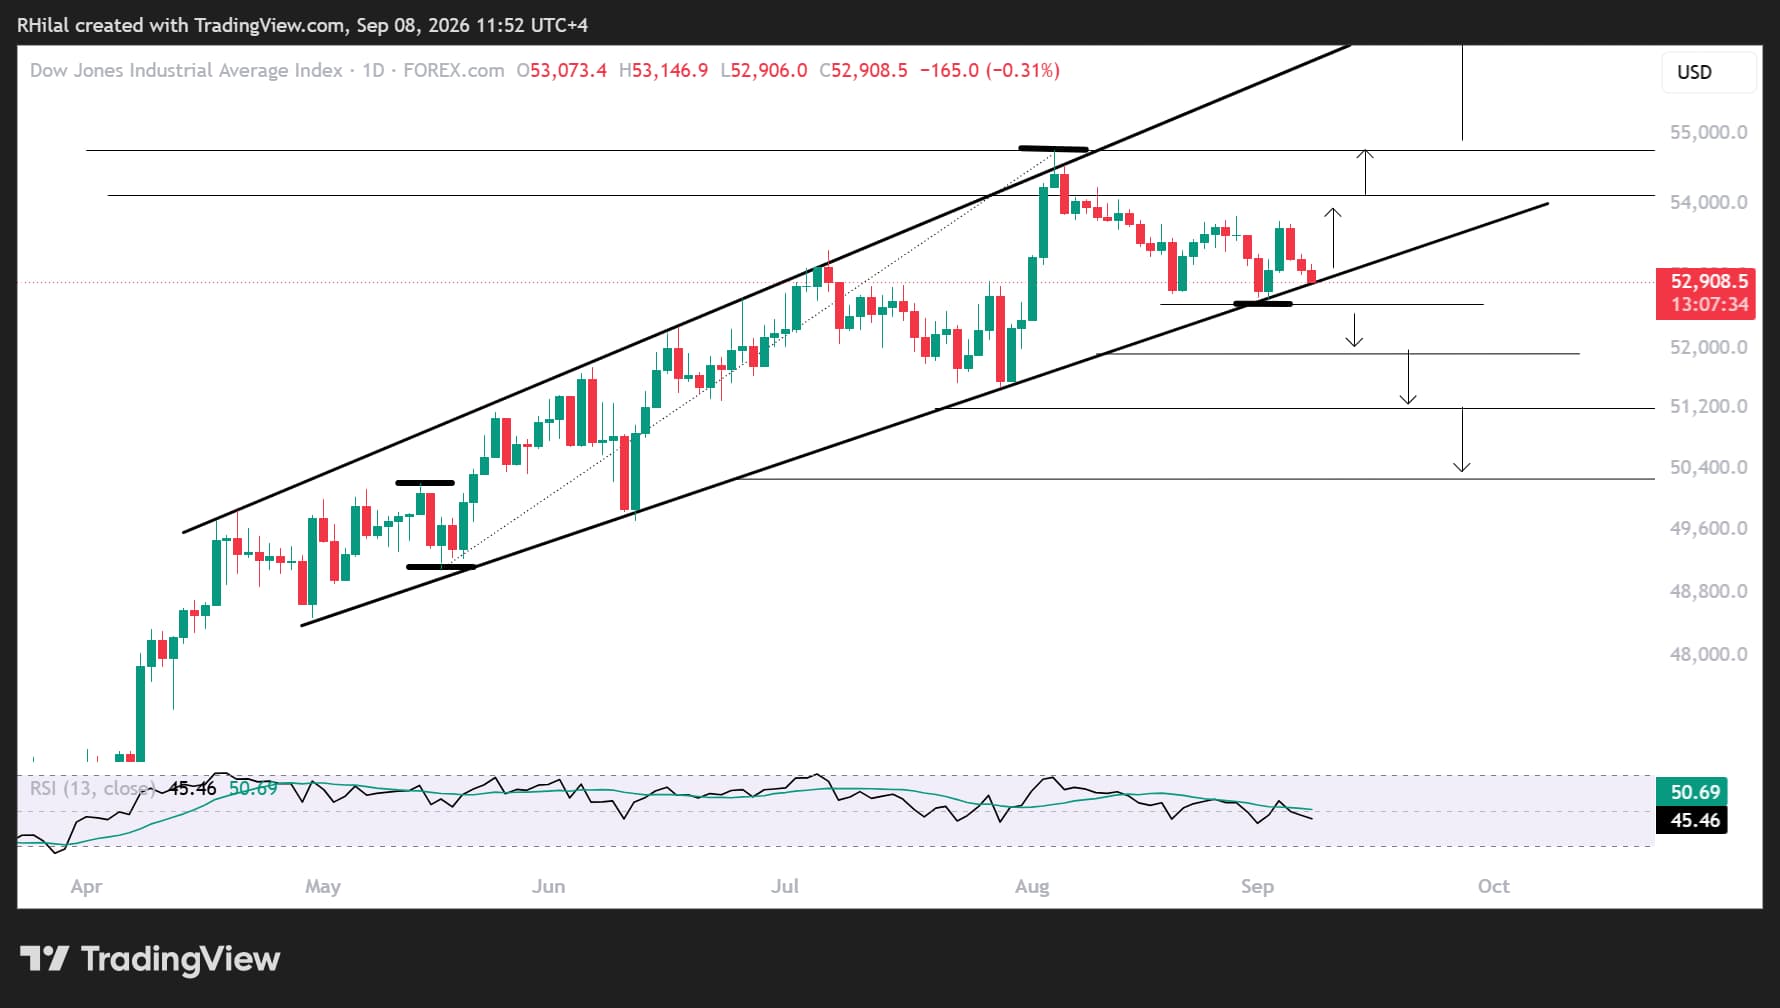
Bitcoin is testing resistance that has held since May 2026, while the Dow is approaching a potential breakdown below a 4-month support level.
Several factors are currently shaping the market outlook:
- WTI is testing a bullish breakout above a 7-month resistance level.
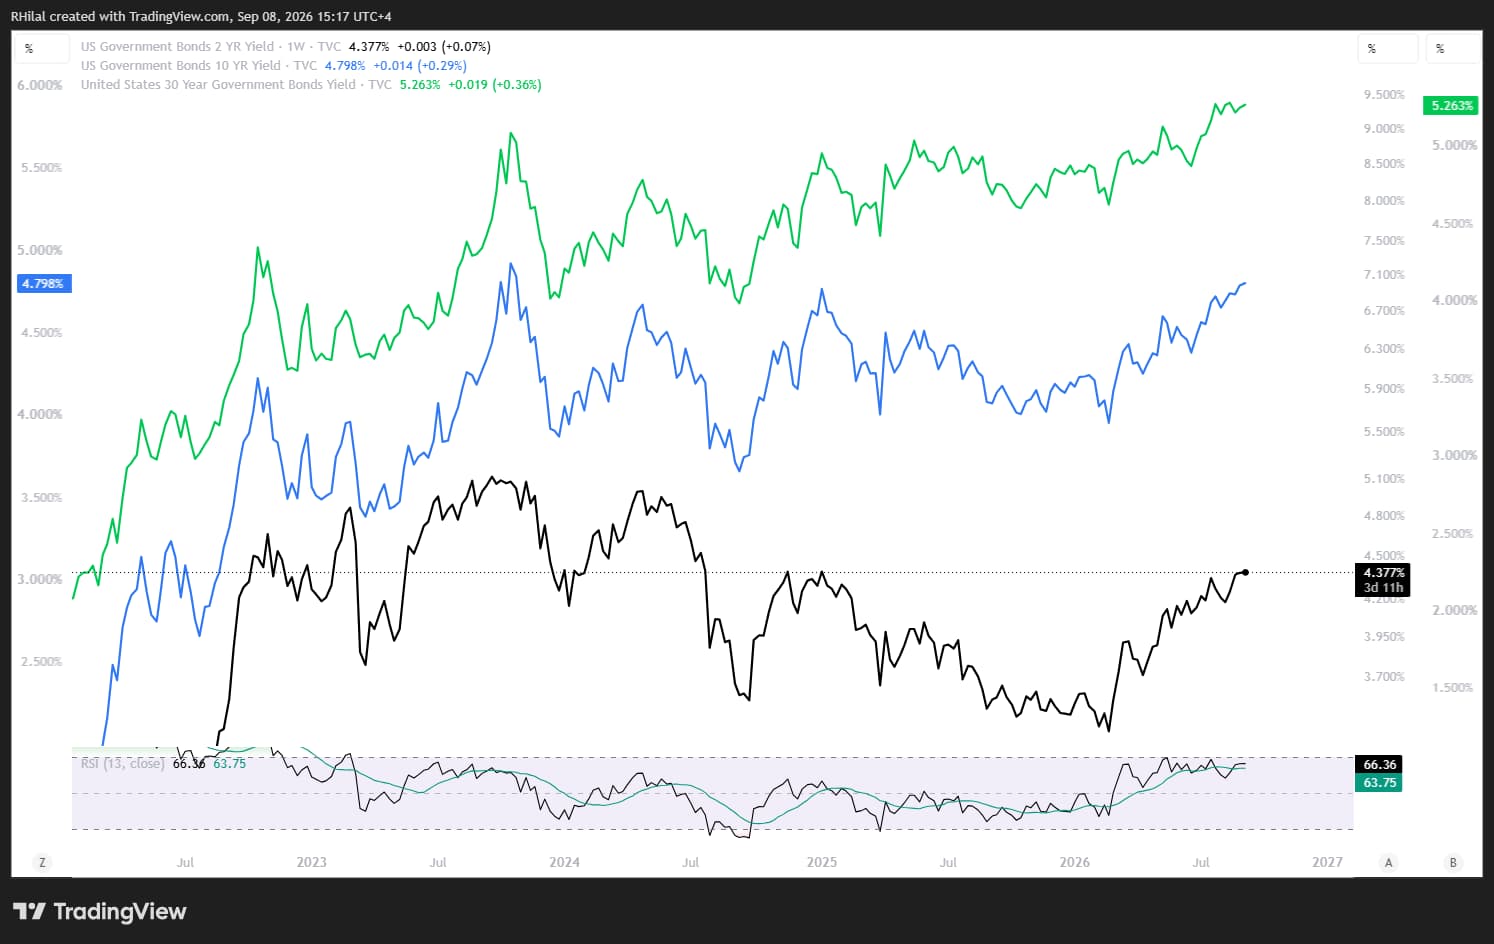
- U.S. 2-year, 10-year and 30-year Treasury yields are trading close to their yearly highs.
- Bitcoin is holding its recent gains below resistance that has been in place since May 2026.
- The Dow is testing support that has held for more than four months, dating back to the April 2026 lows.
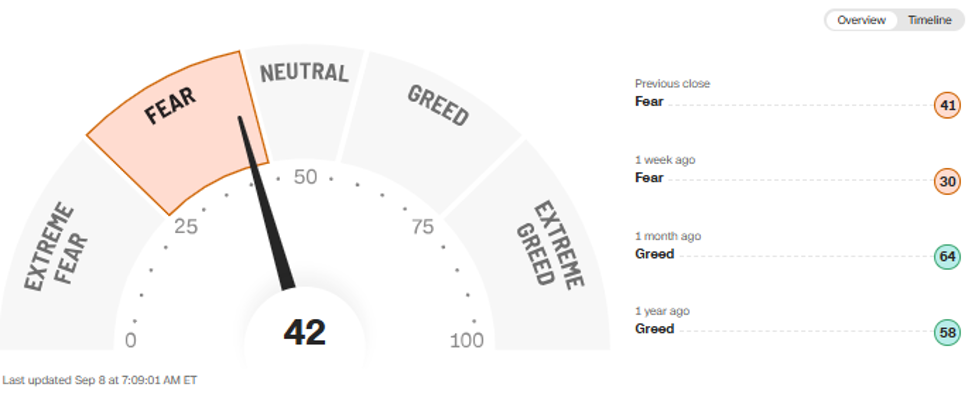
- The CNN Fear & Greed Index is leaning toward fear as investors await this week’s U.S. CPI report and next week’s central-bank policy decisions.
U.S. Treasury Yields Point Higher
Source: TradingView
As crude oil prices move closer to the $100 mark, concerns over higher energy costs and renewed inflationary pressure are returning to the market.
According to the Food and Agriculture Organization of the United Nations, the global food price index rose in August to its highest level since late 2022. This adds to inflation and interest-rate concerns ahead of Friday’s U.S. CPI report and next week’s FOMC meeting.
The combination of rising crude oil prices, elevated Treasury yields and persistent geopolitical uncertainty could continue to pressure risk assets, including Bitcoin and equities.
CNN Fear & Greed Index
Source: TradingView
This risk-off sentiment is limiting recent gains across precious metals, currencies and Bitcoin, increasing the risk of another short-term decline in equity indices, including the Dow. This expected to persist until firm deals concerning the strait of Hormuz, US, and Iran develop. increasing the risk of another short-term decline in equity indices, including the Dow.
Bitcoin Price Outlook: Weekly Time Frame — Log Scale
Source: TradingView
From a weekly perspective, Bitcoin’s latest gains appear to be losing momentum below the $84,000 level. This area corresponds to the May 2026 high and the 38.2% Fibonacci retracement of the decline from October 2025 to June 2026.
Bullish scenario: A breakout above $84,000 would target the 50% and 61.8% Fibonacci retracement levels near $92,000 and $100,000, respectively. Such a move would reinforce a broader risk-on recovery in Bitcoin.
Bearish scenario: If risk-off sentiment and interest-rate hike concerns intensify, Bitcoin could face another pullback. A breakdown below $74,000 would target $65,000.
The $65,000 area could become important for potential dip-buying opportunities. However, a sustained move below this level would increase the risk of further bearish confirmation and a return toward the yearly lows.
Dow Jones Price Outlook: Daily Time Frame — Log Scale
Source: TradingView
From a daily perspective, the Dow Jones is attempting to retest its uptrending support line, which has been in place since the April 2026 lows.
The index is also trading above the 38.2% Fibonacci retracement of the May–August advance.
Bearish scenario: A breakdown below 52,600 would target the 50%, 61.8% and 78.6% Fibonacci retracement levels near 52,200, 51,900 and 51,200, respectively.
A sustained move below these levels would increase the risk of a broader bearish outlook for the year.
Bullish scenario: Holding above 52,900 and reclaiming 54,000 would support the continuation of the bullish bias. This could open the way toward the yearly high near 54,800.
A move above that level would reinforce the uptrend and expose the trendline connecting the higher highs since April 2026, near 57,000.
Conclusion
From both a fundamental and price-action perspective, risk sentiment is leaning from neutral to bearish as long as crude oil prices remain above the $88 mark and U.S. Treasury yields continue to move higher.
The key near-term catalysts are Friday’s U.S. CPI report and next week’s central-bank policy decisions. A softer inflation reading and a decline in Treasury yields could support Bitcoin and equities.
In contrast, stronger inflation data, further increases in oil prices or a more hawkish central-bank outlook could extend the current risk-off pressure.
Written by Razan Hilal, CMT
Follow on X: @Rh_waves
Latest market news




Open an account in minutes
Experience award-winning platforms with fast and secure execution, and enjoy tight spreads from 0.5 pts on FX and 0.3 pts on indices.
Economic calendar
Web Trader platform
Our sophisticated web-based platform is packed with features.
Related articles
British Pound Technical Outlook: GBP/USD Bulls Fight to Stabilize at Critical Support 10 13 2026
GBP/USD is compressing into a tight near-term range just above key support, with a breakout likely to provide the next directional cue.


GBP/AUD falling wedge points to bullish breakout risk ahead of RBA minutes
GBP/AUD is forming a potential bullish continuation pattern, with RBA minutes, Australian unemployment and Bank of England commentary among the catalysts that could spark a breakout.


EUR/USD Forecast: Euro Slips to 17-Month Lows, 1.11 Next?
EUR/USD is trading at 17-month lows near 1.1160 as political developments in Germany and Spain inject uncertainty into the euro’s outlook - where is the next support ahead of US CPI?

This report is intended for general circulation only. It should not be construed as a recommendation, or an offer (or solicitation of an offer) to buy or sell any financial products. The information provided does not take into account your specific investment objectives, financial situation or particular needs. Before you act on any recommendation that may be contained in this report, independent advice ought to be sought from a financial adviser regarding the suitability of the investment product, taking into account your specific investment objectives, financial situation or particular needs.
StoneX Financial Pte. Ltd., may distribute reports produced by its respective foreign entities or affiliates within the StoneX group of companies or third parties pursuant to an arrangement under Regulation 32C of the Financial Advisers Regulations. Where the report is distributed to a person in Singapore who is not an accredited investor, expert investor or an institutional investor (as defined in the Securities Futures Act), StoneX Financial Pte. Ltd. accepts legal responsibility to such persons for the contents of the report only to the extent required by law. Singapore recipients should contact StoneX Financial Pte. Ltd. at 6826 9988 for matters arising from, or in connection with the report.
In the case of all other recipients of this report, to the extent permitted by applicable laws and regulations neither StoneX Financial Pte. Ltd. nor its associated companies will be responsible or liable for any loss or damage incurred arising out of, or in connection with, any use of the information contained in this report and all such liability is hereby expressly disclaimed. No representation or warranty is made, express or implied, that the content of this report is complete or accurate.
StoneX Financial Pte. Ltd. is not under any obligation to update this report.
Trading CFDs carries a high level of risk that may not be suitable for some investors. Consider your investment objectives, level of experience, financial resources, risk appetite and other relevant circumstances carefully. The possibility exists that you could lose some or all of your investments, including your initial deposits. If in doubt, please seek independent expert advice. Visit www.forex.com/en-sg/terms-and-policies for the complete Risk Disclosure Statement.