



Bitcoin, Gold Price Outlook: Markets Trade the Pause in Escalation
Bitcoin, Gold price outlook: Markets are trading the pause in escalation following the two-week ceasefire agreement between the US, Israel, and Iran. While gold is testing the 4800 resistance, Bitcoin remains capped below 75,000, keeping the broader market outlook cautious.
Share this:

Markets are pricing in a temporary easing in geopolitical risk following the ceasefire agreement. While gold is consolidating near the 4800 resistance level, Bitcoin continues to trade below the 75,000 threshold, reflecting hesitation in confirming a broader risk-on environment.
Part of the geopolitical risk premium is being unwound across markets. Crude oil has dropped over 17% this week toward the $90 zone, Dubai’s Financial Market index saw a sharp move at the open, with gains briefly reaching around 10%, while global equities have advanced over 3%, and the US dollar has weakened by more than 1%.
This repricing is largely driven by the reopening of the Strait of Hormuz, easing supply shock concerns across key sectors, particularly energy. This is helping to moderate global stagflation concerns and temper expectations of monetary tightening.
Caution Remains Warranted
However, the current market environment reflects a trade in the pause in escalation rather than a full resolution. Key risk assets are consolidating near important resistance levels following recent gains, while crude oil is holding near critical support. This keeps market navigation dependent on step-by-step confirmation, especially as oil prices remain elevated, up more than 50% year-to-date.
Caution remains warranted ahead of upcoming catalysts, including US CPI data on Friday and the start of negotiations, where alignment in narratives and tangible progress will be critical.
Key Levels and Charts to Watch
- DXY: Downside risks below 98-97 | Upside risks above 100.60
- Crude Oil: Upside risks above 115 | Downside risks below 88–82
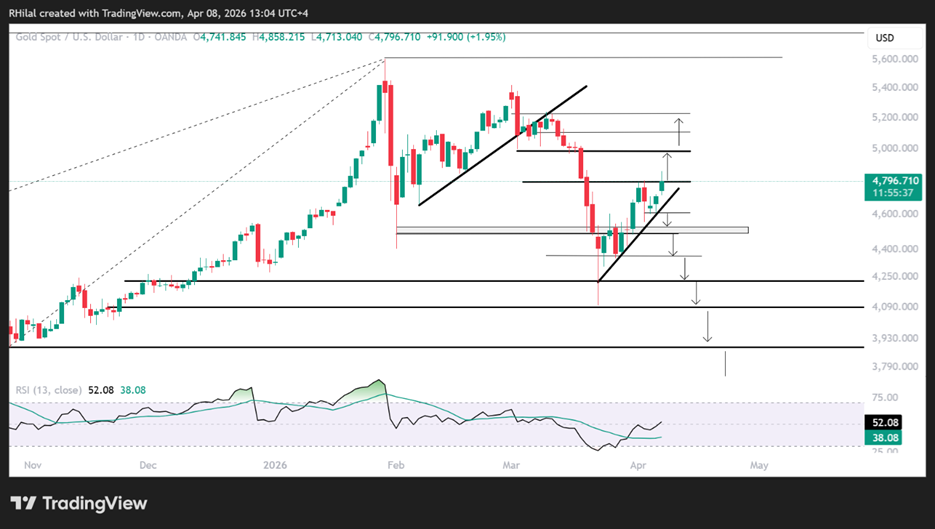
- Gold: Upside risks above 4850 | Downside risks below 4700 and 4600
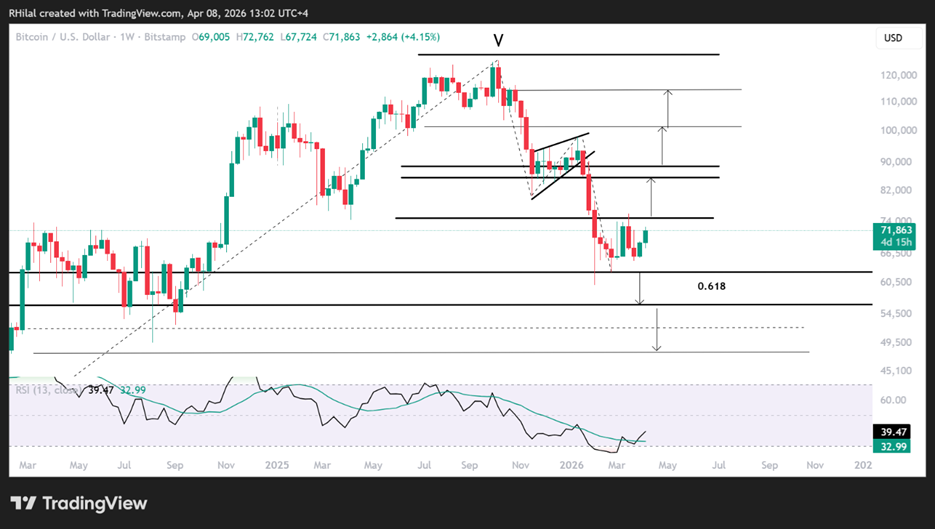
- Bitcoin: Upside risks above 75,000 | Downside risks below 60,000
Bitcoin Outlook: Weekly Time Frame – Log Scale
Source: Trading view
The Bitcoin chart highlights four key factors supporting a longer-term recovery, alongside one key risk that could drive another leg lower before a broader reversal.
Scenario for further upside
- Holding above the 60,000 psychological level and the 0.618 Fibonacci retracement of the 2022–2025 uptrend
- Trading near the 2021 highs, a former resistance zone now acting as support
- Approaching the projected target of the November 2025–January 2026 wedge pattern
- The weekly RSI is rebounding from oversold levels last seen in 2022
The outlook remains neutral for now, with a confirmed close above 75,000 needed to support a move toward 80,000–89,000 initially, followed by 100,000–115,000. A sustained extension could open the path toward the 130,000–200,000 range.
Scenario for further downside
As geopolitical uncertainty persists, a renewed risk-off move with a close below 60,000 could expose the 56,000 and 48,000 zones, which may serve as longer-term accumulation areas.
Gold Outlook: Daily Time Frame – Log Scale
Source: Trading view
On the daily chart, gold is forming a consolidation pattern with higher lows from the 4080 level and capped highs below the 4800 resistance. This structure resembles the setup observed after the February rebound into the March 2026 highs, leaving two paths in focus: a break below trendline support or a move above resistance.
Scenario for further upside
A close above the 4800–4850 zone could open the path toward 4980, where pullback risks may emerge. These levels align with the 0.618 and 0.786 Fibonacci retracement levels of the March 2026 decline.
A sustained move above 4980 would strengthen the broader outlook toward 5250, a key barrier before a potential extension toward the 5600–6000 range, or another phase of consolidation.
Scenario for further downside
A break below the rising trendline from the 4080 lows, along with a move below 4600 and 4480, could expose downside targets at 4300, 4180, and 4080. A deeper move may open the way toward 3600 and 3000 as longer-term accumulation zones, potentially aligning with a broader correction in silver toward the $50 area. Click here for my latest Silver analysis
With sentiment-driven headlines still dominating the outlook, sustained stability beyond long-term key levels remains essential to avoid bull and bear traps until a more definitive resolution to the conflict emerges.
Written by Razan Hilal, CMT
Follow on X: @Rh_waves
Latest market news




Open an account in minutes
Experience award-winning platforms with fast and secure execution, and enjoy tight spreads from 0.5 pts on FX and 0.3 pts on indices.
Economic calendar
Web Trader platform
Our sophisticated web-based platform is packed with features.
Related articles
Silver's bullish breakout case builds as bond yields retreat
The Democratic blue wave has sent crude and Treasury yields sharply lower, improving the outlook for precious metals. With gold already breaking higher, could silver be next?
Swiss Franc Short-term Outlook: USD/CHF Selloff Nears Critical Support Ahead of NFP 11 4 2026
USD/CHF bears are closing in on critical trend support, with the next reaction likely to determine whether the October decline has further to run.

US Midterm Fallout: What Does the “Blue Tsunami” Mean for the S&P 500?
Democrats made sweeping gains in the US midterm elections, winning control of both the House and Senate - what does it mean for the S&P 500 and the AI trade?

This report is intended for general circulation only. It should not be construed as a recommendation, or an offer (or solicitation of an offer) to buy or sell any financial products. The information provided does not take into account your specific investment objectives, financial situation or particular needs. Before you act on any recommendation that may be contained in this report, independent advice ought to be sought from a financial adviser regarding the suitability of the investment product, taking into account your specific investment objectives, financial situation or particular needs.
StoneX Financial Pte. Ltd., may distribute reports produced by its respective foreign entities or affiliates within the StoneX group of companies or third parties pursuant to an arrangement under Regulation 32C of the Financial Advisers Regulations. Where the report is distributed to a person in Singapore who is not an accredited investor, expert investor or an institutional investor (as defined in the Securities Futures Act), StoneX Financial Pte. Ltd. accepts legal responsibility to such persons for the contents of the report only to the extent required by law. Singapore recipients should contact StoneX Financial Pte. Ltd. at 6826 9988 for matters arising from, or in connection with the report.
In the case of all other recipients of this report, to the extent permitted by applicable laws and regulations neither StoneX Financial Pte. Ltd. nor its associated companies will be responsible or liable for any loss or damage incurred arising out of, or in connection with, any use of the information contained in this report and all such liability is hereby expressly disclaimed. No representation or warranty is made, express or implied, that the content of this report is complete or accurate.
StoneX Financial Pte. Ltd. is not under any obligation to update this report.
Trading CFDs carries a high level of risk that may not be suitable for some investors. Consider your investment objectives, level of experience, financial resources, risk appetite and other relevant circumstances carefully. The possibility exists that you could lose some or all of your investments, including your initial deposits. If in doubt, please seek independent expert advice. Visit www.forex.com/en-sg/terms-and-policies for the complete Risk Disclosure Statement.