



Bond yields and crude call the shots for ASX 200
The ASX 200 has rallied on 93% of occasions this year when Australian three-year bond yields have fallen at least five basis points. With crude prices also plunging, the latest breakout has history on its side.
Share this:

- Dovish RBA hike and crude slump fuel ASX 200 rally
- Large yield declines preceded gains 27/29 times
- Sector correlations reveal major differences in sensitivity
- ASX 200 breakout puts August record highs in focus
Our ASX 200 contract has surged to fresh multi-month highs, aided by a combination of technical factors and strengthening macro tailwinds, including sharply lower energy prices and the RBA's dovish rate hike last Tuesday.
The outsized reaction and relative outperformance compared to other benchmark indices across the developed world reinforces earlier research showing that Australian equities have become far more sensitive to shifts in the RBA interest rate outlook, with valuation multiple expansion and contraction playing a significant role given expectations for only modest earnings growth.
A dovish hike changes the rates outlook
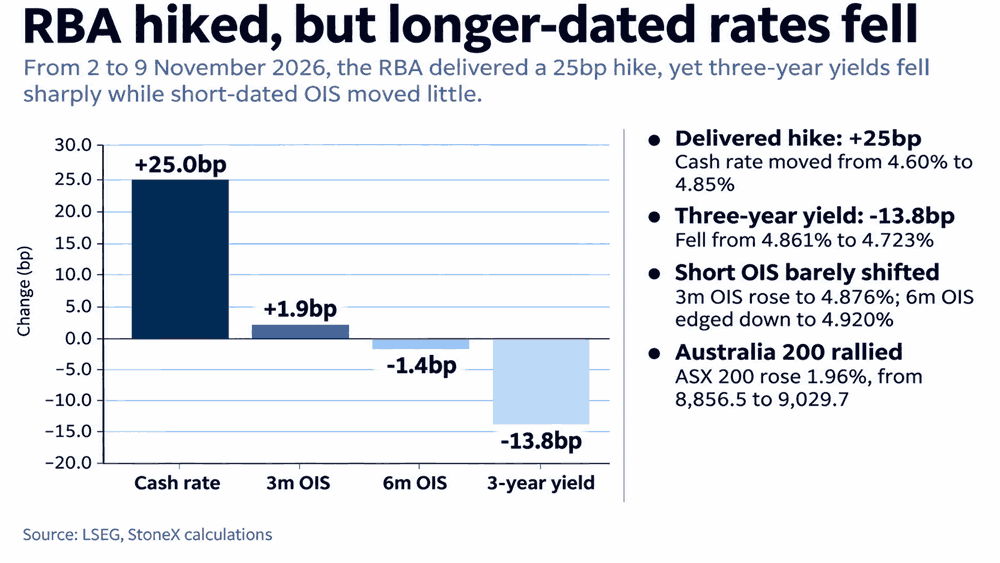
Last Tuesday, the RBA delivered an unequivocally dovish hike. Despite lifting the cash rate to a multi-decade high of 4.85%, not only was the decision split 6–3, with three external board members reportedly preferring to leave rates unchanged, but the accompanying statement also dropped earlier guidance warning that further tightening may be required.
The shift in guidance came despite persistent overshoots in the RBA's underlying inflation forecasts, suggesting signs of deterioration in the labour market and accelerating house price declines are starting to feature more prominently in board deliberations.
Source: LSEG
Australian STIR traders are now pricing very little additional tightening this cycle. Six-month overnight index swaps closed at 4.92% on Monday, just seven basis points above the current cash rate, while the probability of a December hike has collapsed to zero. A 25-basis-point hike at the bank's February meeting is now priced at less than 20%.
The shift at the front end of the Australian curve has been replicated further out, with three-year government bond yields slumping 13.8 basis points since immediately before the decision. The move has been helped not only by the RBA's dovish hike but also by a substantial unwind in crude oil futures, reducing the threat of energy-led inflationary pressures broadening into other parts of the Australian economy.
Falling yields and crude fuel gains
Macro factors have become far more influential for Australian equities this year, with the ASX 200 absolutely lapping up the RBA's dovish deviation. The reaction reinforces previous research showing the macro outlook is playing a far greater role in day-to-day shifts in the index relative to other historical drivers such as earnings.
Source: LSEG
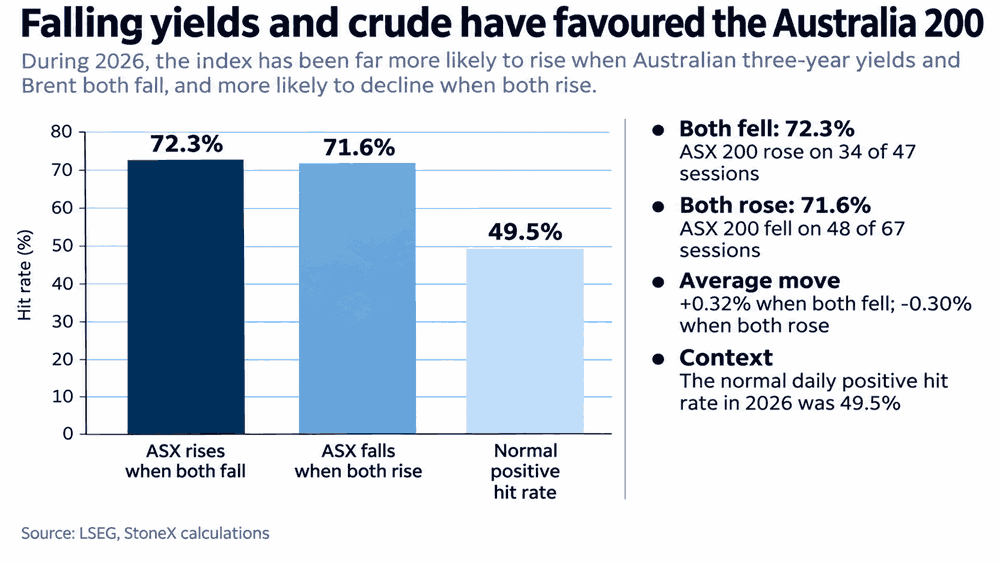
Historical analysis reveals the index has advanced on 34 of 47 sessions (72.3%) when Australian three-year government bond yields and Brent crude have both declined. At the same time, when both have increased, the index has fallen on 48 of 67 occasions (71.6%). Contrast that with the index's overall positive daily hit rate of just 49.5% this year.
Average returns also reflect the divergence, with the index gaining 0.32% when both yields and crude declined, compared with an average loss of 0.30% when both rose. Notably, these relationships have strengthened considerably, suggesting changes in interest rate expectations and energy markets have become far more influential for Australian equities in 2026.
Bonds and crude divide the ASX
It's not just at the index level where interest rates and energy prices have exerted a strong influence, with relationships across some individual sectors proving extremely strong over periods this year.
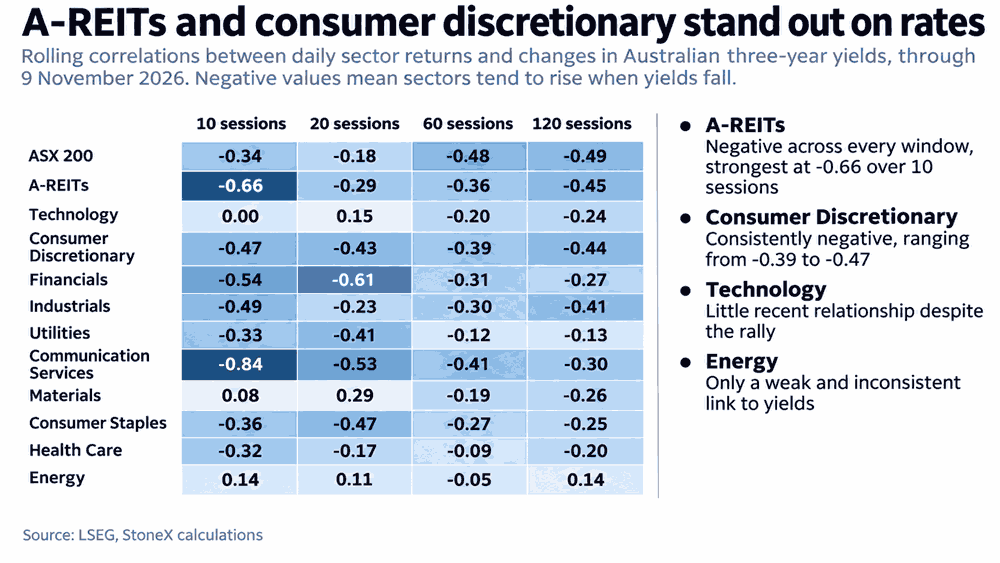
Over the past 20 sessions, financials recorded a correlation of -0.61 with changes in Australian three-year government bond yields, followed by communication services at -0.53 and consumer discretionary at -0.43. The broader ASX 200's correlation was just -0.18 over the same period, although the relationship has been far stronger over longer windows, sitting at around -0.50 across both 60 and 120 sessions.
Source: LSEG
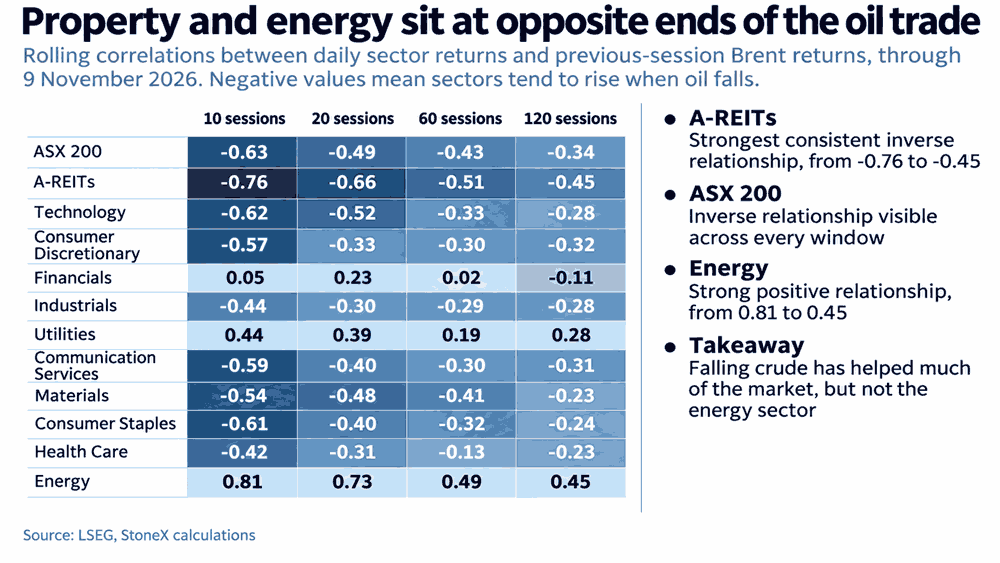
Interestingly, the relationship with crude is even more apparent, with the ASX 200 recording a correlation of -0.49 with Brent crude futures over the past 20 sessions. Unsurprisingly, energy has been tied at the hip with movements in crude futures, recording a positive correlation of +0.73, strengthening to +0.81 over the shorter ten-session window.
Source: LSEG
The underlying message suggests that declining yields and crude prices have provided a broad tailwind for Australian equities, even if the benefits haven't been evenly distributed.
The extraordinary 93% winning record
The relationships become even stronger when yields or crude record substantial declines, as we've witnessed over the past week.
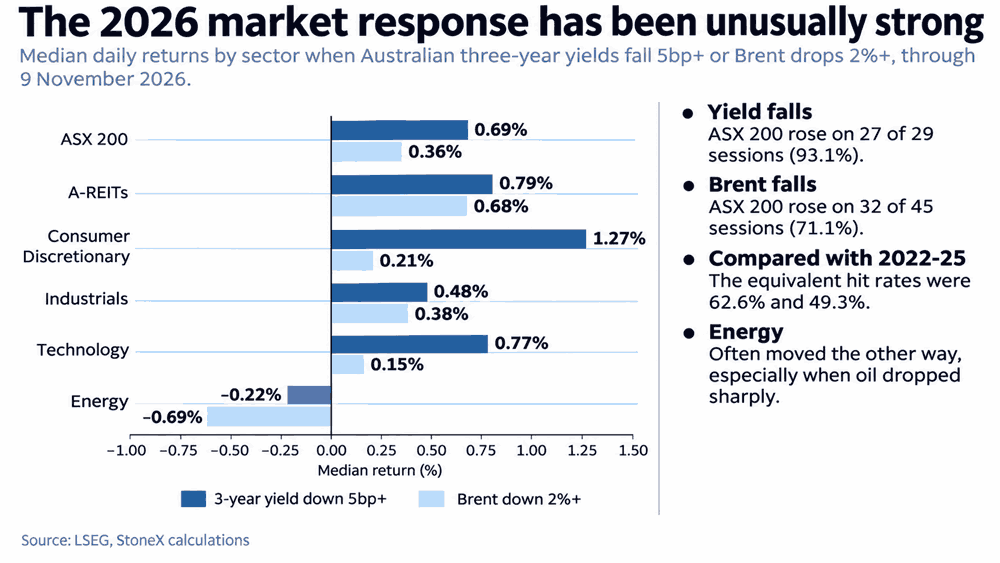
So far in 2026, the ASX 200 has advanced on a remarkable 27 of 29 sessions (93.1%) when Australian three-year government bond yields have fallen by at least five basis points, delivering a median gain of 0.69%. That winning ratio is substantially higher than the 62.6% recorded between 2022 and 2025.
The results are similar, albeit less pronounced, following larger declines in crude. When Brent has fallen by at least 2% in the preceding session, the ASX 200 has risen on 32 of 45 occasions (71.1%), with a median gain of 0.36%. Again, that's substantially higher than the 49.3% hit rate recorded between 2022 and 2025.
Source: LSEG
The response across individual sectors has been far more dispersed in nature. When three-year yields have declined by at least five basis points, consumer discretionary has delivered a median gain of 1.27%, compared with 0.79% for A-REITs and a median decline of 0.22% for energy. Following a Brent decline of at least 2%, A-REITs have gained a median 0.68%, while energy has lost 0.69%.
When both conditions have been met this year, the ASX 200 has advanced on all 11 occasions. While that may appear to offer a trading signal, the sample size is far too small to draw firm conclusions from, making it noteworthy rather than something to act upon.
Breakout puts record highs in sight
Source: TradingView
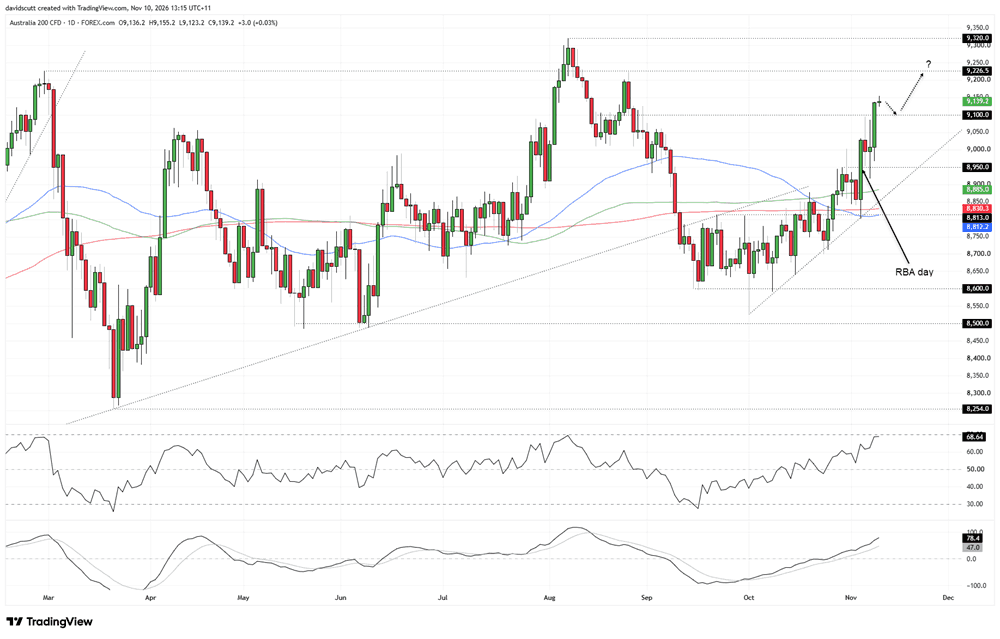
Having traded within an ascending triangle structure for the better part of two months heading into November, our ASX 200 contract broke above the upper boundary, marked by the 100-day moving average (shown in green).
The RBA's dovish hike subsequently helped the price break through resistance at 8,950. After that level was tested from above and held, with bulls moving in, a further leg higher has taken the price back above 9,100, a level that acted as both support and resistance during August.
With 9,100 now the immediate focal point underneath, attention turns to 9,226.5 overhead, marking the former record high set in February, which also acted as resistance when tested in late August.
RSI (14) continues to trend higher and sits just beneath overbought territory, pointing to building upside momentum and favouring long setups over shorts. MACD reinforces that message, having already staged a bullish crossover and now diverging further from the signal line in positive territory.
It's been a strong breakout, aided by strengthening macro tailwinds, with technicals doing the rest. Given how far the price has already run, the preference would be to wait for a backtest and bounce from 9,100 before establishing longs, allowing for a tight stop beneath that level for protection. Initial upside targets would be 9,226.5, followed by the record high around 9,320 set in early August. Beyond that, potential targets would need to be assessed based on the price action heading into those levels.
Of course, if the price were to break and hold beneath 9,100, that would bring 8,950 back into play, followed by the 100-day moving average and uptrend support running from the lows set in early October.

Open an account in minutes
Experience award-winning platforms with fast and secure execution, and enjoy tight spreads from 0.5 pts on FX and 0.3 pts on indices.
Economic calendar
Web Trader platform
Our sophisticated web-based platform is packed with features.
Related articles

Bond yields and crude call the shots for ASX 200
The ASX 200 has rallied on 93% of occasions this year when Australian three-year bond yields have fallen at least five basis points. With crude prices also plunging, the latest breakout has history on its side.

Gold coils for potential breakout as US CPI looms
Gold's ascending triangle is putting $4,140 firmly in focus ahead of US CPI. With traditional macro relationships offering few clues, the price action may prove more useful for traders.

USD/CAD Outlook: Loonie left behind as US CPI looms
USD/CAD's sharp rebound has coincided with widening US–Canada interest rate differentials. With US CPI approaching and bullish momentum building, another breakout may be on the cards.
This report is intended for general circulation only. It should not be construed as a recommendation, or an offer (or solicitation of an offer) to buy or sell any financial products. The information provided does not take into account your specific investment objectives, financial situation or particular needs. Before you act on any recommendation that may be contained in this report, independent advice ought to be sought from a financial adviser regarding the suitability of the investment product, taking into account your specific investment objectives, financial situation or particular needs.
StoneX Financial Pte. Ltd., may distribute reports produced by its respective foreign entities or affiliates within the StoneX group of companies or third parties pursuant to an arrangement under Regulation 32C of the Financial Advisers Regulations. Where the report is distributed to a person in Singapore who is not an accredited investor, expert investor or an institutional investor (as defined in the Securities Futures Act), StoneX Financial Pte. Ltd. accepts legal responsibility to such persons for the contents of the report only to the extent required by law. Singapore recipients should contact StoneX Financial Pte. Ltd. at 6826 9988 for matters arising from, or in connection with the report.
In the case of all other recipients of this report, to the extent permitted by applicable laws and regulations neither StoneX Financial Pte. Ltd. nor its associated companies will be responsible or liable for any loss or damage incurred arising out of, or in connection with, any use of the information contained in this report and all such liability is hereby expressly disclaimed. No representation or warranty is made, express or implied, that the content of this report is complete or accurate.
StoneX Financial Pte. Ltd. is not under any obligation to update this report.
Trading CFDs carries a high level of risk that may not be suitable for some investors. Consider your investment objectives, level of experience, financial resources, risk appetite and other relevant circumstances carefully. The possibility exists that you could lose some or all of your investments, including your initial deposits. If in doubt, please seek independent expert advice. Visit www.forex.com/en-sg/terms-and-policies for the complete Risk Disclosure Statement.