




Brexit Headlines Leading to GBP Volatility EURGBP GBPUSD GBPNZD
Headlines will push the Pound around over the next few days.
Share this:

Over the weekend, it sounded as if a Brexit trade deal was at hand. However, Monday morning there were plenty of headlines that a deal was not done, particularly regarding fisheries. UK PM Johnson and EC President van der Leyen spoke earlier, however it doesn’t seem that much has changed. Thursday is the beginning of the EU Summit. Will a trade deal be reached by then? No one knows for sure, but there will be plenty of headlines to keep traders on their toes. EUR/GBP should give the best clues as far as how discussions are going, however other GBP pairs should be watched as well.
GBP/USD
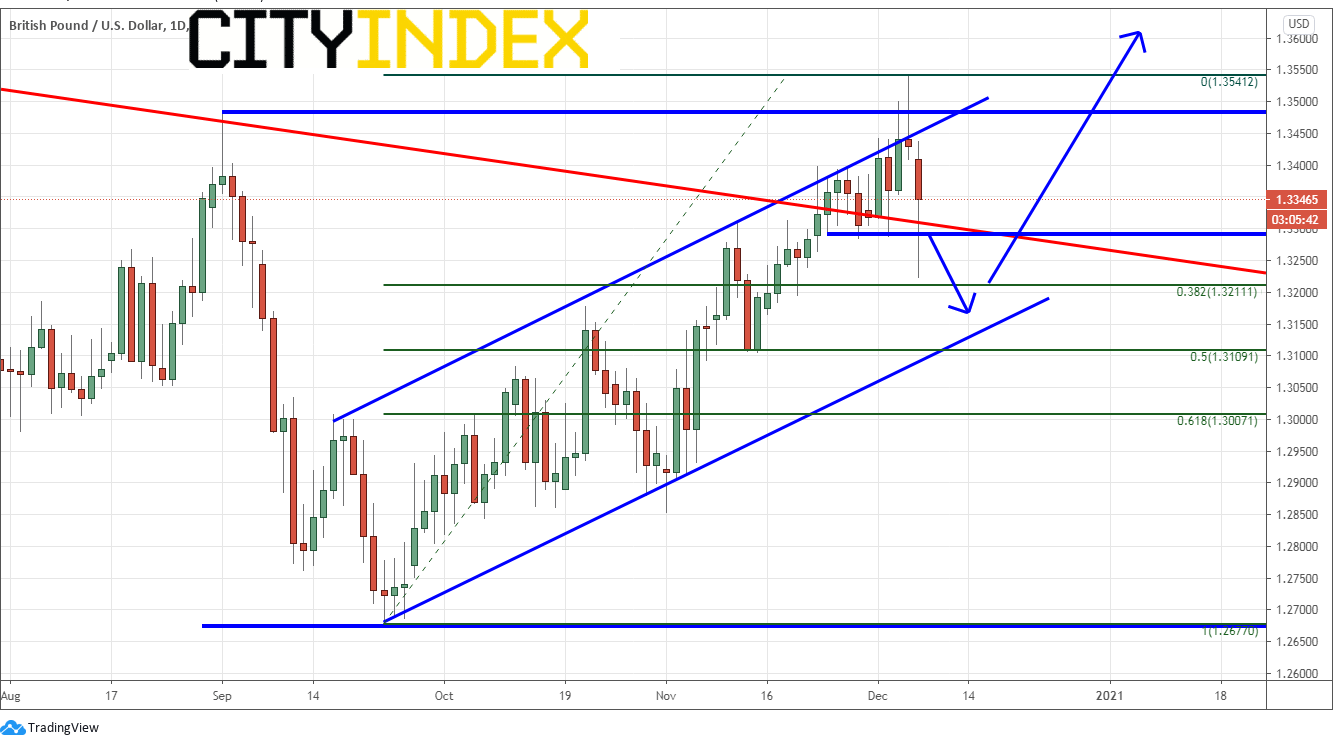
On Friday, GBP/USD formed a shooting star on a daily timeframe. With today’s price action, the candlestick formation pattern over the last 3 days is known as an evening star formation, which is considered a reversal pattern. On both Thursday and Friday last week, price tried to break above the September 1st highs at 1.3483, however failed to close above it. Today, GBP/USD is selling off, however the pair is holding above a 13 year downward sloping trendline from 2007 (red line), previous lows beginning November 25th, and the 38.2% Fibonacci retracement level from the lows of September 23rd to Friday’s highs near 1.3211. This is the first level of support. GBP/USD has also been in an upward sloping channel since the September 23rd lows, and the bottom trendline is the next level of support, near 1.3110, which is also the 50% retracement from that same timeframe. The 61.8% Fibonacci retracement, and third support level sits 100 pips lower near 1.3007. Buyers will be looking for the evening star formation to push prices down to these levels to leg into long positions and look for a move above 1.3541 (on a Brexit trade deal). Sellers will be looking for a retest of Friday’s highs to enter short positions.
Source: Tradingview, City Index
GBP/NZD
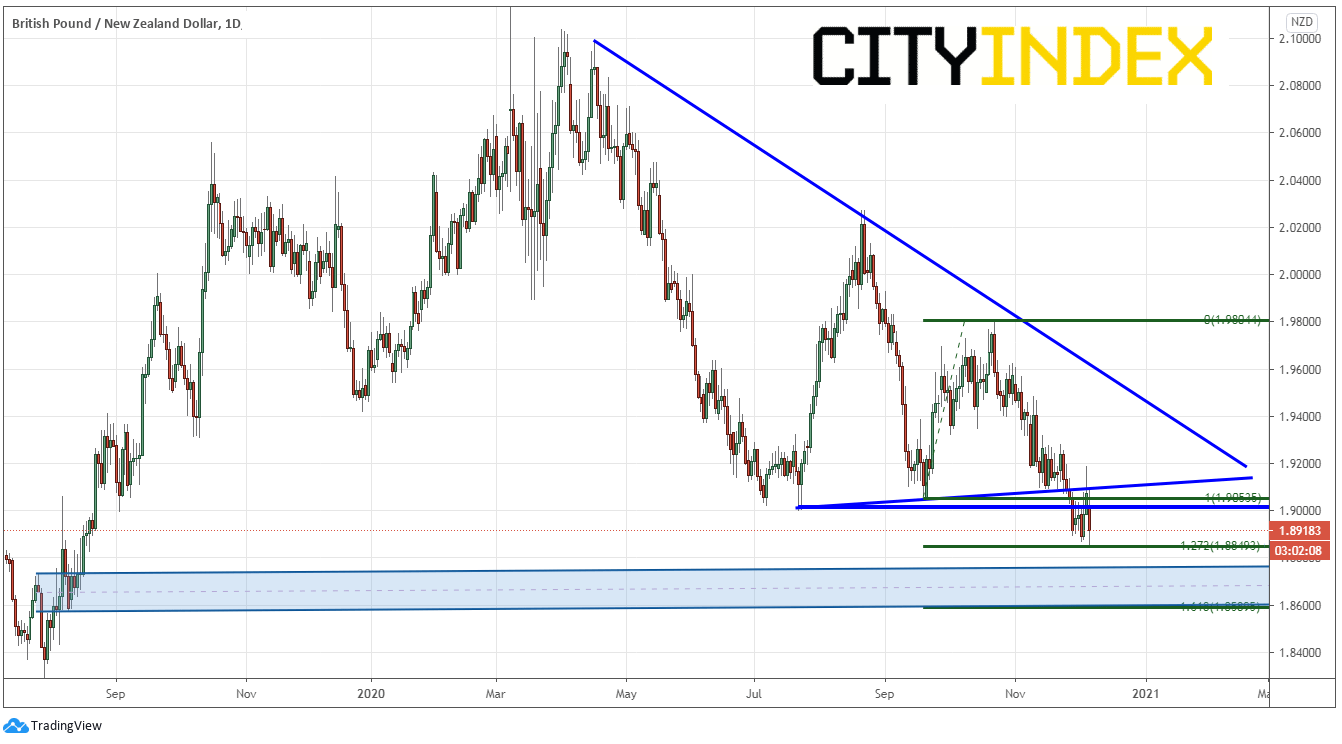
In addition to the GBP volatility, the US Dollar has been selling off. This is giving a lift to commodity currencies such as the Aussie and Kiwi. This price action has been reflected in GBP/NZD through a move lower today. The pair has been moving lower since putting in highs on March 6th near 2.1750. The pair broke below a rising trending and horizontal support just above 1.9000 on November 27th. Today, price is testing the lows of December 2nd and 3rd, as well as the 127.2% Fibonacci extension from the September 21st lows to the October 22nd highs near 1.8850. There is a band of resistance there between 1.8600 and 1.8720. The 161.8% Fibonacci extension level arrives at the bottom end of the band near 1.8600. Sellers will be looking for bounces back to 1.9000 and Friday’s highs of 1.9188 to enter shorts. Watch for similar price action in GBP/AUD.
Source: Tradingview, City Index
Although a trade deal for Brexit has yet to be agreed, there are plenty of headlines, both positive and negative, which will be pushing the Pound around over the next few days.
Over the weekend, it sounded as if a Brexit trade deal was at hand. However, Monday morning there were plenty of headlines that a deal was not done, particularly regarding fisheries. UK PM Johnson and EC President van der Leyen spoke earlier, however it doesn’t seem that much has changed. Thursday is the beginning of the EU Summit. Will a trade deal be reached by then? No one knows for sure, but there will be plenty of headlines to keep traders on their toes. EUR/GBP should give the best clues as far as how discussions are going, however other GBP pairs should be watched as well.
GBP/USD
On Friday, GBP/USD formed a shooting star on a daily timeframe. With today’s price action, the candlestick formation pattern over the last 3 days is known as an evening star formation, which is considered a reversal pattern. On both Thursday and Friday last week, price tried to break above the September 1st highs at 1.3483, however failed to close above it. Today, GBP/USD is selling off, however the pair is holding above a 13 year downward sloping trendline from 2007 (red line), previous lows beginning November 25th, and the 38.2% Fibonacci retracement level from the lows of September 23rd to Friday’s highs near 1.3211. This is the first level of support. GBP/USD has also been in an upward sloping channel since the September 23rd lows, and the bottom trendline is the next level of support, near 1.3110, which is also the 50% retracement from that same timeframe. The 61.8% Fibonacci retracement, and third support level sits 100 pips lower near 1.3007. Buyers will be looking for the evening star formation to push prices down to these levels to leg into long positions and look for a move above 1.3541 (on a Brexit trade deal). Sellers will be looking for a retest of Friday’s highs to enter short positions.
Source: Tradingview, FOREX.com
GBP/NZD
In addition to the GBP volatility, the US Dollar has been selling off. This is giving a lift to commodity currencies such as the Aussie and Kiwi. This price action has been reflected in GBP/NZD through a move lower today. The pair has been moving lower since putting in highs on March 6th near 2.1750. The pair broke below a rising trending and horizontal support just above 1.9000 on November 27th. Today, price is testing the lows of December 2nd and 3rd, as well as the 127.2% Fibonacci extension from the September 21st lows to the October 22nd highs near 1.8850. There is a band of resistance there between 1.8600 and 1.8720. The 161.8% Fibonacci extension level arrives at the bottom end of the band near 1.8600. Sellers will be looking for bounces back to 1.9000 and Friday’s highs of 1.9188 to enter shorts. Watch for similar price action in GBP/AUD.
Source: Tradingview, FOREX.com
Although a trade deal for Brexit has yet to be agreed, there are plenty of headlines, both positive and negative, which will be pushing the Pound around over the next few days.
Latest market news




Open an account in minutes
Experience award-winning platforms with fast and secure execution, and enjoy tight spreads from 0.5 pts on FX and 0.3 pts on indices.
Economic calendar
Web Trader platform
Our sophisticated web-based platform is packed with features.
Related articles
GBP/USD, GBP/AUD: Sterling Rally Faces a BoE Reality Check
Sterling faces a reality check as the BoE prepares to hike rates. GBP/USD and GBP/AUD approach resistance, leaving bulls vulnerable to dovish guidance.

Swiss Franc Short-term Outlook: USD/CHF Selloff Nears Critical Support Ahead of NFP 11 4 2026
USD/CHF bears are closing in on critical trend support, with the next reaction likely to determine whether the October decline has further to run.


USD/CAD Forecast: Canadian Dollar Gains Ground After U.S. Midterm Elections
The trading week continues to unfold and the recovery in the Canadian dollar has once again become a relevant theme in the short term. This can be clearly seen in the recent performance of USD/CAD, which is down nearly 0.4% during the session, reflecting a consistent recovery in the CAD against the U.S. dollar.

This report is intended for general circulation only. It should not be construed as a recommendation, or an offer (or solicitation of an offer) to buy or sell any financial products. The information provided does not take into account your specific investment objectives, financial situation or particular needs. Before you act on any recommendation that may be contained in this report, independent advice ought to be sought from a financial adviser regarding the suitability of the investment product, taking into account your specific investment objectives, financial situation or particular needs.
StoneX Financial Pte. Ltd., may distribute reports produced by its respective foreign entities or affiliates within the StoneX group of companies or third parties pursuant to an arrangement under Regulation 32C of the Financial Advisers Regulations. Where the report is distributed to a person in Singapore who is not an accredited investor, expert investor or an institutional investor (as defined in the Securities Futures Act), StoneX Financial Pte. Ltd. accepts legal responsibility to such persons for the contents of the report only to the extent required by law. Singapore recipients should contact StoneX Financial Pte. Ltd. at 6826 9988 for matters arising from, or in connection with the report.
In the case of all other recipients of this report, to the extent permitted by applicable laws and regulations neither StoneX Financial Pte. Ltd. nor its associated companies will be responsible or liable for any loss or damage incurred arising out of, or in connection with, any use of the information contained in this report and all such liability is hereby expressly disclaimed. No representation or warranty is made, express or implied, that the content of this report is complete or accurate.
StoneX Financial Pte. Ltd. is not under any obligation to update this report.
Trading CFDs carries a high level of risk that may not be suitable for some investors. Consider your investment objectives, level of experience, financial resources, risk appetite and other relevant circumstances carefully. The possibility exists that you could lose some or all of your investments, including your initial deposits. If in doubt, please seek independent expert advice. Visit www.forex.com/en-sg/terms-and-policies for the complete Risk Disclosure Statement.