



Comments from NATO meeting send Gold and USD/PLN higher
Investors who were unease about the ongoing Russia/Ukraine conflict now have even more to worry about.
Share this:

Investors who were unease about the ongoing Russia/Ukraine conflict now have even more to worry about. US President Joe Biden traveled to Europe this week to meet with NATO allies and discuss the situation. After the meeting, headlines released said that NATO is preparing for the risk of Russian nuclear incidents. In addition, Biden told NATO that he supports increased NATO troops on the Eastern front. Oh, and did I mention that the G-7 plans on warning Russia over its use of chemical and nuclear weapons? These comments will only increase the tensions between Russia and the West, causing further uncertainties. As a result, funds are flowing into the safe-haven asset of Gold.
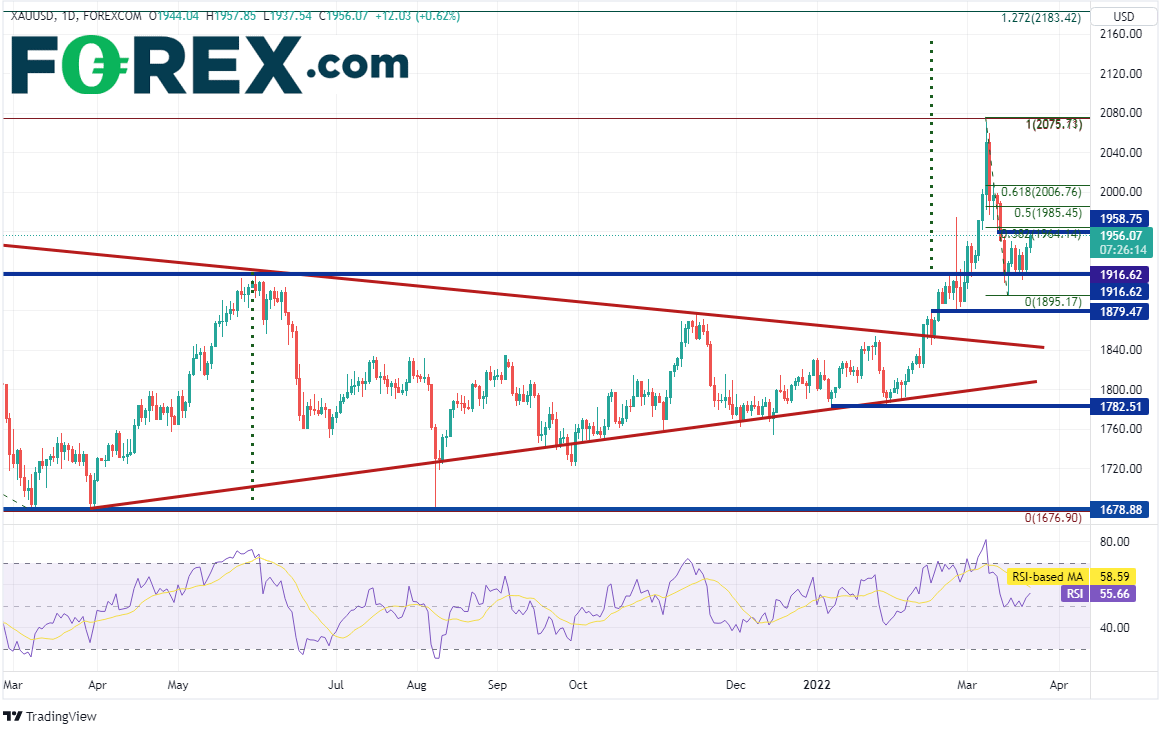
Gold had been in a symmetrical triangle since April 1st, 2021 before finally breaking above the top trendline of the pattern on February 11th near 1850. In addition, Gold had formed a double bottom in mid-2021 and broke above the neckline of the pattern on the day Russian invaded Ukraine, February 24th, near 1916. The target for the double bottom is near 2150.
Source: Tradingview, Stone X
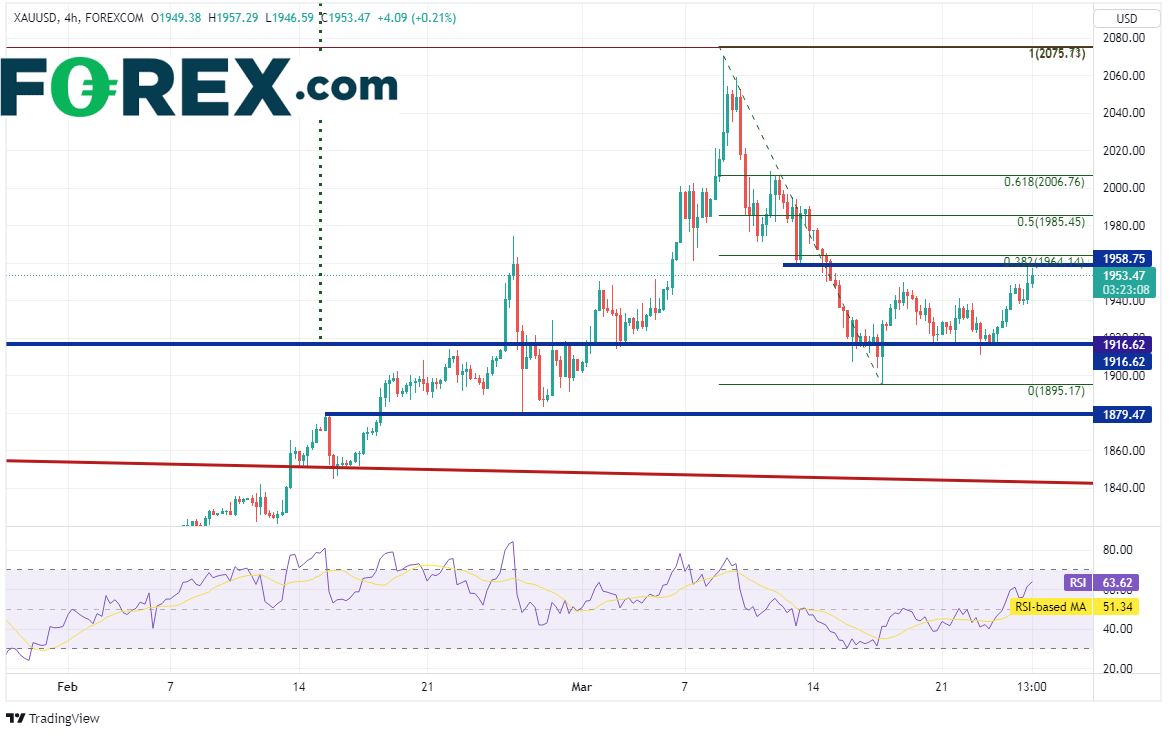
XAU/USD moved to a recent high of 2070.46 on March 8th, testing the all-time highs at 2075.11 from the summer of 2020. Since then, price pulled back and held support at the breakout of the double bottom pattern. On today’s headlines from NATO, price bounced into resistance near the low from March 11th at 1958.75. This is also near the double 38.2% Fibonacci retracement from the highs of March 8th to the lows of March 16th. Additional resistance is at the 50 % retracement and the 61.8% Fibonacci retracement from the same timeframe at 1985.45 and 2006.76, respectively. Support is at the March 16th lows near 1895.17, then horizontal support at 1879.47. If price breaks below there, the next level of support isn’t until the top, downward sloping trendline of the long-term triangle (see daily) near 1845.
Source: Tradingview, Stone X
USD/PLN has a strong positive correlation with Gold. The current correlation coefficient between Gold and USD/PLN is +0.81. Any reading above +0.80 is considered strong. Just as with Gold, USD/PLN began moving aggressively higher after Russia invaded Ukraine, above previous all-time highs at 4.3078 on March 2nd. The pair continued higher and made a new all-time high on March 7th at 4.6199. Since then, USD/PLN pulled back to horizontal support at 4.2042 and has been moving higher since.

Source: Tradingview, Stone X
On a 240-minute timeframe, the correlation coefficient is even higher than on the daily at +0.87, USD/PLN is currently sitting at trendline resistance near 4.3384. A move above targets Fibonacci retracement levels from the highs of March 7th to the recent lows on March 17th, starting with the 38.2% level at 4.3565. Above there is the 50% retracement level and horizontal resistance at 4.4068 and 4.4416, respectively. Support is at the recent lows of 4.204 and the 61.8% Fibonacci retracement from the February 10th lows to the March 7th highs at 4.1832 (see daily).

Source: Tradingview, Stone X
Investors who were unease about the ongoing Russia/Ukraine conflict now have even more to worry about. US President Joe Biden traveled to Europe this week to meet with NATO allies and discuss the situation. After the meeting, headlines released said that NATO is preparing for the risk of Russian nuclear incidents. In addition, Biden told NATO that he supports increased NATO troops on the Eastern front. Oh, and did I mention that the G-7 plans on warning Russia over its use of chemical and nuclear weapons? These comments will only increase the tensions between Russia and the West, causing further uncertainties. As a result, funds are flowing into the safe-haven asset of Gold.
Trade Gold (XAU/USD) now: Login or Open a new account!
• Open an account in the UK
• Open an account in Australia
• Open an account in Singapore
Gold had been in a symmetrical triangle since April 1st, 2021 before finally breaking above the top trendline of the pattern on February 11th near 1850. In addition, Gold had formed a double bottom in mid-2021 and broke above the neckline of the pattern on the day Russian invaded Ukraine, February 24th, near 1916. The target for the double bottom is near 2150.
Source: Tradingview, Stone X
XAU/USD moved to a recent high of 2070.46 on March 8th, testing the all-time highs at 2075.11 from the summer of 2020. Since then, price pulled back and held support at the breakout of the double bottom pattern. On today’s headlines from NATO, price bounced into resistance near the low from March 11th at 1958.75. This is also near the double 38.2% Fibonacci retracement from the highs of March 8th to the lows of March 16th. Additional resistance is at the 50 % retracement and the 61.8% Fibonacci retracement from the same timeframe at 1985.45 and 2006.76, respectively. Support is at the March 16th lows near 1895.17, then horizontal support at 1879.47. If price breaks below there, the next level of support isn’t until the top, downward sloping trendline of the long-term triangle (see daily) near 1845.

Source: Tradingview, Stone X
USD/PLN has a strong positive correlation with Gold. The current correlation coefficient between Gold and USD/PLN is +0.81. Any reading above +0.80 is considered strong. Just as with Gold, USD/PLN began moving aggressively higher after Russia invaded Ukraine, above previous all-time highs at 4.3078 on March 2nd. The pair continued higher and made a new all-time high on March 7th at 4.6199. Since then, USD/PLN pulled back to horizontal support at 4.2042 and has been moving higher since.

Source: Tradingview, Stone X
Trade USD/PLN now: Login or Open a new account!
• Open an account in the UK
• Open an account in Australia
• Open an account in Singapore
On a 240-minute timeframe, the correlation coefficient is even higher than on the daily at +0.87, USD/PLN is currently sitting at trendline resistance near 4.3384. A move above targets Fibonacci retracement levels from the highs of March 7th to the recent lows on March 17th, starting with the 38.2% level at 4.3565. Above there is the 50% retracement level and horizontal resistance at 4.4068 and 4.4416, respectively. Support is at the recent lows of 4.204 and the 61.8% Fibonacci retracement from the February 10th lows to the March 7th highs at 4.1832 (see daily).

Source: Tradingview, Stone X
Learn more about forex trading opportunities.
Related tags:
Latest market news




Open an account in minutes
Experience award-winning platforms with fast and secure execution, and enjoy tight spreads from 0.5 pts on FX and 0.3 pts on indices.
Economic calendar
Web Trader platform
Our sophisticated web-based platform is packed with features.
Related articles
Fed, DXY, EUR/USD, GBP/USD, USD/CAD, Gold Weekly Technical Outlook 10 26 2026
Sr. Technical Strategist Michael Boutros highlights the levels that matter on the USD Majors, commodities, and equity indices charts this week.
EUR/USD Update: Euro Weakness Returns Ahead of Central Bank Decisions
A new trading week is underway and the euro continues to show signs of weakness in the short term. This can be seen in the recent performance of EUR/USD, which has fallen nearly 0.5% over the last three trading sessions, reflecting a relatively consistent loss of momentum in the European currency.


US Dollar Bulls Hold Firm, but Euro Warns of Squeeze Risk | COT Report
US dollar bulls remain firmly positioned, but record euro shorts have failed to break EUR/USD support, raising the risk of a short-covering rally.

This report is intended for general circulation only. It should not be construed as a recommendation, or an offer (or solicitation of an offer) to buy or sell any financial products. The information provided does not take into account your specific investment objectives, financial situation or particular needs. Before you act on any recommendation that may be contained in this report, independent advice ought to be sought from a financial adviser regarding the suitability of the investment product, taking into account your specific investment objectives, financial situation or particular needs.
StoneX Financial Pte. Ltd., may distribute reports produced by its respective foreign entities or affiliates within the StoneX group of companies or third parties pursuant to an arrangement under Regulation 32C of the Financial Advisers Regulations. Where the report is distributed to a person in Singapore who is not an accredited investor, expert investor or an institutional investor (as defined in the Securities Futures Act), StoneX Financial Pte. Ltd. accepts legal responsibility to such persons for the contents of the report only to the extent required by law. Singapore recipients should contact StoneX Financial Pte. Ltd. at 6826 9988 for matters arising from, or in connection with the report.
In the case of all other recipients of this report, to the extent permitted by applicable laws and regulations neither StoneX Financial Pte. Ltd. nor its associated companies will be responsible or liable for any loss or damage incurred arising out of, or in connection with, any use of the information contained in this report and all such liability is hereby expressly disclaimed. No representation or warranty is made, express or implied, that the content of this report is complete or accurate.
StoneX Financial Pte. Ltd. is not under any obligation to update this report.
Trading CFDs carries a high level of risk that may not be suitable for some investors. Consider your investment objectives, level of experience, financial resources, risk appetite and other relevant circumstances carefully. The possibility exists that you could lose some or all of your investments, including your initial deposits. If in doubt, please seek independent expert advice. Visit www.forex.com/en-sg/terms-and-policies for the complete Risk Disclosure Statement.