




Crude Oil Challenges $65, Silver Climbs to 13-Year Highs Above $36/oz
Crude Oil, Silver Outlook: Crude Oil Challenges the $65 Resistance Amid Declining Supply on Summer Demand, Silver Climbs to 13-Year Highs Above $36/oz Ahead of London AI Summit.
Share this:

Key Events
- US-China Negotiations on Tariffs and Rare Earth Minerals
- Silver Surges to 13-Year Highs Above $36/oz
- Crude Oil Holds Below $65 as Inventories Drop by 4.3-Million Barrels to 2024 Lows
- US CPI Set to Be Overshadowed by Tariff Talks and Market Anticipation
With summer demand building and markets showing resilience amid ongoing US-China tariff negotiations, global indices are edging toward record highs. Crude oil remains capped below the $65 mark, while silver has surged to a 13-year high above $36 per ounce—driven by expectations of accelerating economic activity, continued recovery, and rapid technological advancement.
US-China trade negotiations on rare earths are set to take place alongside this week’s AI Innovation Conference in London—both events pivotal in shaping global demand outlooks for energy and technology sectors.
Meanwhile, US crude inventories have dropped by 4.3 million barrels to their lowest level since December 2024. This supports oil’s bullish tone, reinforced by OPEC’s cautious supply management and lingering geopolitical tensions involving Russia, Ukraine, and the Middle East.
Risks persist, particularly around the potential implementation of disruptive policies under Trump’s proposed economic agenda.
Technical Analysis
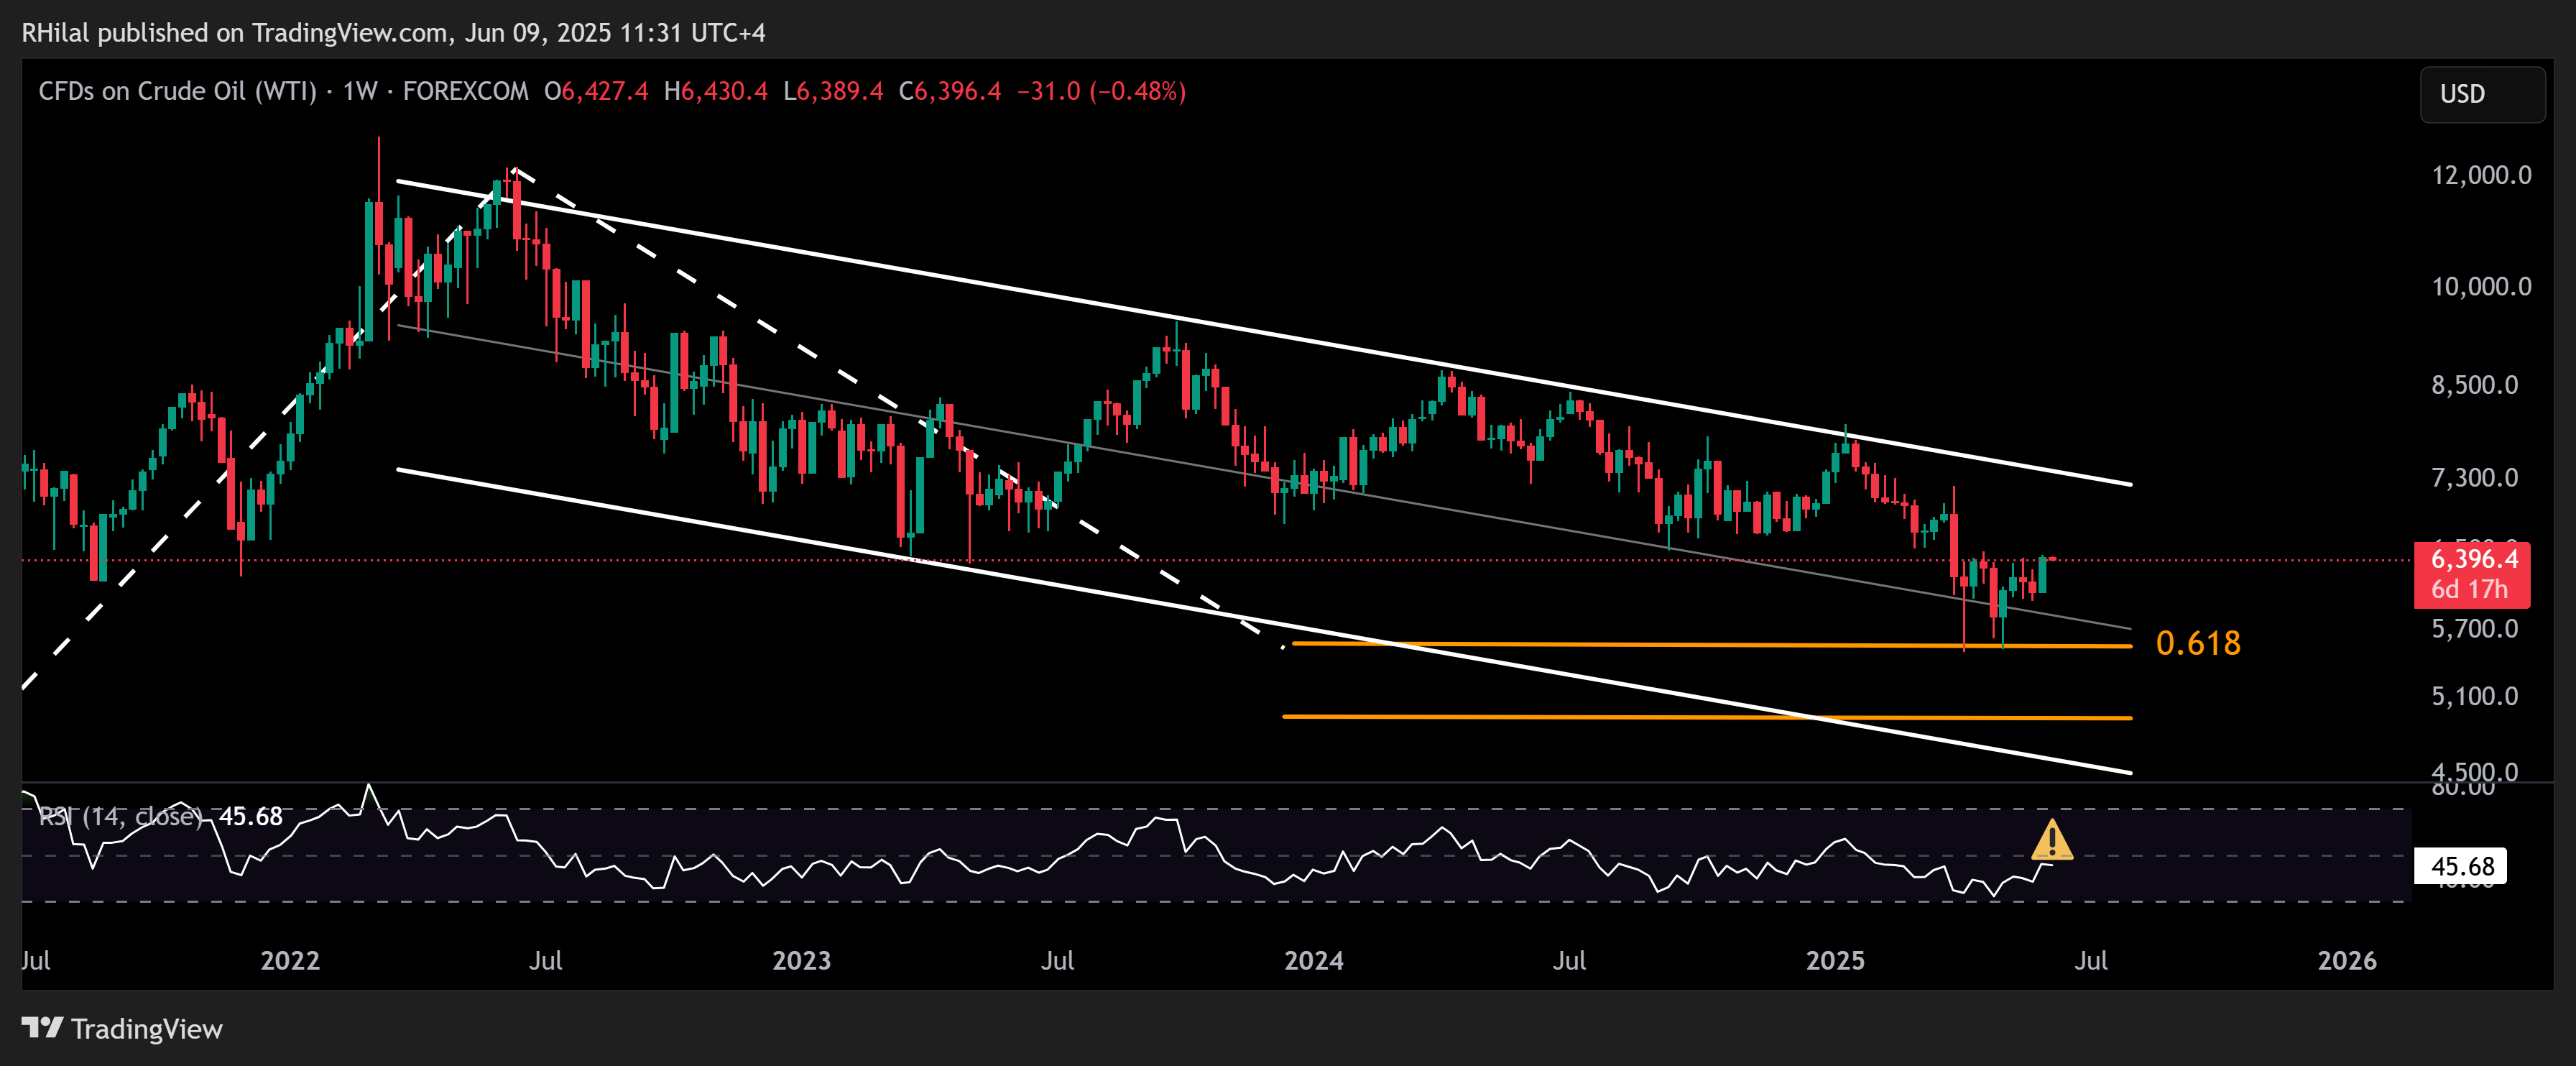
Crude Oil Outlook: Weekly Time Frame – Log Scale
Source: Tradingview
On the weekly chart, crude oil trades above the mid-range of a descending channel that has been in place since the 2022 highs. The RSI remains just below the neutral zone, suggesting a cautiously bullish-to-neutral outlook while prices hover beneath the $65 resistance level.
Crude Oil Outlook: Daily Time Frame – Log Scale
Source: Tradingview
From a daily perspective, oil prices remain capped below $65. A firm breakout above this level could pave the way toward $66 and potentially retest the $71 level. On the downside, the psychological support at $60 remains critical.
A break below $60—and more critically, below the $58 moving average—could reintroduce long term bullish positioning from $55 and $49. OPEC's willingness to manage supply levels near the $55 region has reinforced bullish sentiment, particularly as the market enters the summer demand season.
Silver Outlook: Weekly Time Frame – Log Scale
Source: Tradingview
Silver has surged past the $36.40 per ounce mark, reaching its highest level in 13 years after a clean breakout from a one-month consolidation phase spanning April and May 2025. The breakout targets the $37.30 level and aligns with a rising channel defined by higher lows since February 2024.
If silver retraces below $37, potential support levels include $34.70, $33.70, and $32.70, which may offer a base for consolidation or a recharge before continuation of the broader uptrend. A sustained hold above $37.30 could open the path toward the $40 level, further validating a larger inverted head and shoulders pattern on the monthly chart.
Silver Outlook: Monthly Time Frame – Log Scale
Source: Tradingview
From a monthly perspective, silver is tracing the breakout of its inverted head and shoulders pattern that extended between August 2020 and April 2024, in the direction of the 37 and 40 price zones. A clean hold above the 40-mark may open the way back towards 2011 records near 44, 50, and 53 highs. Drawdown risks may also be near as silver approaches its monthly time frame pattern target near 37.30, the 40 psychological mark, and overbought RSI levels last seen in 2020.
Written by Razan Hilal, CMT
Follow on X: @Rh_waves
Related tags:
Latest market news




Open an account in minutes
Experience award-winning platforms with fast and secure execution, and enjoy tight spreads from 0.5 pts on FX and 0.3 pts on indices.
Economic calendar
Web Trader platform
Our sophisticated web-based platform is packed with features.
Related articles
Gold Analysis: Resilient U.S. Labor Market Continues to Pressure XAU/USD
Recent trading sessions have not been particularly favorable for gold in the short term. XAU/USD has fallen nearly 2.5% over the last three sessions, reflecting that selling pressure is once again gaining relevance and that the metal continues to struggle to regain momentum.


FX, Commodities, and Indices: Major Moves and Key Levels
The U.S. Dollar Index, commodities, indices and cryptocurrencies are testing key levels as markets navigate the U.S. midterm elections, U.S.–Iran negotiations and key economic releases.

US Dollar, GBP/USD, USD/CAD, USD/CHF, Gold Weekly Technical Outlook 11 2 2026
Sr. Technical Strategist Michael Boutros highlights the levels that matter on the USD Majors, commodities, and equity indices charts this week.

This report is intended for general circulation only. It should not be construed as a recommendation, or an offer (or solicitation of an offer) to buy or sell any financial products. The information provided does not take into account your specific investment objectives, financial situation or particular needs. Before you act on any recommendation that may be contained in this report, independent advice ought to be sought from a financial adviser regarding the suitability of the investment product, taking into account your specific investment objectives, financial situation or particular needs.
StoneX Financial Pte. Ltd., may distribute reports produced by its respective foreign entities or affiliates within the StoneX group of companies or third parties pursuant to an arrangement under Regulation 32C of the Financial Advisers Regulations. Where the report is distributed to a person in Singapore who is not an accredited investor, expert investor or an institutional investor (as defined in the Securities Futures Act), StoneX Financial Pte. Ltd. accepts legal responsibility to such persons for the contents of the report only to the extent required by law. Singapore recipients should contact StoneX Financial Pte. Ltd. at 6826 9988 for matters arising from, or in connection with the report.
In the case of all other recipients of this report, to the extent permitted by applicable laws and regulations neither StoneX Financial Pte. Ltd. nor its associated companies will be responsible or liable for any loss or damage incurred arising out of, or in connection with, any use of the information contained in this report and all such liability is hereby expressly disclaimed. No representation or warranty is made, express or implied, that the content of this report is complete or accurate.
StoneX Financial Pte. Ltd. is not under any obligation to update this report.
Trading CFDs carries a high level of risk that may not be suitable for some investors. Consider your investment objectives, level of experience, financial resources, risk appetite and other relevant circumstances carefully. The possibility exists that you could lose some or all of your investments, including your initial deposits. If in doubt, please seek independent expert advice. Visit www.forex.com/en-sg/terms-and-policies for the complete Risk Disclosure Statement.