



Crude Oil Forecast: WTI closes the week above 80 dollars
These remain relevant sessions for WTI crude oil, which has recorded an increase of just over 14% on average over the last 5 trading sessions. This behavior indicates that the buying bias remains important in the short term.
Share this:

These remain relevant sessions for WTI crude oil, which has recorded an increase of just over 14% on average over the last 5 trading sessions. This behavior indicates that the buying bias remains important in the short term.
For now, bullish pressure continues as new updates emerge around tensions in the Middle East. This dynamic continues to raise the risk premium in the oil market and keeps supporting crude prices. If no relevant reduction in conflict risk is observed, buying pressure could remain important over the next few sessions.


How is the Middle East conflict evolving?
Toward the end of the week, new relevant updates emerged around the Middle East. Reports of attacks against logistics infrastructure and ports near the Gulf once again raised concerns about a possible escalation between the United States and Iran.
This scenario continues to generate concern around the Strait of Hormuz, through which more than 25% of global oil trade passes. It also reduces expectations of a quick resolution to the conflict, as recurring attacks continue to threaten geopolitical stability despite ongoing negotiations.
This event is important for the oil market because it keeps the risk premium elevated into the end of the week and reinforces fears of lower available crude supply. If demand remains stable, a potential reduction in supply due to disruptions could continue to generate bullish pressure in the short term.
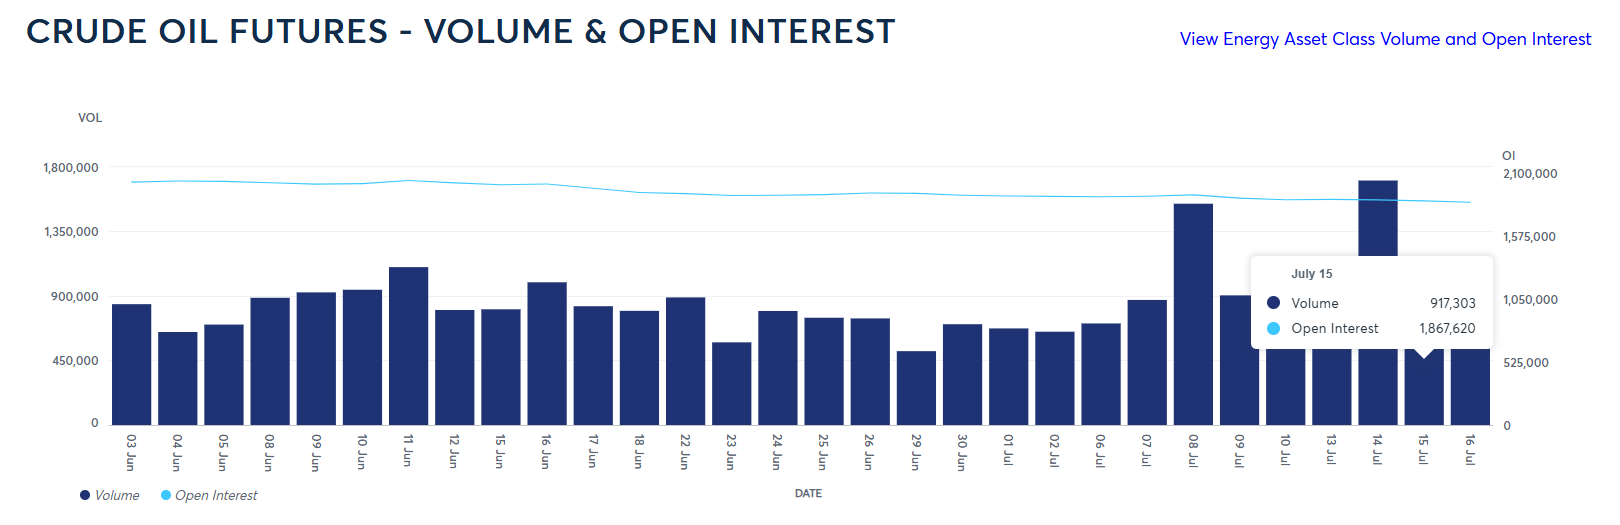
This dynamic has not only been relevant toward the end of the week. In recent sessions, as no clear progress has been seen in negotiations, activity in oil futures has remained elevated. On July 14, the highest volume peak of the month was recorded, with more than 1.7 million contracts traded, and activity remained consistent in the following sessions.
This increase in volume, combined with bullish pressure in oil prices, suggests that demand positions in crude futures have started to grow during the trading week.
Source: CMEGROUP
With all of the above in mind, potential disruptions to oil supply remain the most relevant fundamental catalyst in the short term. If new updates continue to point to delays in reliable negotiations around the Middle East, and this keeps uncertainty around a robust oil supply in place, buying pressure on WTI could remain relevant over the next few sessions.
What is happening with expected volatility?
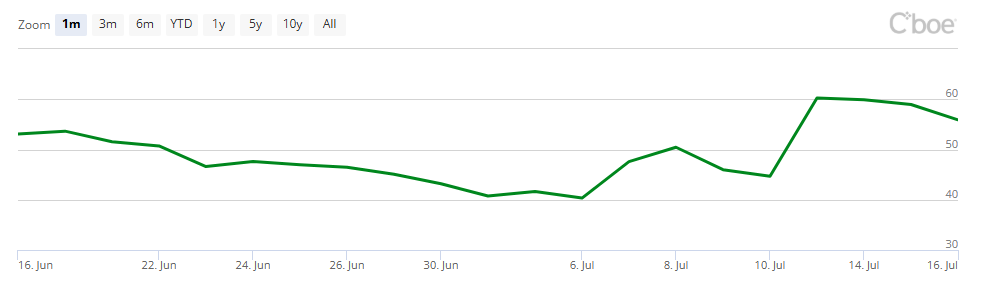
In recent trading sessions, the OVX index has rebounded toward the 60-point area, marking a new short-term upward slope. This movement suggests that the market is anticipating an increase in oil volatility, in a context where tensions in the Middle East continue to raise the risk premium on crude.
It is important to remember that the OVX measures expected oil volatility over the next 30 days, so its recent advance reflects a higher degree of nervousness among traders and potentially greater demand for hedges against sharp moves in WTI.
Source: CBOE
With this in mind, if the OVX continues to advance in the short term, the market could continue to show a greater need for protection against highly uncertain scenarios. In this context, the persistence of the geopolitical risk premium could keep WTI exposed to wide movements and eventually sustain buying pressure if fears of supply disruptions in the Middle East increase.
Technical forecast for WTI
Source: StoneX, Tradingview
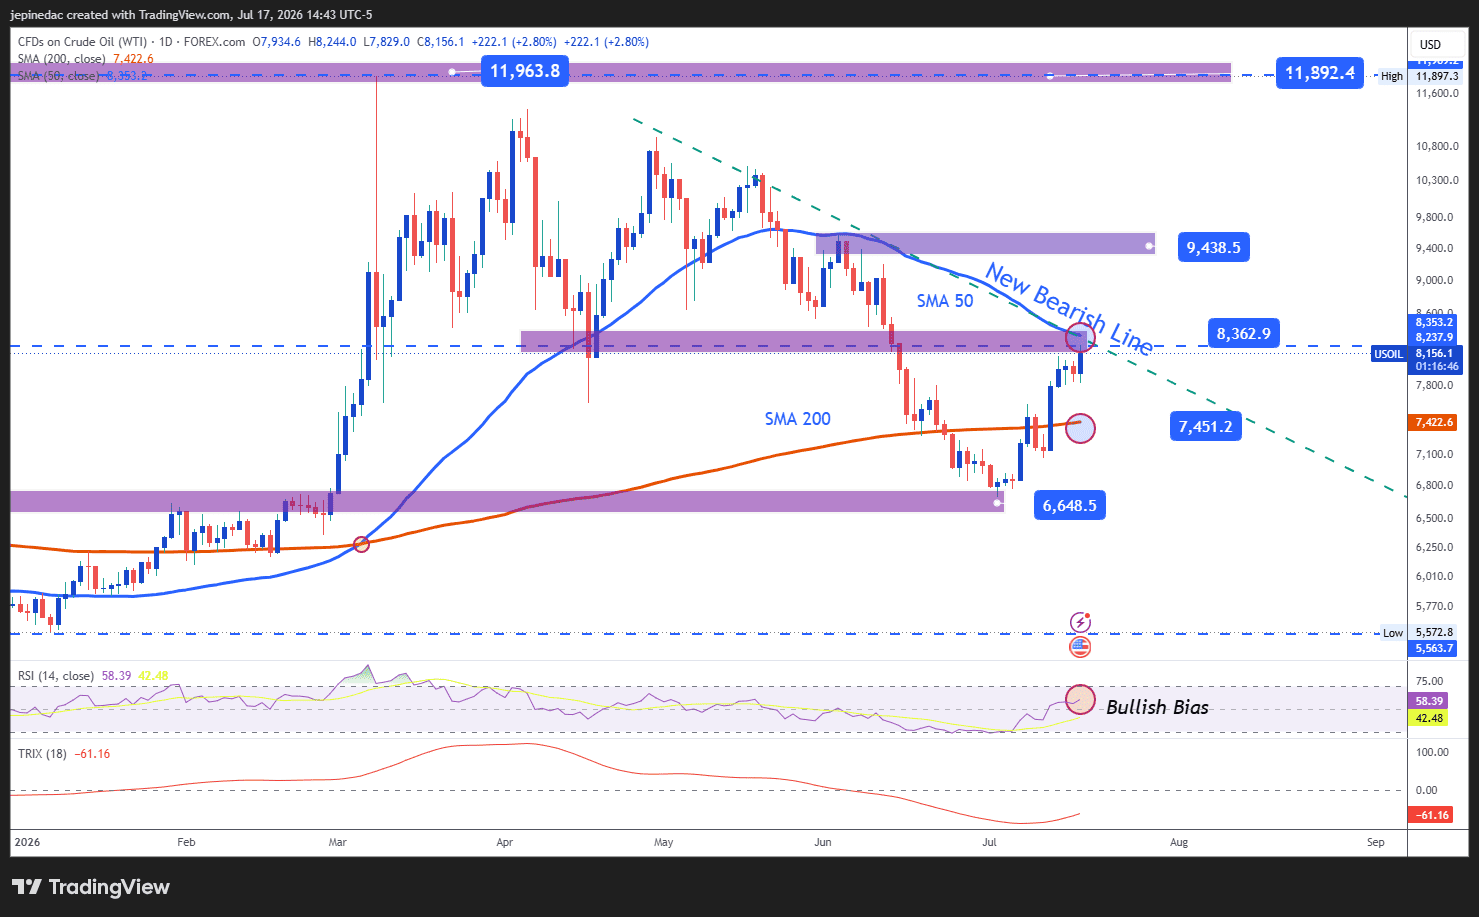
- Bearish trend line at risk: The current recovery in WTI has started to put the long bearish trend line on the daily chart at risk. This trend line has been in place since the final days of April and has been considered the most relevant technical structure over recent weeks. At the moment, price is approaching this trend line again. If relevant buying pressure manages to hold, a break of this structure could take place and open room for a stronger buying bias over the next few sessions.
- RSI: Now, the RSI is holding consistent movements above the neutral 50 level. This suggests that the average bullish impulse over the last 14 sessions has started to gain relevance and could continue to support a buying bias over the next few sessions.
- TRIX: The TRIX line has started to show an upward slope, although it still remains below the neutral 0 area. This suggests that selling strength in the exponential moving averages has started to fade, which could reflect an important shift in the chart’s dynamic and reinforce the importance of a short-term buying bias.
Key levels:
- 94 USD – Relevant resistance: This high level has not been seen since June of the current year and remains the farthest bullish barrier to watch. Price movements toward this level could reaffirm the dominance of a buying bias and open room for a potentially more relevant bullish trend line over the coming weeks.
- 83 USD – Critical barrier: This area is marked by the long bearish trend line and the 50-period simple moving average. Price movements above this level could put the dominant bearish structure at risk and start to show a clearer buying bias in the short term.
- 66 USD – Key support: This level corresponds to price lows not seen since February 2026 and currently represents the most important bearish barrier. Consistent movements below this level could reinforce a dominant selling bias and open room for a relevant extension of the bearish trend line over the coming weeks.
Written by Julian Pineda, CFA, CMT – Market Analyst
Follow him on: @julianpineda25



Open an account in minutes
Experience award-winning platforms with fast and secure execution, and enjoy tight spreads from 0.5 pts on FX and 0.3 pts on indices.
Economic calendar
Web Trader platform
Our sophisticated web-based platform is packed with features.
Related articles

Gold Price Forecast: XAU/USD Plunges 12.4% Toward Critical Support 10 1 2026
Softer inflation has revived expectations for a Fed pause, but Friday’s payrolls could put gold’s recovery prospects to the test.


Nasdaq 100 Forecast: NDX slips as Treasury yields keep rising
U.S. stocks are falling at the start of Q4, as gains in software stocks offset concerns over soaring Treasury yields. U.S. Treasury yields continue to rise, with the 10-year yield up 2 basis points at 5.31% and the 30-year at 5.66%, multi-decade highs.


S&P 500 Forecast: SPX rises after cooler-than-expected inflation data
U.S. stocks are rising and Treasury yields are falling after data showed that inflation increased at a cooler pace than expected, while U.S. consumer spending rose again in August.
This report is intended for general circulation only. It should not be construed as a recommendation, or an offer (or solicitation of an offer) to buy or sell any financial products. The information provided does not take into account your specific investment objectives, financial situation or particular needs. Before you act on any recommendation that may be contained in this report, independent advice ought to be sought from a financial adviser regarding the suitability of the investment product, taking into account your specific investment objectives, financial situation or particular needs.
StoneX Financial Pte. Ltd., may distribute reports produced by its respective foreign entities or affiliates within the StoneX group of companies or third parties pursuant to an arrangement under Regulation 32C of the Financial Advisers Regulations. Where the report is distributed to a person in Singapore who is not an accredited investor, expert investor or an institutional investor (as defined in the Securities Futures Act), StoneX Financial Pte. Ltd. accepts legal responsibility to such persons for the contents of the report only to the extent required by law. Singapore recipients should contact StoneX Financial Pte. Ltd. at 6826 9988 for matters arising from, or in connection with the report.
In the case of all other recipients of this report, to the extent permitted by applicable laws and regulations neither StoneX Financial Pte. Ltd. nor its associated companies will be responsible or liable for any loss or damage incurred arising out of, or in connection with, any use of the information contained in this report and all such liability is hereby expressly disclaimed. No representation or warranty is made, express or implied, that the content of this report is complete or accurate.
StoneX Financial Pte. Ltd. is not under any obligation to update this report.
Trading CFDs carries a high level of risk that may not be suitable for some investors. Consider your investment objectives, level of experience, financial resources, risk appetite and other relevant circumstances carefully. The possibility exists that you could lose some or all of your investments, including your initial deposits. If in doubt, please seek independent expert advice. Visit www.forex.com/en-sg/terms-and-policies for the complete Risk Disclosure Statement.