



Crude Oil, Gold Price Outlook: WTI Holds $100, Adding Pressure on Gold Below 4600
Crude Oil, Gold Price Outlook: crude oil prices are holding near the $100 threshold, pointing to further upside risks as the Strait of Hormuz disruption and Middle East energy infrastructure risks persist, with no clear resolution in sight.
Share this:

Crude oil prices remain anchored near the $100 threshold, pointing to further upside risks as the Strait of Hormuz disruption and broader Middle East energy infrastructure risks continue. Headline-driven sentiment remains volatile, swinging on Trump’s comments between de-escalation efforts, safe passage through the Strait of Hormuz, and renewed threats toward Iran.
This conflict is expected to remain the primary driver of crude oil and global markets as we move into Q2 2026, with the potential for amplified moves should key economic indicators align with prevailing market fears.
- German CPI rises to two-year highs, 0.2% -> 1.1%, amid increasing energy costs
- Eurozone core CPI rises to one-year highs near 2.5%, up from 1.9%
Market attention now turns to US ISM PMI, ADP employment data, and Non-Farm Payrolls to further assess the impact of the US–Middle East conflict on inflation and labor markets.
Key Levels to Watch
- WTI: close above 110, below 89 (Click here for the Q2 2026 outlook)
- Gold: close above 4680, below 4200
- Dollar: close above 100.60, below 98 (Click here for the latest DXY analysis)
These levels represent key thresholds for potential structural shifts. A move above 110 in crude could extend inflationary pressures, reinforcing hawkish central bank expectations, supporting a DXY move above 100.60, and weighing on gold toward the 4200–4000 psychological zone. On the downside, a break below key support levels would reflect de-escalation dynamics, potentially reversing the geopolitical risk premium across markets.
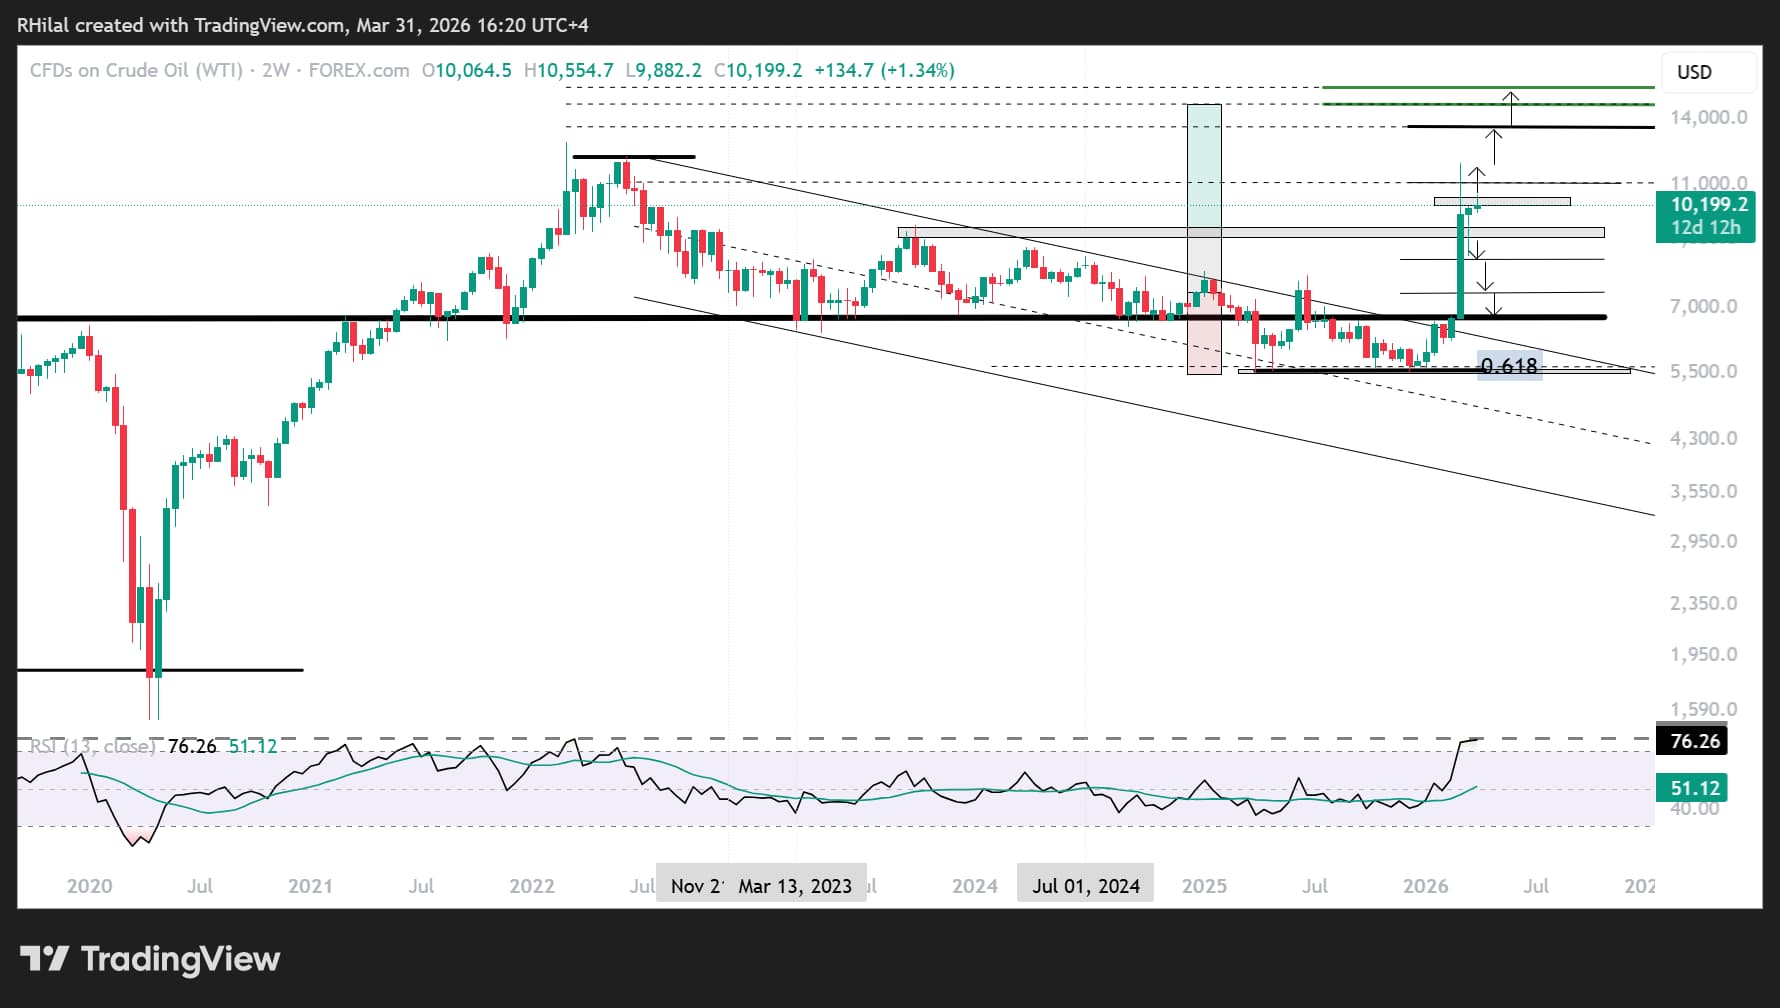
Crude Oil Weekly Outlook – Log Scale
Source: Trading View
As we enter Q2 2026, crude oil prices continue to point toward further upside risks in line with ongoing energy disruptions in the Middle East, despite headlines on potential de escalations. From a price action perspective, crude is:
- Holding above the 2023 highs and resistance at $91–93 per barrel
- Showing a strong rejection from the $84 zone
- Closing near the $100 mark as markets enter the fifth week of the Middle East conflict, keeping the upside scenario favored at the start of the quarter
Bullish scenario
A close above 110 on WTI and 115 on Brent would extend upside projections toward the 118 yearly high and further into the 135–150 range, signaling continued disruption to energy supply, infrastructure, and alternative routing around Hormuz.
Bearish scenario
A close below 89 would extend short-term downside risks toward the 82 and 74 zones, aligning with the highs of 2025 and previous Middle East conflict levels, where support may emerge. A break below these levels could shift price action back toward the $60 zone, in line with broader policy-driven normalization.
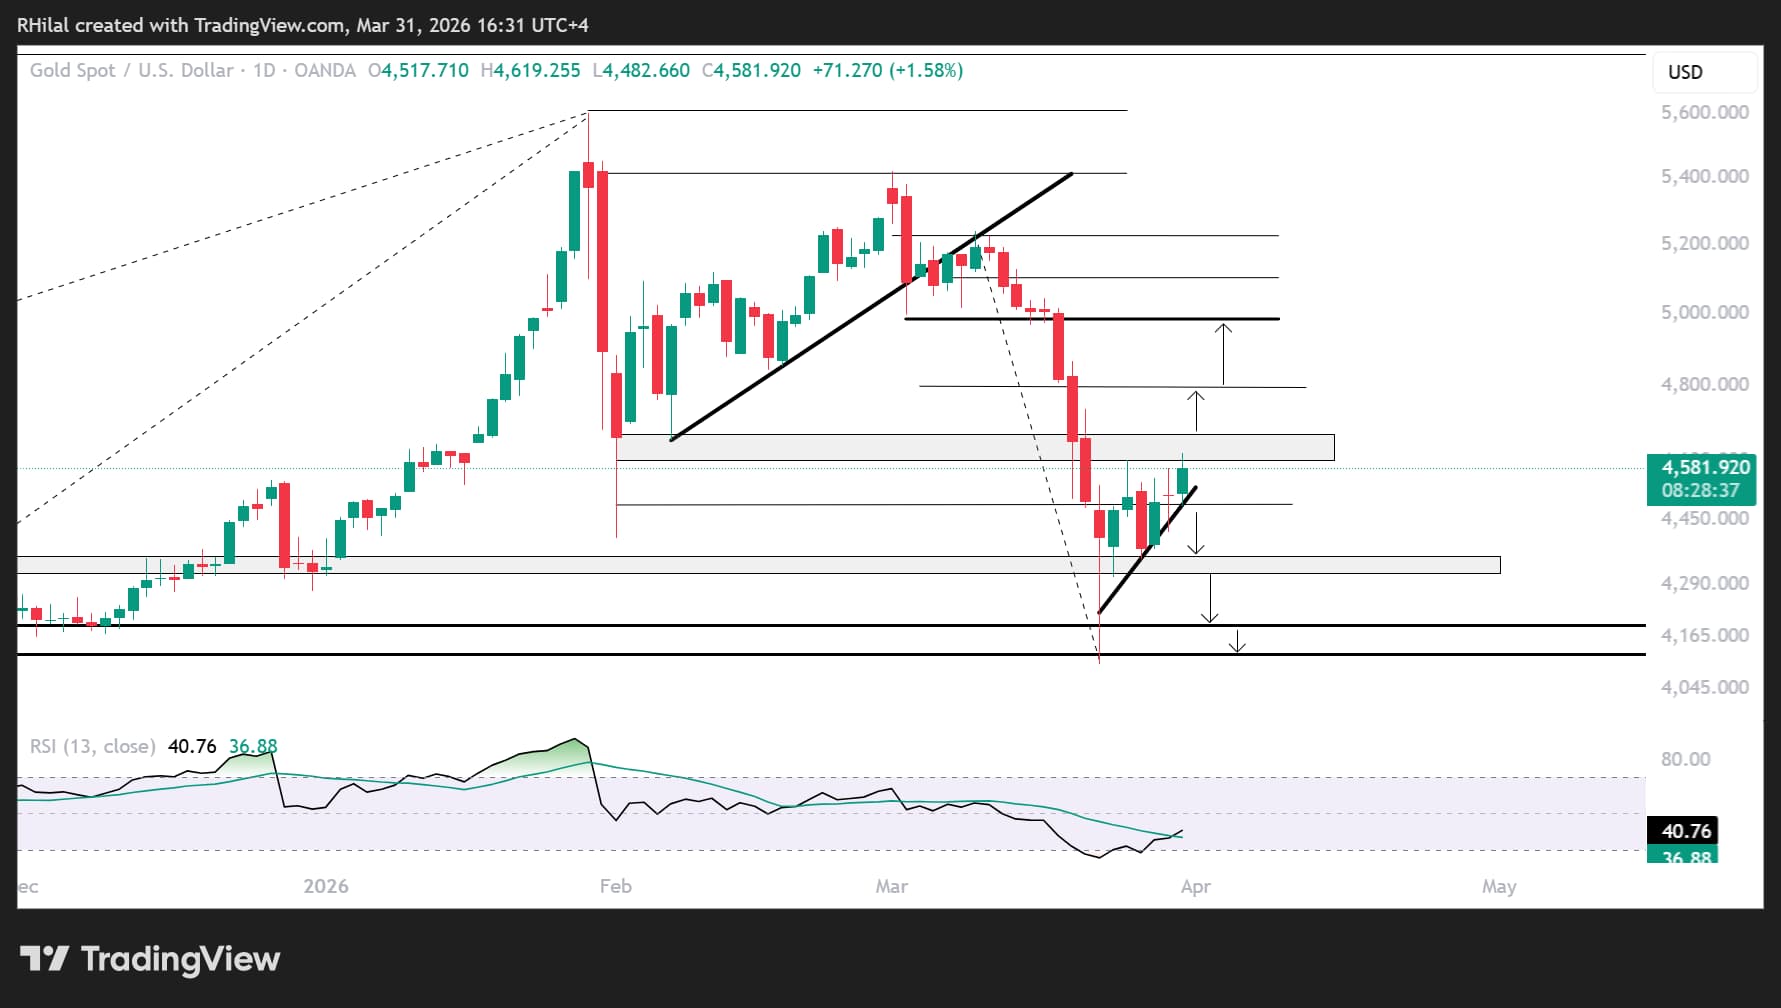
Gold Daily Outlook – Log Scale
Source: Trading View
On the daily chart, gold is forming a consolidation pattern with higher lows from the 4080 level and stable highs below the 4660 resistance. This structure resembles the setup seen after the February rebound into the March 2026 highs, leaving two scenarios in focus: a breakdown below trendline support or a breakout above resistance.
Bullish scenario
A close above 4660 would open the path toward 4800 and 4980, where pullback risks may emerge. These levels align with the 0.618 and 0.786 Fibonacci retracement levels of the March 2026 decline. A sustained move above 4980 would reinforce the longer-term outlook toward 5250, the key barrier before extending toward the 5600–6000 range or entering another consolidation phase.
Bearish scenario
A break below the rising trendline from the 4080 lows, and below 4480, would extend downside risks toward 4300, 4180, and 4120 as potential support zones. A deeper move could expose 3500 and 3000 as longer-term accumulation areas, potentially aligning with a broader correction in silver toward the $50 zone.
Long-term levels remain critical in distinguishing structural shifts from headline-driven volatility, particularly within the context of the ongoing US–Middle East conflict and its impact on crude oil markets.
Written by Razan Hilal, CMT
Follow on X: @Rh_waves


Open an account in minutes
Experience award-winning platforms with fast and secure execution, and enjoy tight spreads from 0.5 pts on FX and 0.3 pts on indices.
Economic calendar
Web Trader platform
Our sophisticated web-based platform is packed with features.
Related articles

Dow Jones Forecast: DJIA rises after weaker jobs data
U.S. stocks are rising after weaker-than-expected U.S. jobs data saw markets rein in rate hike expectations.


Gold Price Forecast: XAU/USD Plunges 12.4% Toward Critical Support 10 1 2026
Softer inflation has revived expectations for a Fed pause, but Friday’s payrolls could put gold’s recovery prospects to the test.


Nasdaq 100 Forecast: NDX slips as Treasury yields keep rising
U.S. stocks are falling at the start of Q4, as gains in software stocks offset concerns over soaring Treasury yields. U.S. Treasury yields continue to rise, with the 10-year yield up 2 basis points at 5.31% and the 30-year at 5.66%, multi-decade highs.
This report is intended for general circulation only. It should not be construed as a recommendation, or an offer (or solicitation of an offer) to buy or sell any financial products. The information provided does not take into account your specific investment objectives, financial situation or particular needs. Before you act on any recommendation that may be contained in this report, independent advice ought to be sought from a financial adviser regarding the suitability of the investment product, taking into account your specific investment objectives, financial situation or particular needs.
StoneX Financial Pte. Ltd., may distribute reports produced by its respective foreign entities or affiliates within the StoneX group of companies or third parties pursuant to an arrangement under Regulation 32C of the Financial Advisers Regulations. Where the report is distributed to a person in Singapore who is not an accredited investor, expert investor or an institutional investor (as defined in the Securities Futures Act), StoneX Financial Pte. Ltd. accepts legal responsibility to such persons for the contents of the report only to the extent required by law. Singapore recipients should contact StoneX Financial Pte. Ltd. at 6826 9988 for matters arising from, or in connection with the report.
In the case of all other recipients of this report, to the extent permitted by applicable laws and regulations neither StoneX Financial Pte. Ltd. nor its associated companies will be responsible or liable for any loss or damage incurred arising out of, or in connection with, any use of the information contained in this report and all such liability is hereby expressly disclaimed. No representation or warranty is made, express or implied, that the content of this report is complete or accurate.
StoneX Financial Pte. Ltd. is not under any obligation to update this report.
Trading CFDs carries a high level of risk that may not be suitable for some investors. Consider your investment objectives, level of experience, financial resources, risk appetite and other relevant circumstances carefully. The possibility exists that you could lose some or all of your investments, including your initial deposits. If in doubt, please seek independent expert advice. Visit www.forex.com/en-sg/terms-and-policies for the complete Risk Disclosure Statement.