



Crude Oil Update: WTI Barrel Returns to Yearly Lows
Over the past five trading sessions, the price of WTI crude has fallen by about 2.7%, establishing a new consistent bearish bias in short-term price movements. For now, selling pressure remains relevant, driven by concerns over a potential decline in global demand.
Share this:

Over the past five trading sessions, the price of WTI crude has fallen by about 2.7%, establishing a new consistent bearish bias in short-term price movements. For now, selling pressure remains relevant, driven by concerns over a potential decline in global demand, which could sustain a bearish outlook in the coming sessions.


Is Consumption at Risk?
Since the first comments suggesting a renewed escalation in the U.S.–China trade war, WTI crude has shown a steady downward trend. The trade tensions have raised doubts about global oil demand, which could weigh on market appetite for crude in the coming weeks.
Although there have been diplomatic efforts to resolve the conflict, there is still no clarity on when the world’s two largest economies might reach an agreement. In the coming days, a meeting between the Chinese Vice Premier and the U.S. Treasury Secretary is expected to take place, which could determine whether progress is made toward more concrete trade accords and whether the 100% tariff on Chinese goods, scheduled for November 1, can be avoided.
In this context, the fact that the United States and China—the world’s two largest oil consumers—are involved in this conflict adds further uncertainty. The U.S. consumes around 19 million barrels per day, while China consumes roughly 16.4 million barrels, according to data from late 2024.
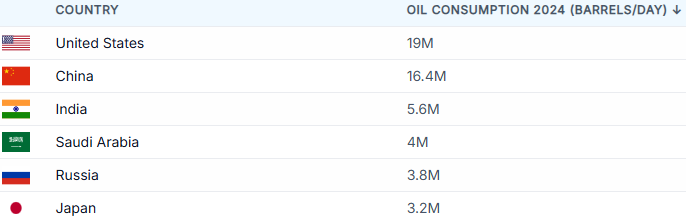
Source: Worldpopulationreview
If the trade conflict escalates, it could lead to a more aggressive tariff war, hurting the economic growth outlook in both countries. As they are the largest consumers of crude, any slowdown in their economies would put global oil demand at risk.
Additionally, while OPEC+ continues focusing on gradually increasing production throughout 2025, the combination of rising supply and weakening demand could lead to a structural imbalance between supply and demand. This would keep selling pressure on WTI crude, especially if no tangible progress is made on trade negotiations. As long as this uncertainty persists, the bearish trend is likely to dominate in the short term.
What’s Happening with Oil Market Confidence?
The CBOE OVX Index has begun to rise in the short term, approaching the 40-point level, reflecting an increase in implied volatility for crude oil. This uptick suggests growing uncertainty about oil’s future and the potential for sharp price swings, which could lead to deeper short-term corrections.
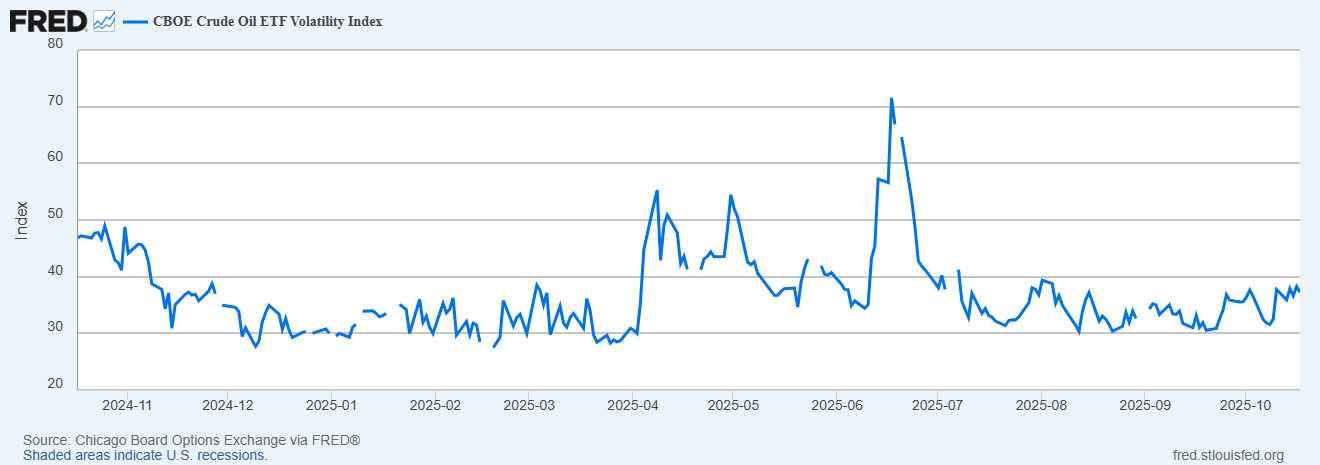
Source: CBOE
The sustained rise in the OVX can be interpreted as a signal of market distrust, as higher volatility tends to drive rapid declines in crude prices. As long as the market does not perceive price stability, the OVX will likely continue climbing, reinforcing the idea that oil remains a risk asset amid ongoing uncertainty about future demand. This may limit short-term demand and strengthen a temporary bearish bias.
WTI Technical Outlook
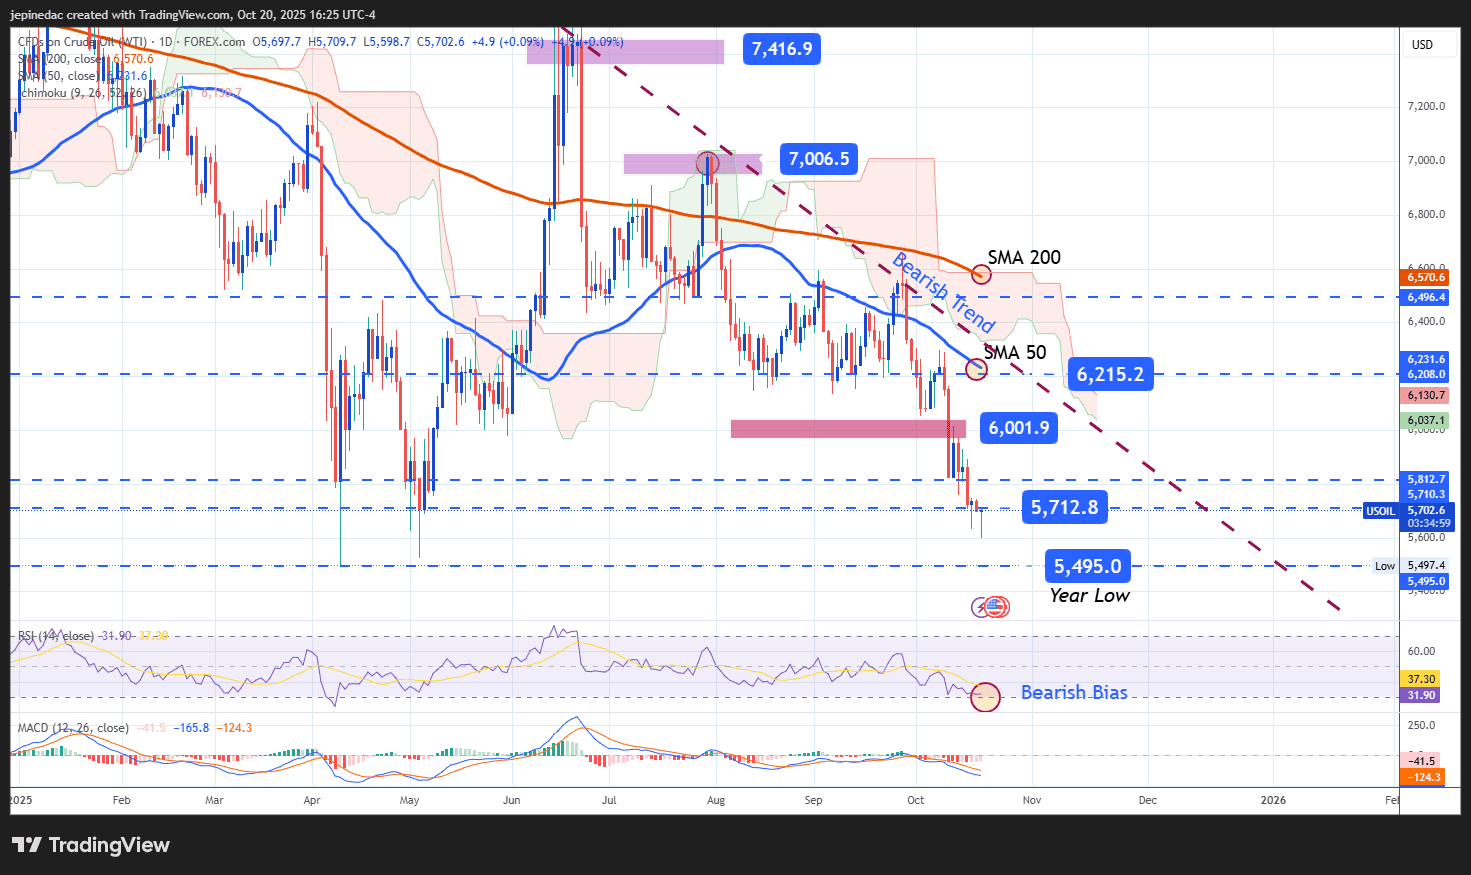
Source: StoneX, Tradingview
- Consistent Downtrend: Since late June, WTI has maintained a steady bearish trend, with prices oscillating below the $60 level. So far, there are no meaningful bullish corrections that could threaten this trend. As long as selling pressure remains dominant, the bearish bias is expected to persist in the broader outlook.
- RSI: The RSI remains below the 50 level, indicating that selling momentum has dominated over the past 14 sessions. However, the indicator is gradually approaching the oversold zone (level 30), which could signal a potential imbalance in market forces and open the door for technical rebounds in the short term.
- MACD: The MACD histogram remains below the neutral line (0), reflecting a consistent bearish tone. If it continues moving away from neutrality, selling pressure could intensify further in the coming days.
Key Levels:
- $60 – Major Resistance: A key psychological level. A sustained breakout above this point could challenge the current downtrend and trigger renewed buying pressure.
- $57 – Near-Term Barrier: Represents the most recent retracement zone. If WTI consolidates around this level, it could trigger short-term bullish corrections.
- $55 – Key Support: Corresponds to the yearly lows and remains the most important selling barrier. A sustained break below would confirm a stronger bearish acceleration in the short term.
Written by Julian Pineda, CFA – Market Analyst
Follow him on: @julianpineda25



Open an account in minutes
Experience award-winning platforms with fast and secure execution, and enjoy tight spreads from 0.5 pts on FX and 0.3 pts on indices.
Economic calendar
Web Trader platform
Our sophisticated web-based platform is packed with features.
Related articles

Gold Price Forecast: XAU/USD Plunges 12.4% Toward Critical Support 10 1 2026
Softer inflation has revived expectations for a Fed pause, but Friday’s payrolls could put gold’s recovery prospects to the test.


Nasdaq 100 Forecast: NDX slips as Treasury yields keep rising
U.S. stocks are falling at the start of Q4, as gains in software stocks offset concerns over soaring Treasury yields. U.S. Treasury yields continue to rise, with the 10-year yield up 2 basis points at 5.31% and the 30-year at 5.66%, multi-decade highs.


S&P 500 Forecast: SPX rises after cooler-than-expected inflation data
U.S. stocks are rising and Treasury yields are falling after data showed that inflation increased at a cooler pace than expected, while U.S. consumer spending rose again in August.
This report is intended for general circulation only. It should not be construed as a recommendation, or an offer (or solicitation of an offer) to buy or sell any financial products. The information provided does not take into account your specific investment objectives, financial situation or particular needs. Before you act on any recommendation that may be contained in this report, independent advice ought to be sought from a financial adviser regarding the suitability of the investment product, taking into account your specific investment objectives, financial situation or particular needs.
StoneX Financial Pte. Ltd., may distribute reports produced by its respective foreign entities or affiliates within the StoneX group of companies or third parties pursuant to an arrangement under Regulation 32C of the Financial Advisers Regulations. Where the report is distributed to a person in Singapore who is not an accredited investor, expert investor or an institutional investor (as defined in the Securities Futures Act), StoneX Financial Pte. Ltd. accepts legal responsibility to such persons for the contents of the report only to the extent required by law. Singapore recipients should contact StoneX Financial Pte. Ltd. at 6826 9988 for matters arising from, or in connection with the report.
In the case of all other recipients of this report, to the extent permitted by applicable laws and regulations neither StoneX Financial Pte. Ltd. nor its associated companies will be responsible or liable for any loss or damage incurred arising out of, or in connection with, any use of the information contained in this report and all such liability is hereby expressly disclaimed. No representation or warranty is made, express or implied, that the content of this report is complete or accurate.
StoneX Financial Pte. Ltd. is not under any obligation to update this report.
Trading CFDs carries a high level of risk that may not be suitable for some investors. Consider your investment objectives, level of experience, financial resources, risk appetite and other relevant circumstances carefully. The possibility exists that you could lose some or all of your investments, including your initial deposits. If in doubt, please seek independent expert advice. Visit www.forex.com/en-sg/terms-and-policies for the complete Risk Disclosure Statement.