



Crude Oil Weekly Outlook: WTI Holds Above $97 as US–Iran Proposals Misalign, Supply Risks Persist
Crude Oil Weekly Outlook: US–Iran proposals remain misaligned, choking what could become the largest supply shock in history in terms of inventories and flows. This continues to support WTI and Brent in bullish territory, holding above $93 and $100, respectively.
Share this:

Weekly Drivers: Oil Prices, Geopolitics, and Supply Risks
- Trump stated that the latest Iranian peace proposal is unacceptable, following a bullish weekly close in crude prices, above $96.
- OPEC’s Sunday meeting highlighted the group’s unity despite the UAE’s exit, announcing a symbolic production increase of 188,000 barrels for June. However, production quotas remain ineffective as long as the Hormuz Strait stays disrupted, stranding and threatening tanker flows.
- Hormuz blockages and facility strikes are extending the recovery timeline required for the region to restore oil and gas supply capacity.
- Price action suggests bullish positioning above the 2023 highs, with key levels at $93 for WTI and $95 for Brent.
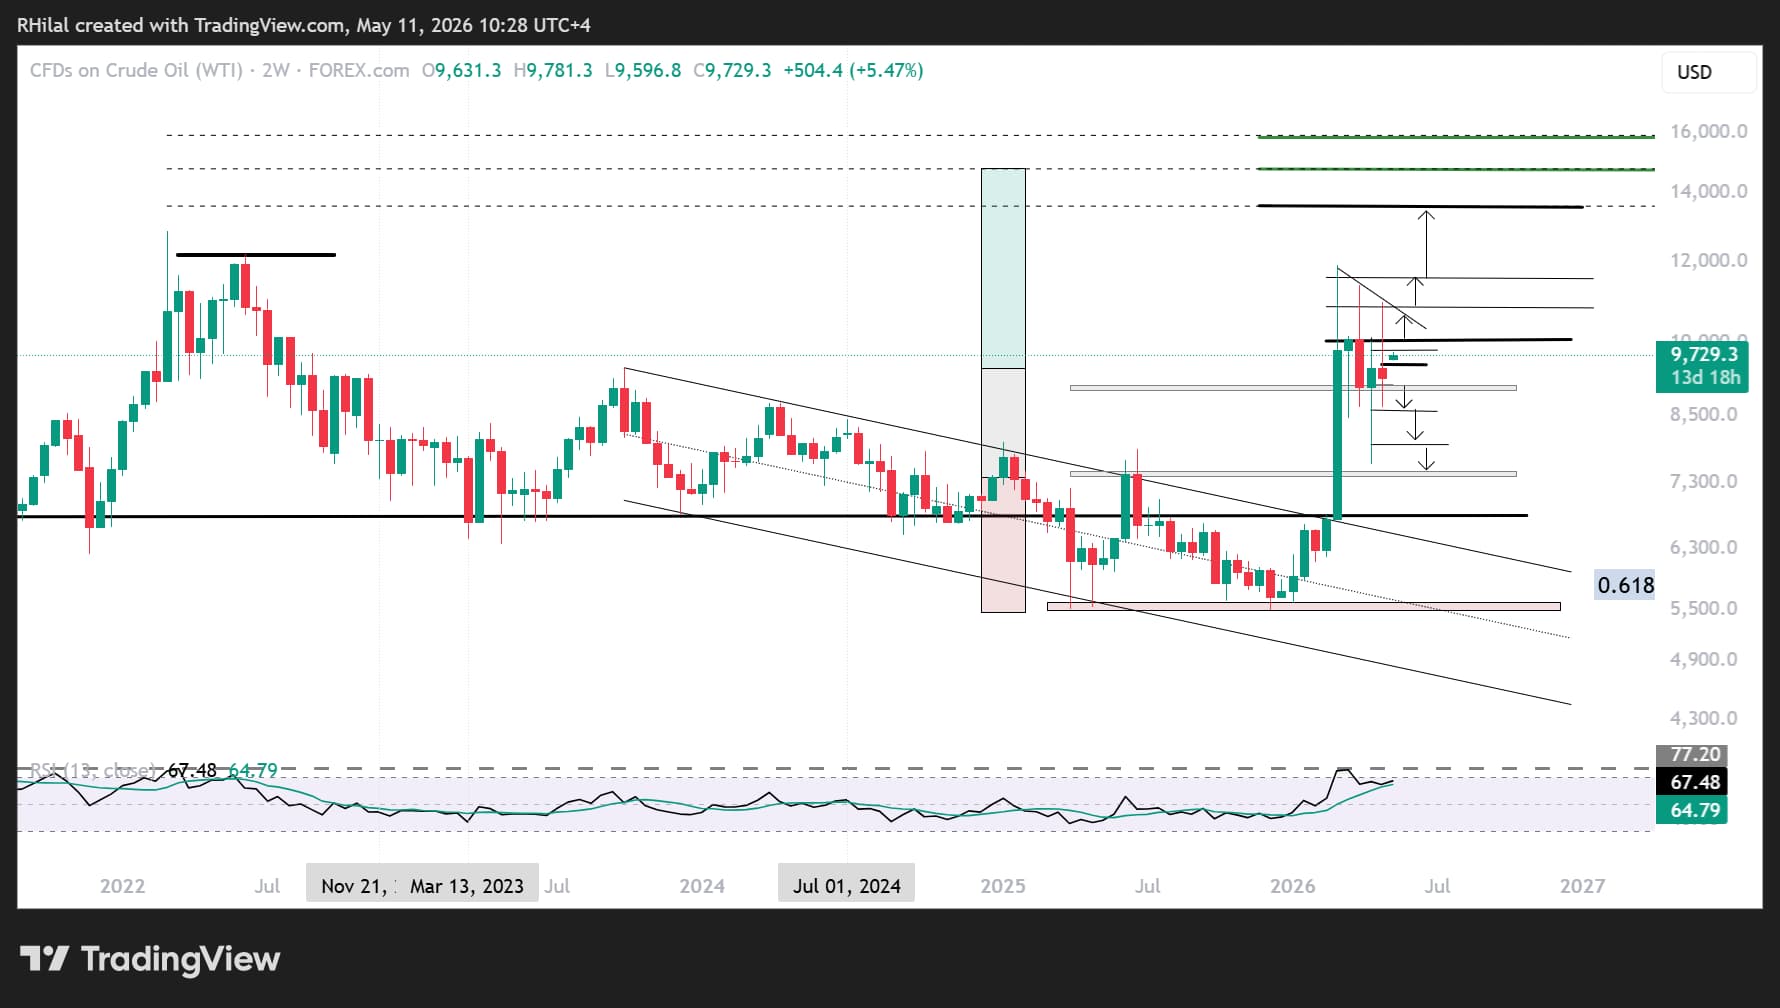
From a 2-week perspective, strong price rejections are visible below the $120 level, forming lower highs. At the same time, a strong bullish rejection from the $76 zone reinforces a broader structure of indecision with a bullish bias on the crude oil chart—until either diplomatic alignment or further geopolitical escalation materializes.
Crude Oil Price Forecast: 2-Week Chart Analysis (Log Scale)
 Source: Trading view
The following framework remains anchored in the Q2 2026 outlook, reinforcing the importance of long-term levels over political narratives on the price chart.
Scenario Framework:
- Bearish Scenario:
A diplomatic breakthrough, combined with a close below $91, $88, and $84, would expose prices to the previous rejection zone at $76–$74—the highs of June 2025 during prior Middle East tensions—testing the waters for a deeper crude unwind or another volatility-driven whipsaw. - Base Case:
Prolonged supply disruption keeps crude oil prices trading within the $91–$115 range. - Bullish Scenario:
Extreme geopolitical escalation could drive a sustained breakout above $115, extending toward $135 and $157, aligning with the 0.786 and 100% Fibonacci extensions of the 2020–2022–2026 price cycle.
Headline-driven volatility is one aspect of the market, but long-term price closes and sustained levels ultimately reveal the dominant trend and broader outlook for crude oil beyond short-term noise.
Written by Razan Hilal, CMT
Follow on X: @Rh_waves


Open an account in minutes
Experience award-winning platforms with fast and secure execution, and enjoy tight spreads from 0.5 pts on FX and 0.3 pts on indices.
Economic calendar
Web Trader platform
Our sophisticated web-based platform is packed with features.
Related articles
Dow Jones Forecast: DJIA rises after weaker jobs data
U.S. stocks are rising after weaker-than-expected U.S. jobs data saw markets rein in rate hike expectations.

What Stretched 10-Year Yields Mean for Major Currency Pairs in Q4
U.S. 10-year Treasury yields are nearing a long-term resistance zone with overbought RSI readings, raising near-term pullback risk for the dollar.

USD/CAD shooting star puts September surge on notice
USD/CAD has printed a clear bearish reversal pattern after an extraordinary September surge, but confirmation may depend heavily on how US Treasury yields react to Friday’s payrolls report.

This report is intended for general circulation only. It should not be construed as a recommendation, or an offer (or solicitation of an offer) to buy or sell any financial products. The information provided does not take into account your specific investment objectives, financial situation or particular needs. Before you act on any recommendation that may be contained in this report, independent advice ought to be sought from a financial adviser regarding the suitability of the investment product, taking into account your specific investment objectives, financial situation or particular needs.
StoneX Financial Pte. Ltd., may distribute reports produced by its respective foreign entities or affiliates within the StoneX group of companies or third parties pursuant to an arrangement under Regulation 32C of the Financial Advisers Regulations. Where the report is distributed to a person in Singapore who is not an accredited investor, expert investor or an institutional investor (as defined in the Securities Futures Act), StoneX Financial Pte. Ltd. accepts legal responsibility to such persons for the contents of the report only to the extent required by law. Singapore recipients should contact StoneX Financial Pte. Ltd. at 6826 9988 for matters arising from, or in connection with the report.
In the case of all other recipients of this report, to the extent permitted by applicable laws and regulations neither StoneX Financial Pte. Ltd. nor its associated companies will be responsible or liable for any loss or damage incurred arising out of, or in connection with, any use of the information contained in this report and all such liability is hereby expressly disclaimed. No representation or warranty is made, express or implied, that the content of this report is complete or accurate.
StoneX Financial Pte. Ltd. is not under any obligation to update this report.
Trading CFDs carries a high level of risk that may not be suitable for some investors. Consider your investment objectives, level of experience, financial resources, risk appetite and other relevant circumstances carefully. The possibility exists that you could lose some or all of your investments, including your initial deposits. If in doubt, please seek independent expert advice. Visit www.forex.com/en-sg/terms-and-policies for the complete Risk Disclosure Statement.