



Does the strong Retail Sales data check the box for higher rates?
“Never bet against the American consumer” is a phrase that has been thrown around the street, and June’s data shows why.
Share this:

Fed member Christopher Waller said yesterday that despite a 40-year high CPI reading at 9.1% YoY, he still supports a 75bps rate hike at the upcoming FOMC in late July. However, he also noted that if June Retail Sales and housing data “come in materially stronger than expected, it would make me lean towards a larger hike.” June’s Retail Sales data released earlier today showed that the headline number rose by 1% MoM vs 0.8% MoM expected and a higher revised print for May to -0.1% MoM. In addition, the Ex-Autos print was also 1% MoM vs 0.6% MoM expected and a higher revised print for May to +0.1% MoM.
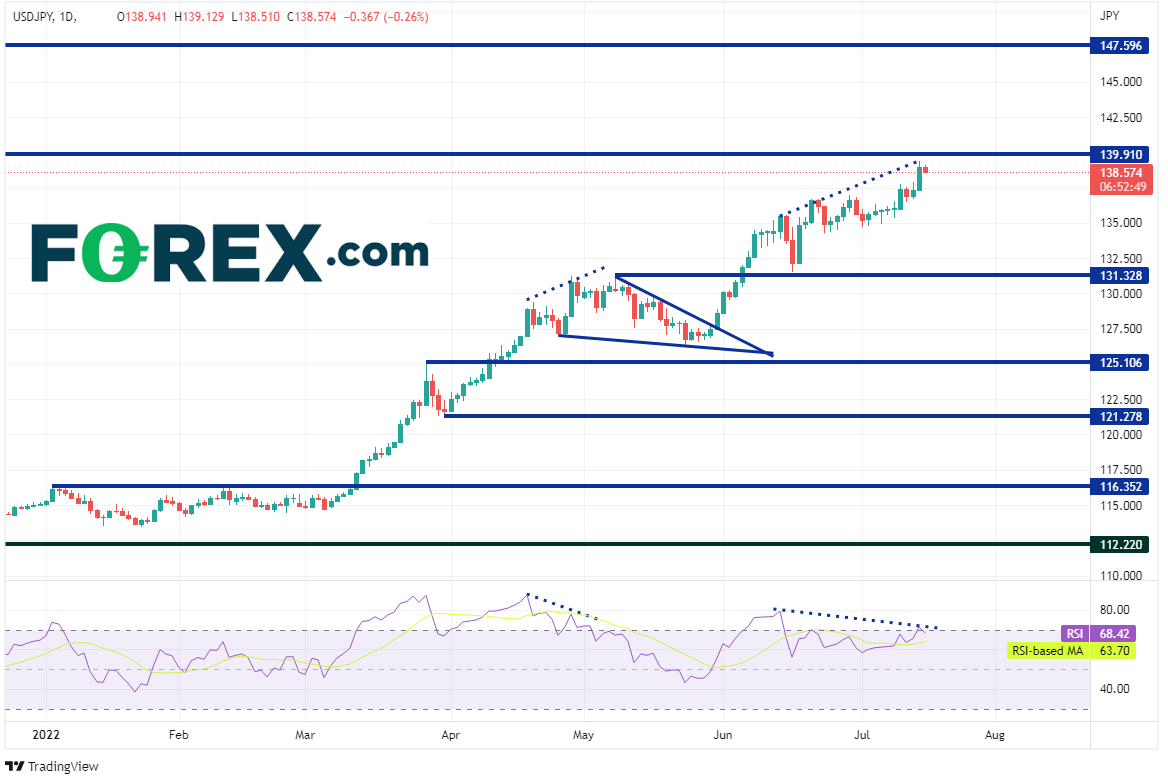
USD/JPY has been moving aggressively higher since breaking above 116.35 on March 11th. The pair moved to 131.33 on May 9th as it became apparent that higher US inflation data would lead the Fed to hike interest rates more aggressively. USD/JPY then pulled back in a descending wedge formation as the RSI diverged in overbought territory. On May 31st, USD/JPY broke out of the wedge and continued its move higher. On July 14th, the pair reached its highest level since September 1998 at 138.94. However, notice that the RSI is diverging with price in overbought territory once again. Does that mean price is ready for a correction once again ahead of the September 1998 highs at 139.91?
Source: Tradingview, Stone X
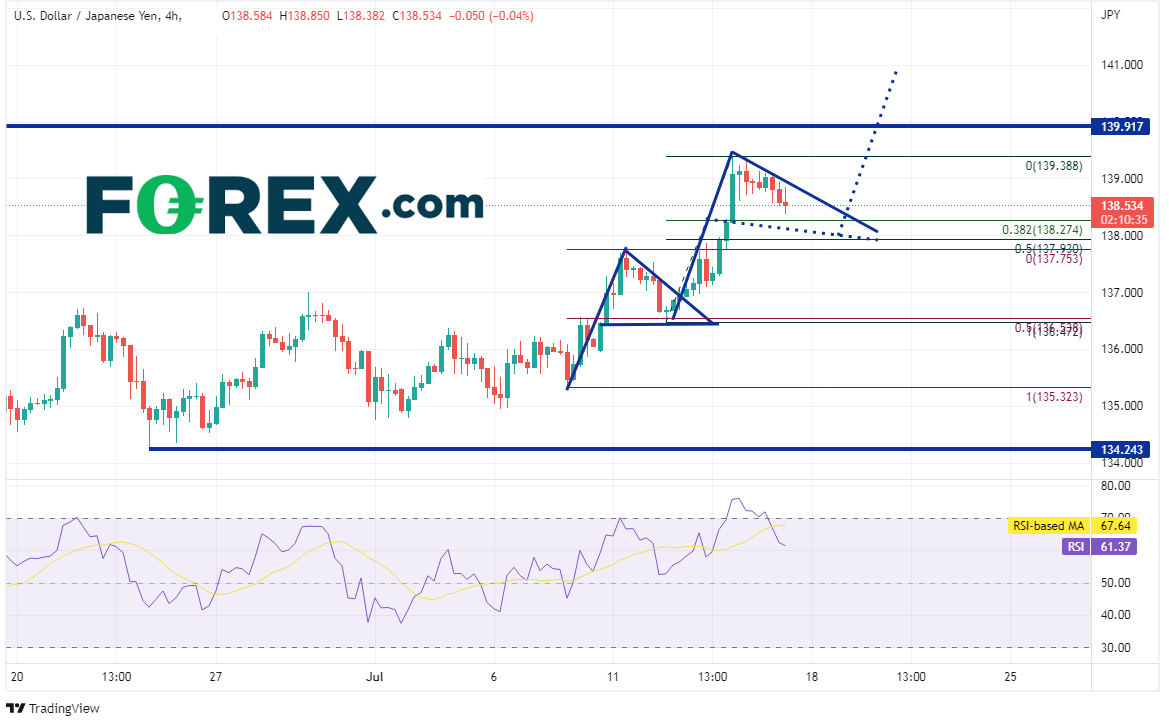
On a 240-minute timeframe USD/JPY made a high on July 11th at 137.75, before pulling back in a pennant formation to the 50% retracement level from the lows of July 7th to the highs of July 11th near 137.93. USD/JPY then broke out of the pennant and ran higher to the July 14th highs of 138.94. The pair is currently pulling back in what could be another pennant formation. Support below is at the 38.2% Fibonacci retracement level from the low of July 12th to the high of July 14th at 138.27. Just below there is the 50% retracement level form the same timeframe near 137.93 and then the highs from July 11th at 137.75. If price follows the same pattern as the previous pennant, price would bounce from the 50% retracement level. This would target near 141 on the breakout of the pennant. However, USD/JPY would have some work to do to get there. First resistance is at the top, downward sloping trendline of the pennant near 138.93. Above there, resistance is at the highs from July 14th at 139.39, then the September 1998 highs at 139.91.
Source: Tradingview, Stone X
“Never bet against the American consumer” is a phrase that has been thrown around the street, and June’s data shows why. But will it be enough to for the Fed to consider raising rates by 100bps at it July meeting in 2 weeks? Waller also mentioned the housing data would play a part in his decision. Watch the housing price index, existing house sales, and building permits next week for more guidance!
Fed member Christopher Waller said yesterday that despite a 40-year high CPI reading at 9.1% YoY, he still supports a 75bps rate hike at the upcoming FOMC in late July. However, he also noted that if June Retail Sales and housing data “come in materially stronger than expected, it would make me lean towards a larger hike.” June’s Retail Sales data released earlier today showed that the headline number rose by 1% MoM vs 0.8% MoM expected and a higher revised print for May to -0.1% MoM. In addition, the Ex-Autos print was also 1% MoM vs 0.6% MoM expected and a higher revised print for May to +0.1% MoM.
USD/JPY has been moving aggressively higher since breaking above 116.35 on March 11th. The pair moved to 131.33 on May 9th as it became apparent that higher US inflation data would lead the Fed to hike interest rates more aggressively. USD/JPY then pulled back in a descending wedge formation as the RSI diverged in overbought territory. On May 31st, USD/JPY broke out of the wedge and continued its move higher. On July 14th, the pair reached its highest level since September 1998 at 138.94. However, notice that the RSI is diverging with price in overbought territory once again. Does that mean price is ready for a correction once again ahead of the September 1998 highs at 139.91?

Source: Tradingview, Stone X
Trade USD/JPY now: Login or Open a new account!
• Open an account in the UK
• Open an account in Australia
• Open an account in Singapore
On a 240-minute timeframe USD/JPY made a high on July 11th at 137.75, before pulling back in a pennant formation to the 50% retracement level from the lows of July 7th to the highs of July 11th near 137.93. USD/JPY then broke out of the pennant and ran higher to the July 14th highs of 138.94. The pair is currently pulling back in what could be another pennant formation. Support below is at the 38.2% Fibonacci retracement level from the low of July 12th to the high of July 14th at 138.27. Just below there is the 50% retracement level form the same timeframe near 137.93 and then the highs from July 11th at 137.75. If price follows the same pattern as the previous pennant, price would bounce from the 50% retracement level. This would target near 141 on the breakout of the pennant. However, USD/JPY would have some work to do to get there. First resistance is at the top, downward sloping trendline of the pennant near 138.93. Above there, resistance is at the highs from July 14th at 139.39, then the September 1998 highs at 139.91.

Source: Tradingview, Stone X
“Never bet against the American consumer” is a phrase that has been thrown around the street, and June’s data shows why. But will it be enough to for the Fed to consider raising rates by 100bps at it July meeting in 2 weeks? Waller also mentioned the housing data would play a part in his decision. Watch the housing price index, existing house sales, and building permits next week for more guidance!
Learn more about forex trading opportunities.
Related tags:


Open an account in minutes
Experience award-winning platforms with fast and secure execution, and enjoy tight spreads from 0.5 pts on FX and 0.3 pts on indices.
Economic calendar
Web Trader platform
Our sophisticated web-based platform is packed with features.
Related articles

US Dollar Technical Outlook: DXY Bulls Meet Resistance at Yearly Highs 10 1 2026
The U.S. Dollar has held firm despite fading Fed hike bets, but Friday’s payrolls could test the rally’s staying power.


Dow Jones forecast: Stock markets under pressure from multiple sources
When looking at the major tech-heavy US indices like the S&P 500 or the Nasdaq 100, you wouldn’t think that the stock market is particularly weak. Yet, beneath the surface, the market is far from healthy right now. Investors are evidently just piling into the big tech and AI names, and as a result, market breadth is deteriorating. Other indices like the small cap Russell 2000 and the Dow Jones are starting to reflect that weakness.


Tankan Backs BOJ Tightening, but Yen Rate Expectations Ease
Japan’s Tankan supports further BOJ tightening, although softer rate expectations could limit support for the Japanese yen.

This report is intended for general circulation only. It should not be construed as a recommendation, or an offer (or solicitation of an offer) to buy or sell any financial products. The information provided does not take into account your specific investment objectives, financial situation or particular needs. Before you act on any recommendation that may be contained in this report, independent advice ought to be sought from a financial adviser regarding the suitability of the investment product, taking into account your specific investment objectives, financial situation or particular needs.
StoneX Financial Pte. Ltd., may distribute reports produced by its respective foreign entities or affiliates within the StoneX group of companies or third parties pursuant to an arrangement under Regulation 32C of the Financial Advisers Regulations. Where the report is distributed to a person in Singapore who is not an accredited investor, expert investor or an institutional investor (as defined in the Securities Futures Act), StoneX Financial Pte. Ltd. accepts legal responsibility to such persons for the contents of the report only to the extent required by law. Singapore recipients should contact StoneX Financial Pte. Ltd. at 6826 9988 for matters arising from, or in connection with the report.
In the case of all other recipients of this report, to the extent permitted by applicable laws and regulations neither StoneX Financial Pte. Ltd. nor its associated companies will be responsible or liable for any loss or damage incurred arising out of, or in connection with, any use of the information contained in this report and all such liability is hereby expressly disclaimed. No representation or warranty is made, express or implied, that the content of this report is complete or accurate.
StoneX Financial Pte. Ltd. is not under any obligation to update this report.
Trading CFDs carries a high level of risk that may not be suitable for some investors. Consider your investment objectives, level of experience, financial resources, risk appetite and other relevant circumstances carefully. The possibility exists that you could lose some or all of your investments, including your initial deposits. If in doubt, please seek independent expert advice. Visit www.forex.com/en-sg/terms-and-policies for the complete Risk Disclosure Statement.