



EUR/USD flashes reversal warning ahead of Bessent plan
EUR/USD flashes reversal signals after a powerful move higher, just as markets wait for Scott Bessent to provide more detail on how he plans to take pressure off the long end of the US curve.
Share this:

- US long end and risk appetite remain key drivers
- Bessent and Warsh headline an otherwise quiet week
- EUR/USD reversal risk builds after twin gravestone dojis
- EUR/JPY still favours buying dips for now
US long-end yields backed up late last week despite Treasury announcing larger buybacks of longer-dated bonds and Scott Bessent promising plans to consolidate the US fiscal trajectory. Yet rather than reigniting the dollar selloff, traders appear willing to give the Treasury Secretary the benefit of the doubt for now.
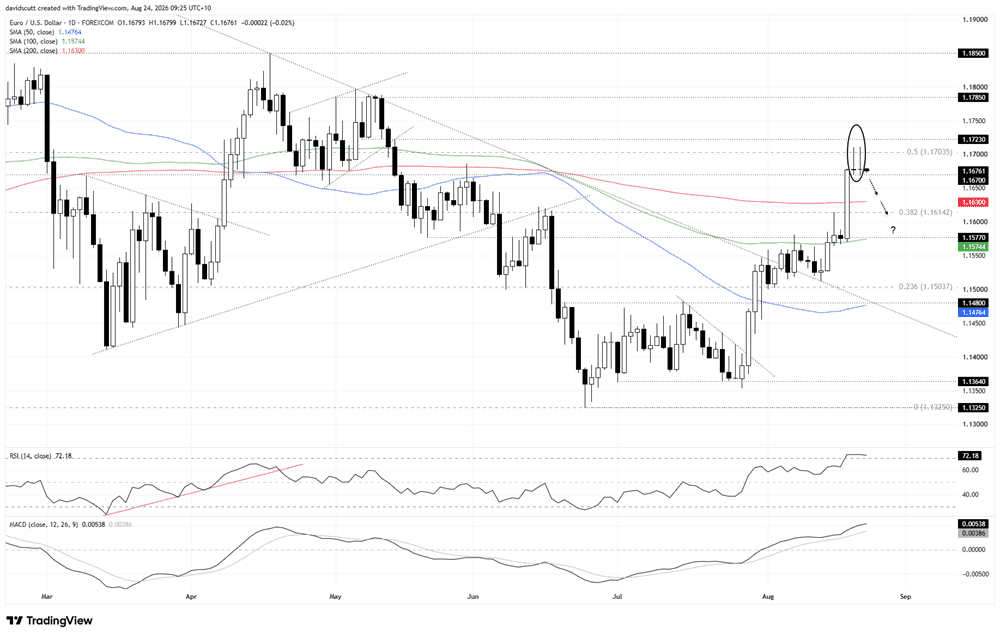
For EUR/USD, the pause has coincided with the first real signs of fatigue in the recent rally, with back-to-back gravestone dojis printing on the daily.
EUR/USD rate signal shifts
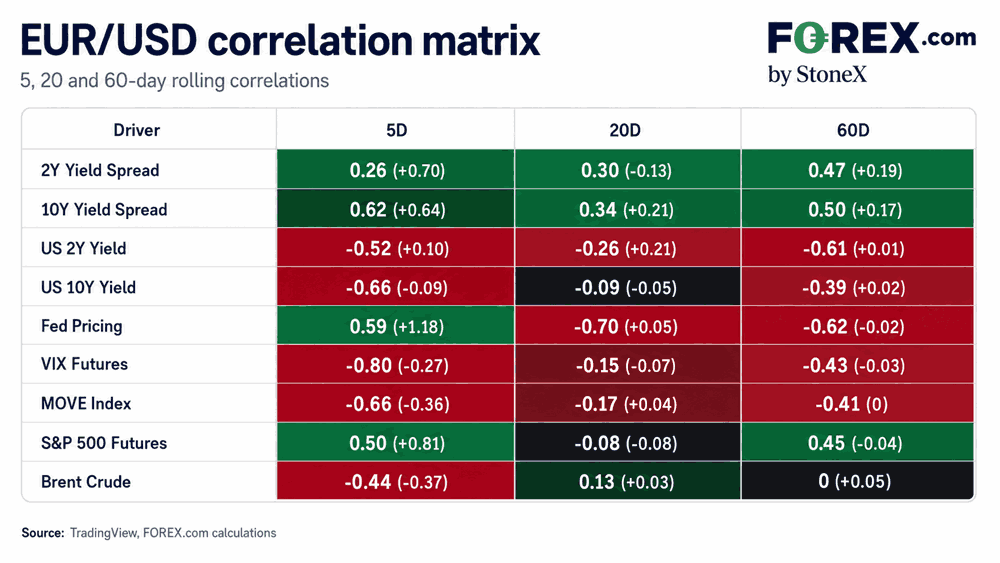
As seen in the correlation matrix below, rates remain the dominant macro influence on EUR/USD over both short and longer timeframes. But there were signs last week that the relationship shifted slightly.
Source: TradingView, FOREX.com
The strongest five-day relationship was with outright US 10-year yields at -0.66, stronger than the +0.62 correlation with the US-German 10-year spread. That suggests the move had more to do with the US curve than conventional monetary-policy divergence.
That view is reinforced by Fed pricing, which actually moved modestly in a more hawkish direction late last week. Yet EUR/USD still pushed higher. At the same time, its inverse relationships with VIX futures and the MOVE index strengthened sharply, while the positive relationship with S&P 500 futures also picked up.
While caution is needed interpreting the relationships given the short timeframe, it suggests EUR/USD may take its cue this week from the US long end and broader risk appetite, rather than the front end.
Bessent’s plan, Warsh’s problem
On that front, we’re expected to hear from US Treasury Secretary Scott Bessent in the coming days on how Treasury plans to consolidate the US fiscal trajectory, the latest in a growing list of measures aimed at taking pressure off the long end.
Kevin Warsh’s appearance at Jackson Hole on Friday also looms large, and is arguably the more intriguing of the two events given the situation he finds himself in.
Since taking over as Fed chair, Warsh has argued that markets should play a greater role in determining where broader financial conditions sit relative to the incoming data flow. That completely contradicts Treasury’s increasingly activist role in trying to stymie market forces.
The question is whether Warsh confronts the contradiction, goes along with Treasury’s approach, or ducks the issue altogether. The latter is a clear risk given how little insight he has, so far, provided on the Fed’s reaction function.
I covered both events in more detail in the USD/JPY week-ahead, which you can read here.
Outside the States, there’s little on either the European or Japanese calendars that screens as an obvious volatility catalyst. That leaves US bonds, broader risk appetite and geopolitics in focus.
Twin dojis flash a warning
Source: TradingView
Turning to the technical picture for EUR/USD, what stands out immediately is the pair of gravestone dojis printed late last week, warning that the bullish breakout from the longer-term bearish trend earlier this month may have run its course for now.
1.1670 is the immediate level underneath that I’m watching, given it has acted as both support and resistance at various points this year. A clean break beneath that level that sticks would open the door to shorts with a tight stop above for protection, targeting the 200-day moving average at 1.1630 and the 38.2% Fib retracement of the January-to-June bear move at 1.1614.
However, just because reversal signals have printed does not mean a reversal will actually take place. The oscillators remain bullish, with RSI (14) still trending higher despite flattening in mildly overbought territory. MACD continues to trend higher in positive territory above the signal line.
That leaves price action and momentum sending conflicting signals, making the near-term reaction around 1.1670 particularly important. If the level continues to hold and bids emerge, bulls are likely to initially target just above 1.1700, where the pair stalled twice late last week. Beyond that, 1.1723, which acted as support for a period earlier this year, and 1.1785, which capped the pair for a couple of weeks in May, are the next levels to watch.
EUR/JPY favours bullish bias
Source: TradingView
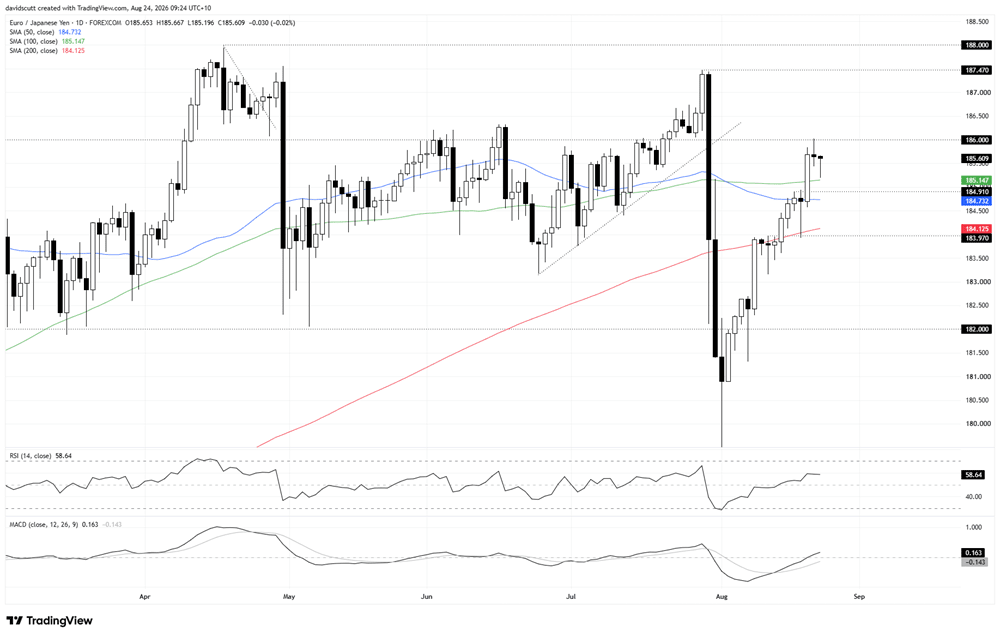
As is the case for EUR/USD, EUR/JPY has enjoyed a strong recovery in August following the yen intervention episode in late July, recovering the vast majority of the initial move.
However, a doji printed on Friday after the pair was rejected at 186.00 resistance, forming the first two legs of a potential evening star. Coming after such a pronounced bullish move, follow-through selling today would complete the reversal pattern and strengthen the case for downside.
For now, though, the oscillators remain bullish. RSI (14) continues to trend higher and sits above 50 at 59, while MACD has staged a bullish crossover and flipped positive. That keeps buying dips as the preferred bias for now.
At this point, the pair is sitting in no man’s land and I’m waiting to see how today’s price action evolves. For potential long entries, the 100-day moving average is the first level of note, given the price has often respected it over periods this year, with 184.91 another minor level located just beneath, which capped the pair prior to the breakout seen in the latter parts of last week.
If the evening star completes, though, that would question the merits of buying the dip and bring the 200-day moving average at 184.12 into focus. The level has already acted as both support and resistance this month, making the price action around it important if selling were to accelerate.
Above 186.00, a break that holds would have bulls eyeing off 187.47, the high struck before the intervention episode, with 188.00 another potential target.
Latest market news




Open an account in minutes
Experience award-winning platforms with fast and secure execution, and enjoy tight spreads from 0.5 pts on FX and 0.3 pts on indices.
Economic calendar
Web Trader platform
Our sophisticated web-based platform is packed with features.
Related articles
AUD/USD and AUD/JPY Tease Swing Highs Heading into Jobs Report
AUD/USD and AUD/JPY show signs of potential swing highs as bearish reversal candles emerge ahead of Australia's employment report.
Canadian Dollar Short-term Outlook: USD/CAD Five-Week Rally Hits a Wall at Major Resistance 10 14 2026
USD/CAD is holding near fresh yearly highs, but bearish divergence and a well-defined October range raise the stakes at major resistance.

EUR/USD Analysis: Euro Loses Ground After a Stronger-Than-Expected U.S. CPI Report
The trading week continues to unfold and weakness around the euro has once again become increasingly evident in the short term. This can be seen in the recent performance of EUR/USD, which has declined roughly 0.3% over the last three trading sessions, highlighting renewed strength in the U.S. dollar.

This report is intended for general circulation only. It should not be construed as a recommendation, or an offer (or solicitation of an offer) to buy or sell any financial products. The information provided does not take into account your specific investment objectives, financial situation or particular needs. Before you act on any recommendation that may be contained in this report, independent advice ought to be sought from a financial adviser regarding the suitability of the investment product, taking into account your specific investment objectives, financial situation or particular needs.
StoneX Financial Pte. Ltd., may distribute reports produced by its respective foreign entities or affiliates within the StoneX group of companies or third parties pursuant to an arrangement under Regulation 32C of the Financial Advisers Regulations. Where the report is distributed to a person in Singapore who is not an accredited investor, expert investor or an institutional investor (as defined in the Securities Futures Act), StoneX Financial Pte. Ltd. accepts legal responsibility to such persons for the contents of the report only to the extent required by law. Singapore recipients should contact StoneX Financial Pte. Ltd. at 6826 9988 for matters arising from, or in connection with the report.
In the case of all other recipients of this report, to the extent permitted by applicable laws and regulations neither StoneX Financial Pte. Ltd. nor its associated companies will be responsible or liable for any loss or damage incurred arising out of, or in connection with, any use of the information contained in this report and all such liability is hereby expressly disclaimed. No representation or warranty is made, express or implied, that the content of this report is complete or accurate.
StoneX Financial Pte. Ltd. is not under any obligation to update this report.
Trading CFDs carries a high level of risk that may not be suitable for some investors. Consider your investment objectives, level of experience, financial resources, risk appetite and other relevant circumstances carefully. The possibility exists that you could lose some or all of your investments, including your initial deposits. If in doubt, please seek independent expert advice. Visit www.forex.com/en-sg/terms-and-policies for the complete Risk Disclosure Statement.