



EUR/USD, GBP/USD Outlook: Same Sunday TACO, Same Monday Reaction
Another barrage of positive headlines from the Middle East has lifted the euro and sterling while sending energy prices sharply lower. But is Brent crude now influencing the behaviour of both sides rather than simply reflecting the conflict?
Share this:

- Ceasefire headlines trigger familiar Monday playbook
- Brent may now influence escalation risks
- Light calendar on Monday leaves geopolitics in control
- Charts suggest rallies remain opportunities to sell
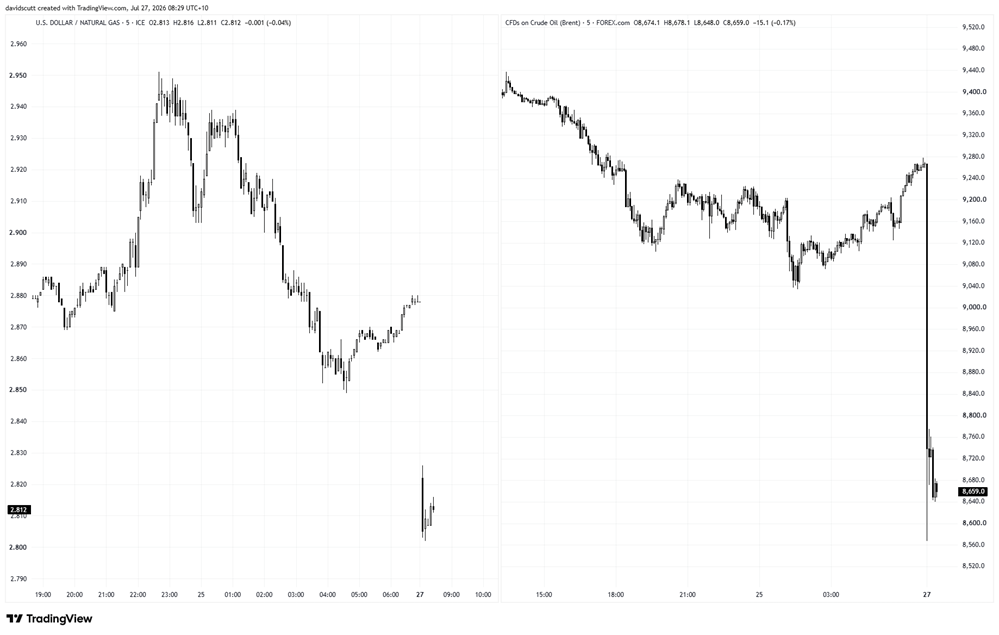
Donald Trump has delivered another Sunday TACO, triggering a familiar market reaction as Globex reopened for the week. Energy futures that spiked last week tumbled in early Asian trade, while equity futures jumped and the euro and British pound strengthened against the US dollar. Whether those moves extend into the European session will largely depend on the news flow from the Middle East. As this conflict has repeatedly shown, sentiment can turn very quickly.
Another Sunday TACO
Almost inevitably, we're back here again early on Monday morning in Asia with a risk-on tone, sparked by another barrage of positive headlines out of the Middle East. After spending the weekend worrying about a major escalation, traders have once again been handed a de-escalation headline just before Globex reopened, amplifying the initial reaction in extremely illiquid conditions.
Zooming out to 40,000 feet, it seems Brent crude may no longer be just a barometer of geopolitical risk. Repeated moves below $70 a barrel during the conflict have been followed by renewed escalation. Conversely, the latest de-escalation arrived with Brent trading above $100 a barrel, a level that risks fuelling inflation and lifting gasoline prices at a politically awkward time for Trump ahead of November's midterm elections.
It's entirely speculative on my behalf, but both sides appear to have developed an implicit reaction function around Brent since the conflict began. Prices below $70 a barrel seem to invite renewed escalation, while moves above $100 have so far been met with efforts to de-escalate.
Europe Wins, For Now
Source: TradingView
The latest headlines have provided Europe an immediate release valve. Natural gas and Brent crude, shown on the left and right respectively above, have fallen sharply, drowning out renewed trade concerns after Trump threatened additional tariffs on Europe in response to the EU's antitrust fine against Alphabet. Whether those moves last will depend almost entirely on where the news flow heads next.
EUR/USD: Downtrend Still Intact
Source: TradingView
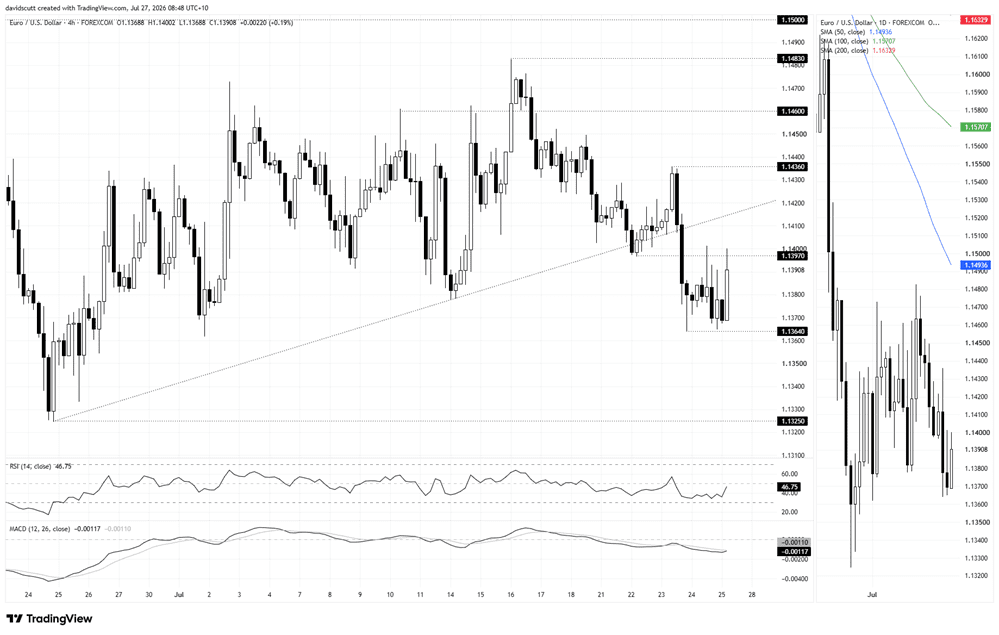
Despite the pop higher on the ceasefire headlines, the EUR/USD H4 chart suggests this remains a sell-on-rallies play for now, with the string of lower highs and lower lows in place since the middle of July still intact.
The price remains trapped within a well-defined range between 1.1364 and 1.1397. Bulls have already failed twice to break above the upper end of that structure, including earlier today when EUR/USD briefly pushed through 1.1400 before retreating. That leaves a clear range to work with.
The oscillators suggest downside momentum is ebbing but has yet to trigger an outright bullish signal. RSI (14) has lifted but remains below the neutral 50 level, while MACD is on the cusp of a bullish crossover despite remaining in negative territory, placing greater emphasis on price action around the range extremes.
Should buyers finally break above 1.1397 and hold there, attention shifts to the former uptrend from the June 24 low, which comes in around 1.1415 today, followed by the July 7 swing high at 1.1436. On the downside, a break beneath 1.1364 would expose the June 24 swing low at 1.1325, with little meaningful technical support in between.
As long as the positive news flow from the Middle East continues, there may be scope for further upside. But the broader technical picture still favours selling rallies. The daily chart shows EUR/USD remains below its 50, 100 and 200-day moving averages, all of which continue to slope lower, suggesting the medium-term downtrend remains intact.
GBP/USD: Breakout Fading
Source: TradingView
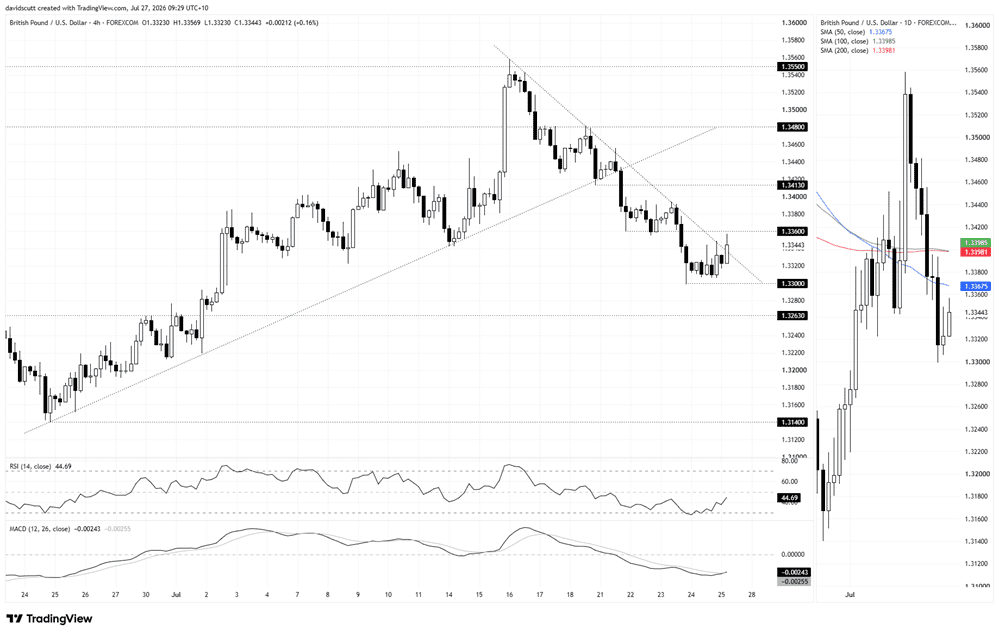
GBP/USD looks much the same as EUR/USD on the H4 timeframe. The pair is attempting to break the downtrend that's been in place since the middle of July, although it's already given back a sizeable chunk of the gains seen earlier in the session.
The daily chart, shown in the right-hand pane, suggests rallies should still be treated with caution. The 50-day moving average is found at 1.3368, but it's the 100 and 200-day moving averages around 1.3400 that are of greater interest. The pair stalled beneath those levels last week, making them an important resistance zone should the current bounce extend.
On the H4 chart, support emerged around 1.3300 late last week, while 1.3360 is the first level overhead to watch, having acted as support earlier in the month. Outside of that range, 1.3263 is the next level of note on the downside, while 1.3400 and 1.3413 provide additional resistance above.
The oscillators suggest downside momentum is ebbing but has yet to trigger an outright bullish signal. RSI (14) continues to climb towards the neutral 50 level, while MACD has crossed above its signal line but remains below zero, placing greater emphasis on price action around these key technical levels.
Latest market news



Open an account in minutes
Experience award-winning platforms with fast and secure execution, and enjoy tight spreads from 0.5 pts on FX and 0.3 pts on indices.
Economic calendar
Web Trader platform
Our sophisticated web-based platform is packed with features.
Related articles
S&P 500, Nasdaq, Dow Forecast: Wall Street Split Widens Into Month-End 9 26 2026
Nasdaq strength contrasts with mounting Dow pressure as rising Treasury yields raise the stakes for stocks heading into the monthly close.
EUR/USD weekly outlook: Oil, inflation and NFP in focus
After coming under significant pressure in recent weeks, the EUR/USD came off its lows to finish the week on a positive note on Friday, albeit with only a mild rebound. That was not enough to prevent the exchange rate falling for the third consecutive week, as the US dollar and bond yields rallied across the board.


EUR/USD Q4 2026 Outlook: Euro at a Crossroads as Fed, ECB Tighten 9 25 2026
EUR/USD enters Q4 at a pivotal inflection point as competing Fed-ECB policy paths and persistent inflation risks collide with major technical support.
This report is intended for general circulation only. It should not be construed as a recommendation, or an offer (or solicitation of an offer) to buy or sell any financial products. The information provided does not take into account your specific investment objectives, financial situation or particular needs. Before you act on any recommendation that may be contained in this report, independent advice ought to be sought from a financial adviser regarding the suitability of the investment product, taking into account your specific investment objectives, financial situation or particular needs.
StoneX Financial Pte. Ltd., may distribute reports produced by its respective foreign entities or affiliates within the StoneX group of companies or third parties pursuant to an arrangement under Regulation 32C of the Financial Advisers Regulations. Where the report is distributed to a person in Singapore who is not an accredited investor, expert investor or an institutional investor (as defined in the Securities Futures Act), StoneX Financial Pte. Ltd. accepts legal responsibility to such persons for the contents of the report only to the extent required by law. Singapore recipients should contact StoneX Financial Pte. Ltd. at 6826 9988 for matters arising from, or in connection with the report.
In the case of all other recipients of this report, to the extent permitted by applicable laws and regulations neither StoneX Financial Pte. Ltd. nor its associated companies will be responsible or liable for any loss or damage incurred arising out of, or in connection with, any use of the information contained in this report and all such liability is hereby expressly disclaimed. No representation or warranty is made, express or implied, that the content of this report is complete or accurate.
StoneX Financial Pte. Ltd. is not under any obligation to update this report.
Trading CFDs carries a high level of risk that may not be suitable for some investors. Consider your investment objectives, level of experience, financial resources, risk appetite and other relevant circumstances carefully. The possibility exists that you could lose some or all of your investments, including your initial deposits. If in doubt, please seek independent expert advice. Visit www.forex.com/en-sg/terms-and-policies for the complete Risk Disclosure Statement.