



EUR/USD Remains the Key for FX Market Trends
USD is once again bristling at a breakout at a major level, but perhaps the bigger question as to whether that can take is whether EUR/USD bears can punch through this major psychological level.
Share this:

The US Dollar is threatening to break out yet again and the 100.22 level is the price standing in the way. This was the low last year when the Fed started cutting rates, and then became the high in August when DXY reversed on the release of Non-farm Payrolls. More recently, however, that same level held the highs two weeks ago and is back in-play today following a clean bounce from the 98.98 level. Bulls have an open door to make a push here, but perhaps the bigger question is whether EUR/USD can break below it’s own very key level that remains in-play.
It was just two weeks ago when the US Dollar was continuing the rate cut rally that sparked from the Fed’s first move of moderation in September. While the announcement of that rate cut brought a fresh three-year low into DXY, Jerome Powell framing it as a ‘risk management rate cut’ helped to drive a short-term reversal, that soon found more buyers as a push of higher-highs and lows developed into the end of Q3.
US Dollar Daily Chart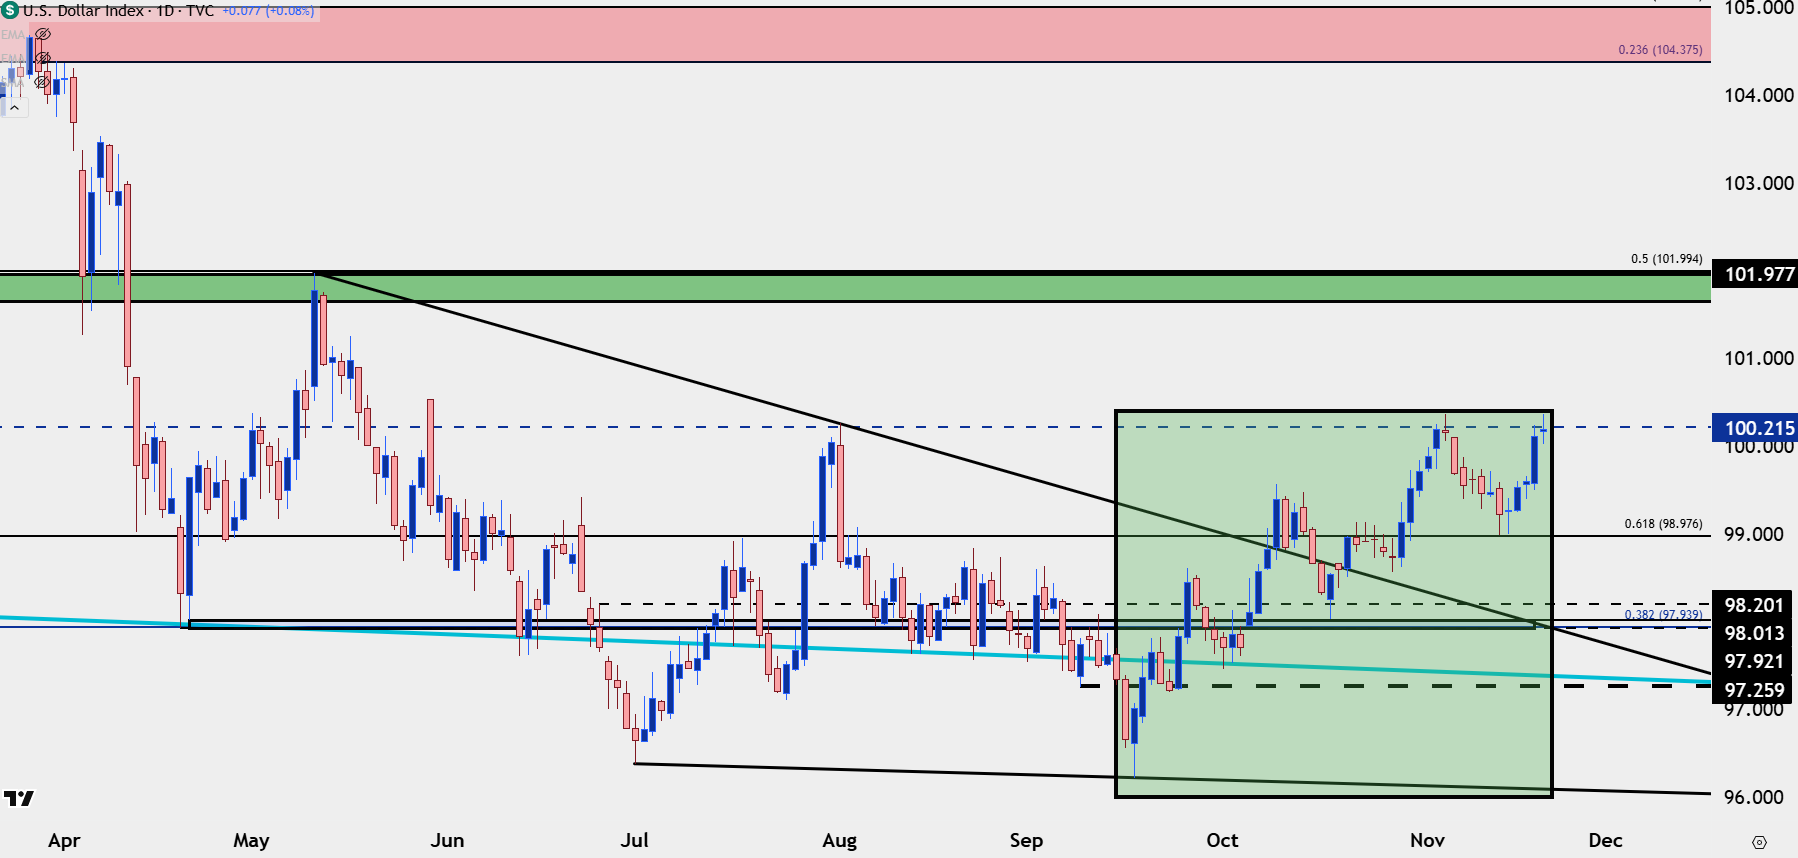
Chart prepared by James Stanley; data derived from Tradingview
This isn’t that unusual, however, as this was a clear case of ‘sell the rumor, buy the news,’ and it was only a year ago that something similar happened. DXY was pummeled for most of Q3 last year, only to bottom at the rate cut announcement, which then led to a strong bullish reversal in Q4. From the side of counterparts, the Euro, which is a whopping 57.6% of the DXY quote, had stalled at the 1.1200 handle as DXY was bottoming around that announcement, and the pair dropped more than 1,000 pips until finally finding some support two weeks into 2025 trade.
That support just happened to show at a big spot – the 23.6% Fibonacci retracement of the 2021-2022 major move. And as USD eased in the month of February, helped along by fears of recession driven by the uncertainty around tariffs, both markets broke in March and furthered the move in April. This lasted all the way until around the Easter holiday, when EUR/USD ran into a massive level that finally stalled the advance: The 1.1500 psychological level.
EUR/USD Daily Price Chart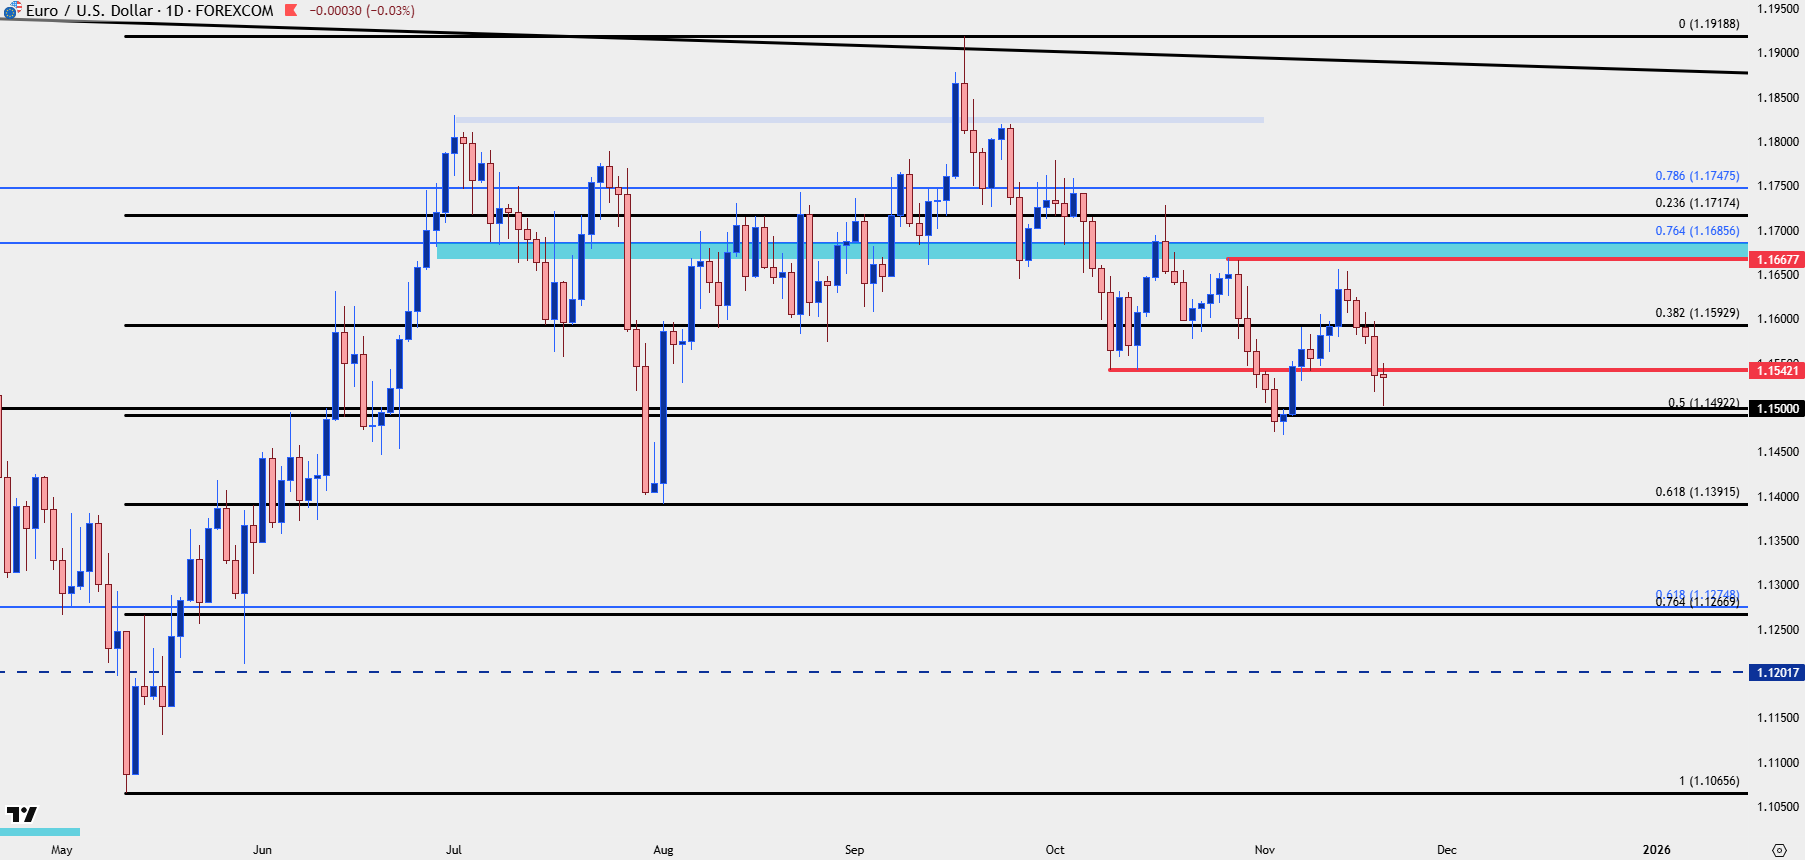
Chart prepared by James Stanley; data derived from Tradingview
There was a lot going on around that April date: Stocks had just set a significant low after SPX went oversold on the weekly chart for only the third time since the Financial Collapse. USD/JPY also set a significant low at the 140.00 handle, right around the same time that EUR/USD put in a test of the 1.1500 handle, which failed to take.
The first push above 1.1500 happened on Easter, in which European markets are closed for holiday even as US markets are open. But when Europe came back to work on Tuesday EUR/USD was slammed below the 1.1500 handle as a retracement developed.
It took a few weeks and more bearish-USD push to make that 1.1500 break happen which ultimately took place in June; and once it did, getting back below the big figure has proven to be a similar challenge.
We had a test below in late-July after the FOMC meeting, but both EUR/USD and USD reversed at the Non-farm Payrolls release. And then two weeks ago, 1.1500 was back in the headlines, and as I warned in the webinar, chasing that move could produce challenges given proximity to the big figure.
From the weekly chart below, we can see where that price has carried a significant role in the way that EUR/USD price action has built.
EUR/USD Weekly Chart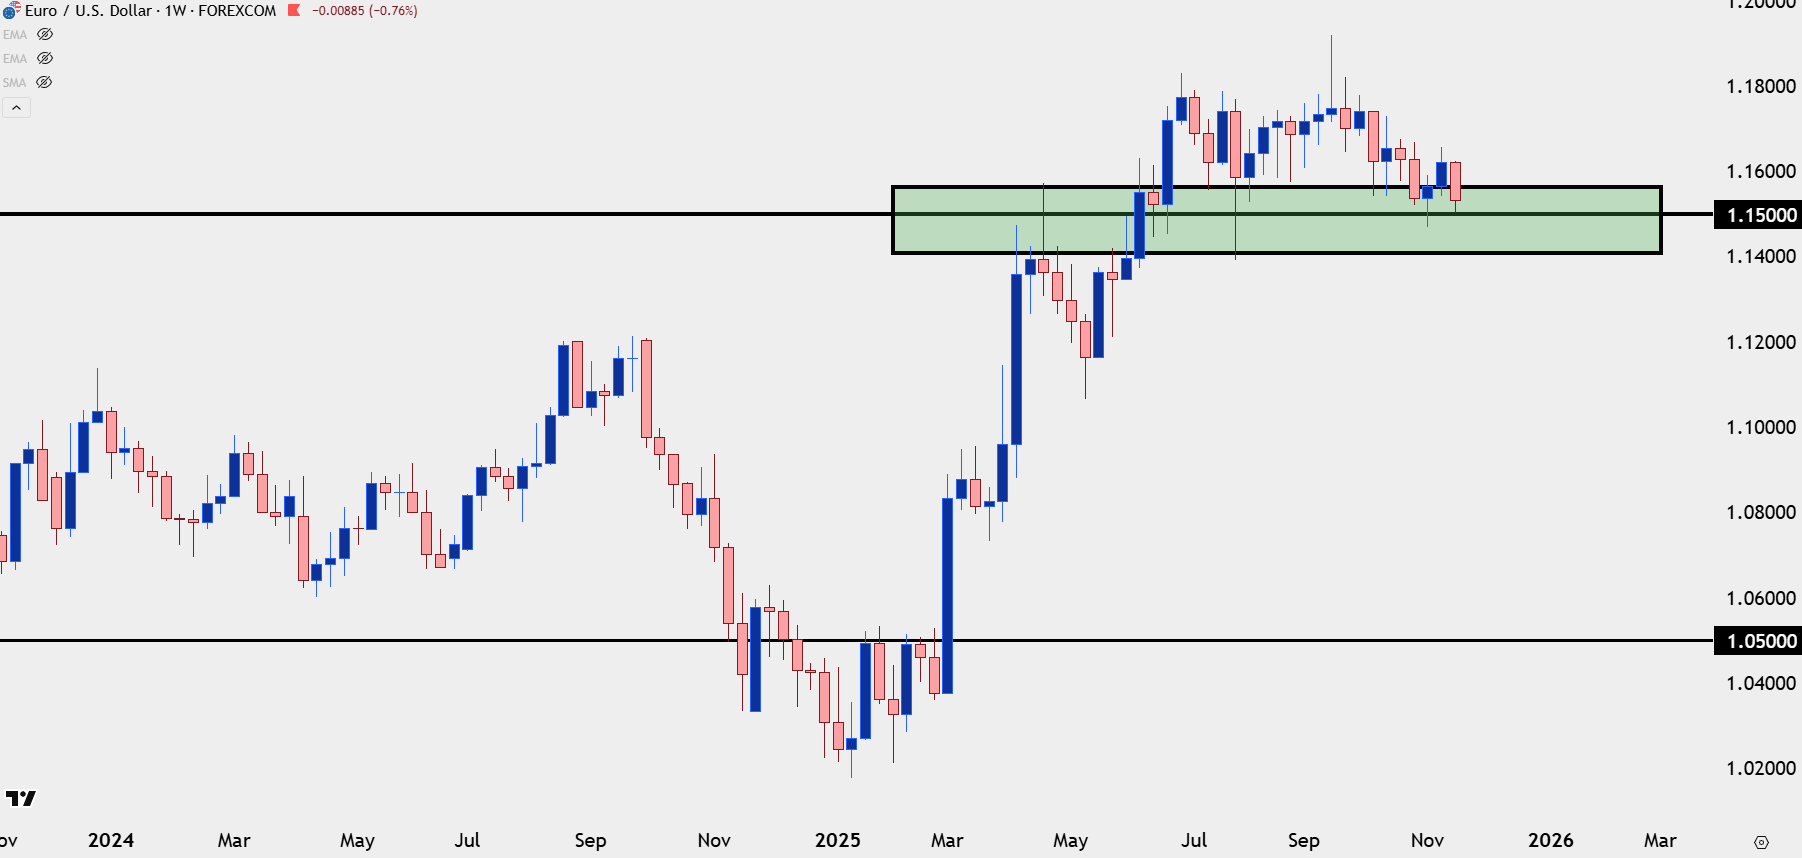
Chart prepared by James Stanley; data derived from Tradingview
And then taking a further step back, we can even go back to the two-plus year range from 2015 to 2017 to see how that level has continually functioned as a sticking point. To be sure, it’s not a brick wall, and there have been breaches. There just hasn’t been many clean breaks without at least some testing or stalling at that price before trends were able to continue.
EUR/USD Monthly Chart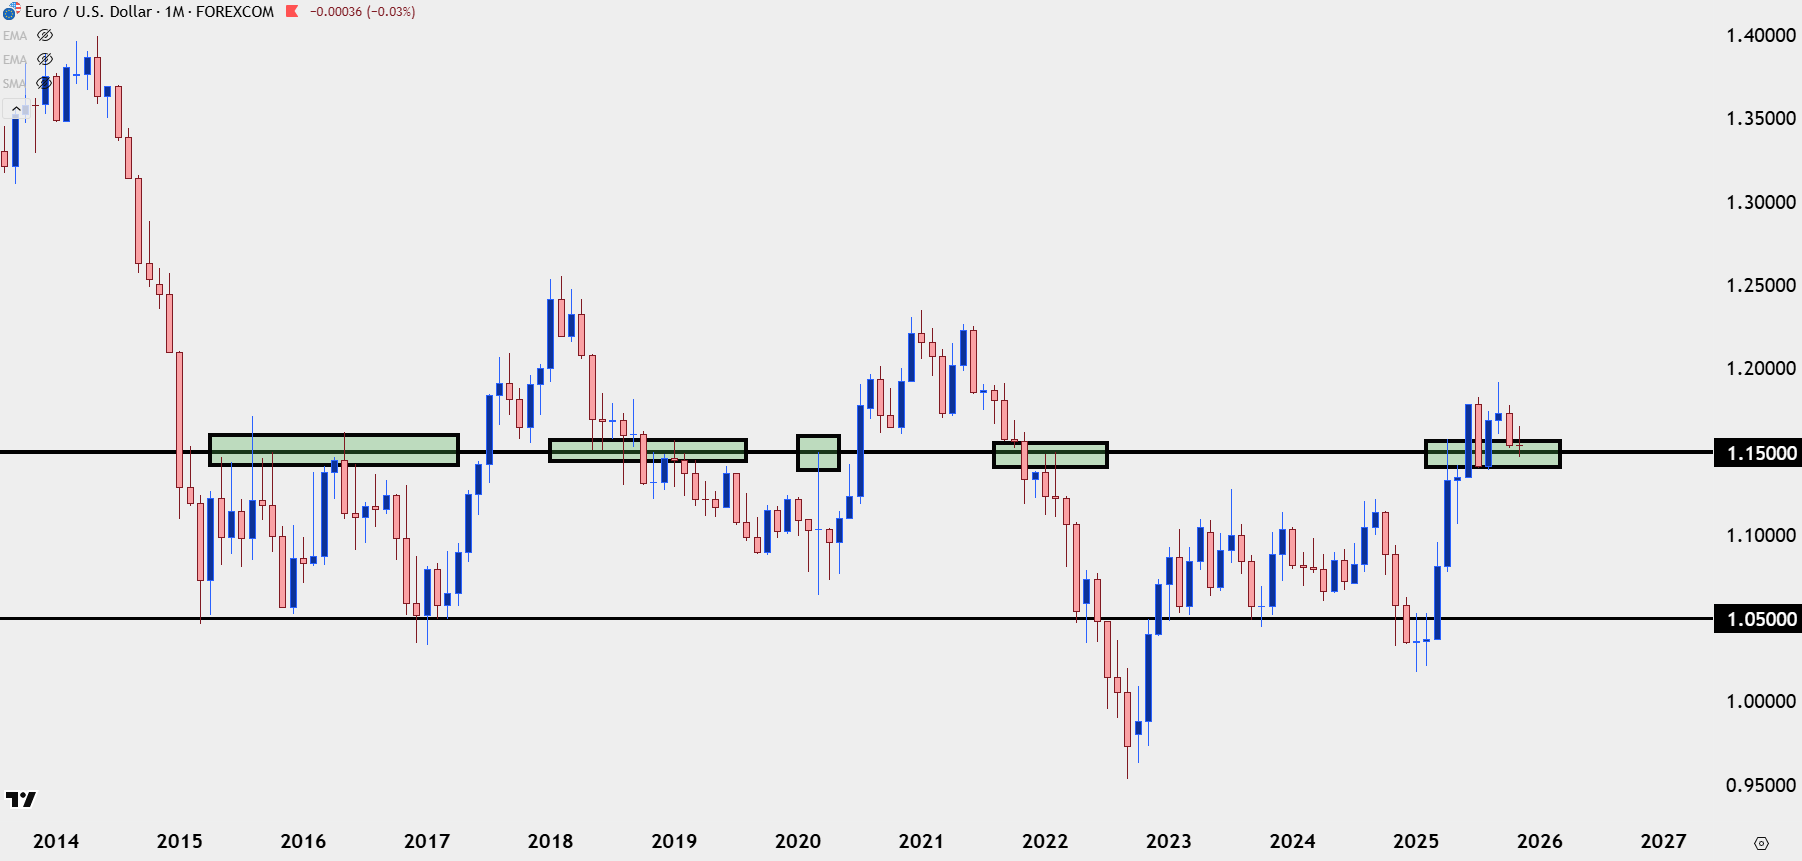
Chart prepared by James Stanley; data derived from Tradingview

EUR/USD Near-Term Strategy
At this point there’s remaining bearish structure to work with on the daily chart and this puts emphasis on a couple of familiar levels. The 1.1542 level is already in-play for today as resistance as this was a prior double bottom formation that later came in as a higher low. Above that, we have the 1.1593-1.1600 zone; and then from the daily, the prior lower-high was at 1.1668 which I’ve synced up to 1.1686 as an ‘r3’ zone of resistance.
If bulls can pose a break above ‘r3’ then the bearish thesis in EUR/USD will have to come into question, going along with the bullish thesis in DXY/USD.
EUR/USD Four-Hour Chart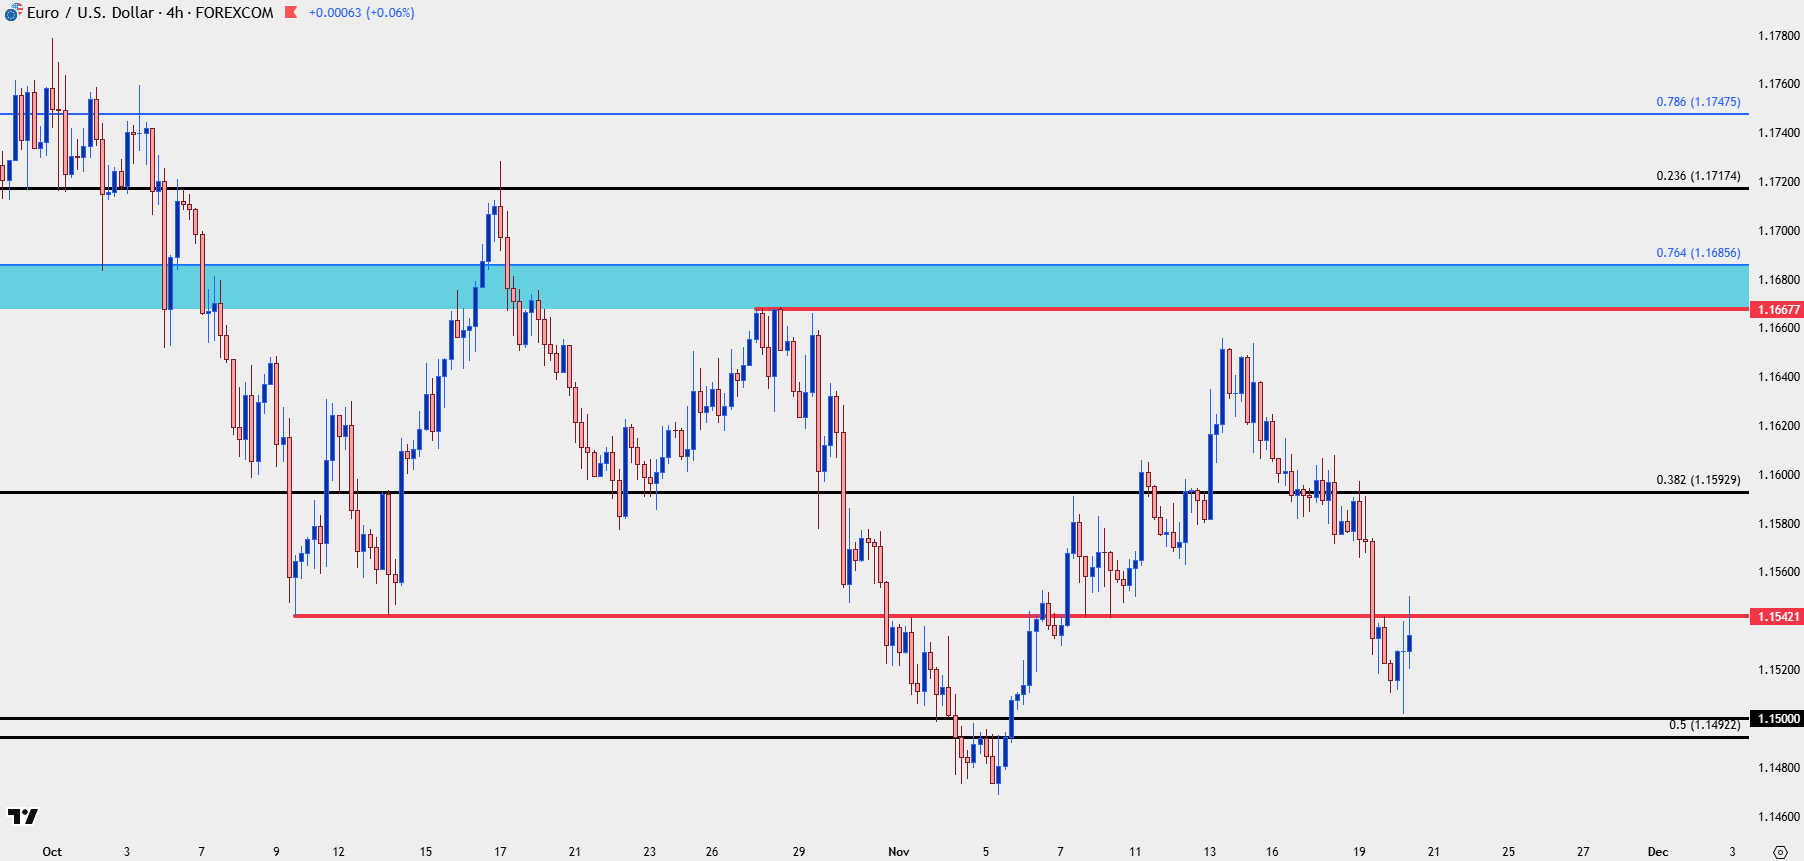
Chart prepared by James Stanley; data derived from Tradingview
--- written by James Stanley, Senior Market Analyst, Global Macro
Related tags:



Open an account in minutes
Experience award-winning platforms with fast and secure execution, and enjoy tight spreads from 0.5 pts on FX and 0.3 pts on indices.
Economic calendar
Web Trader platform
Our sophisticated web-based platform is packed with features.
Related articles

USD/MXN Analysis: Is Super Peso Starting to Fade?
Over recent trading sessions, the Mexican peso has continued to show signs of weakness against the U.S. dollar. This can already be seen in USD/MXN, which has gained more than 1.7% over the last three sessions, highlighting sustained buying pressure in favor of the dollar in the short term.


Nasdaq 100 Forecast: NDX slips as Treasury yields keep rising
U.S. stocks are falling at the start of Q4, as gains in software stocks offset concerns over soaring Treasury yields. U.S. Treasury yields continue to rise, with the 10-year yield up 2 basis points at 5.31% and the 30-year at 5.66%, multi-decade highs.


US Dollar Technical Outlook: DXY Bulls Meet Resistance at Yearly Highs 10 1 2026
The U.S. Dollar has held firm despite fading Fed hike bets, but Friday’s payrolls could test the rally’s staying power.

This report is intended for general circulation only. It should not be construed as a recommendation, or an offer (or solicitation of an offer) to buy or sell any financial products. The information provided does not take into account your specific investment objectives, financial situation or particular needs. Before you act on any recommendation that may be contained in this report, independent advice ought to be sought from a financial adviser regarding the suitability of the investment product, taking into account your specific investment objectives, financial situation or particular needs.
StoneX Financial Pte. Ltd., may distribute reports produced by its respective foreign entities or affiliates within the StoneX group of companies or third parties pursuant to an arrangement under Regulation 32C of the Financial Advisers Regulations. Where the report is distributed to a person in Singapore who is not an accredited investor, expert investor or an institutional investor (as defined in the Securities Futures Act), StoneX Financial Pte. Ltd. accepts legal responsibility to such persons for the contents of the report only to the extent required by law. Singapore recipients should contact StoneX Financial Pte. Ltd. at 6826 9988 for matters arising from, or in connection with the report.
In the case of all other recipients of this report, to the extent permitted by applicable laws and regulations neither StoneX Financial Pte. Ltd. nor its associated companies will be responsible or liable for any loss or damage incurred arising out of, or in connection with, any use of the information contained in this report and all such liability is hereby expressly disclaimed. No representation or warranty is made, express or implied, that the content of this report is complete or accurate.
StoneX Financial Pte. Ltd. is not under any obligation to update this report.
Trading CFDs carries a high level of risk that may not be suitable for some investors. Consider your investment objectives, level of experience, financial resources, risk appetite and other relevant circumstances carefully. The possibility exists that you could lose some or all of your investments, including your initial deposits. If in doubt, please seek independent expert advice. Visit www.forex.com/en-sg/terms-and-policies for the complete Risk Disclosure Statement.