



EUR/USD Sell-Off Stalls – What’s Next?
EUR/USD was tumbling from April through June but more recently, sellers have been stalled. Are they just waiting for the next push or are they completely stepping back from the trend?
Share this:

EUR/USD Talking Points:
- After showing strength in early 2026 trade EUR/USD bears took over in May and early-June.
- The sell-off has since slowed although buyers have yet to make much ground above 1.1469, begging the question as to whether a short squeeze and pullback could bring on bigger picture trend continuation potential.
After a strong rally a year ago as markets were getting ready for FOMC rate cuts, EUR/USD has so far spent much of this year grinding, although there has been some short-term trend to work with. In early 2026 trade buyers were making a move, eventually setting a fresh four-year-high in the pair.
But as the Iran conflict took over so too did the fear of European energy vulnerability, and the Euro was hit hard in March to test below the 1.1500 level. A bounce in April was faded in May and June – but so far in July, that move has been stalled and price has been sitting around the 1.1400 handle, begging the question as to which trend will take over next.

EUR/USD Monthly Chart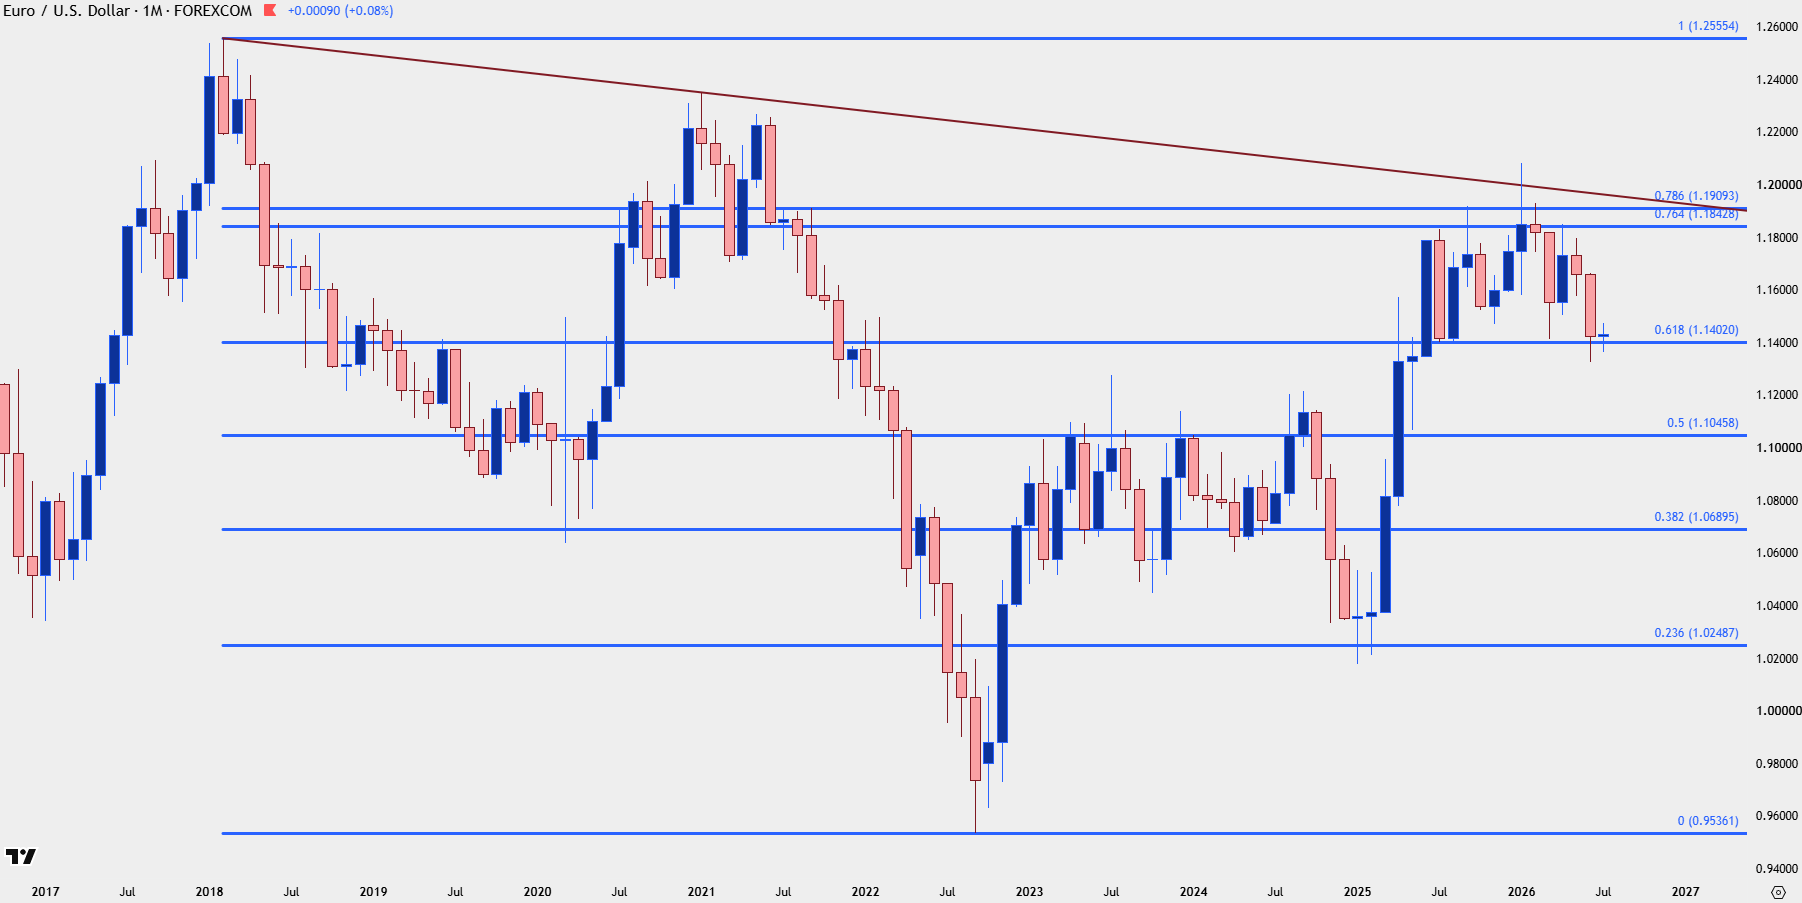
Chart prepared by James Stanley; data derived from Tradingview
EUR/USD Next Steps
A sell-off stalling can be read as either an impending reversal or a pause in trend. At this point, at least from a relative since with gold and Bitcoin rallying as GBP/USD showing greater strength, I think the bias indicates more of a pause than an impending reversal.
But – with that said, it’s the reaction to a rally and pullback that will illustrate which option is favorable moving forward. I covered this in yesterday’s webinar, as we can still make the claim of lower-lows in the pair from both weekly and monthly charts. But from the daily below we can see where that’s been somewhat messy, although there’s an important message contained in these candles. Sellers have so far responded to pullbacks, holding resistance around 1.1450. But, they’ve also swung less and less weight, illustrated by the higher-lows that have built over the past few weeks.
This indicates an oversold market and one that’s difficult to push for trend-side continuation at this point. It also highlights the possibility of a short-term bullish breakout, which could open the door for bigger picture trend continuation if sellers make a move on follow-through resistance. The 1.1500 area is an ideal spot to look for that to play above current highs, and then there’s a zone of prior support spanning from 1.1576 up to 1.1613 above that that’s of interest.
EUR/USD Daily Chart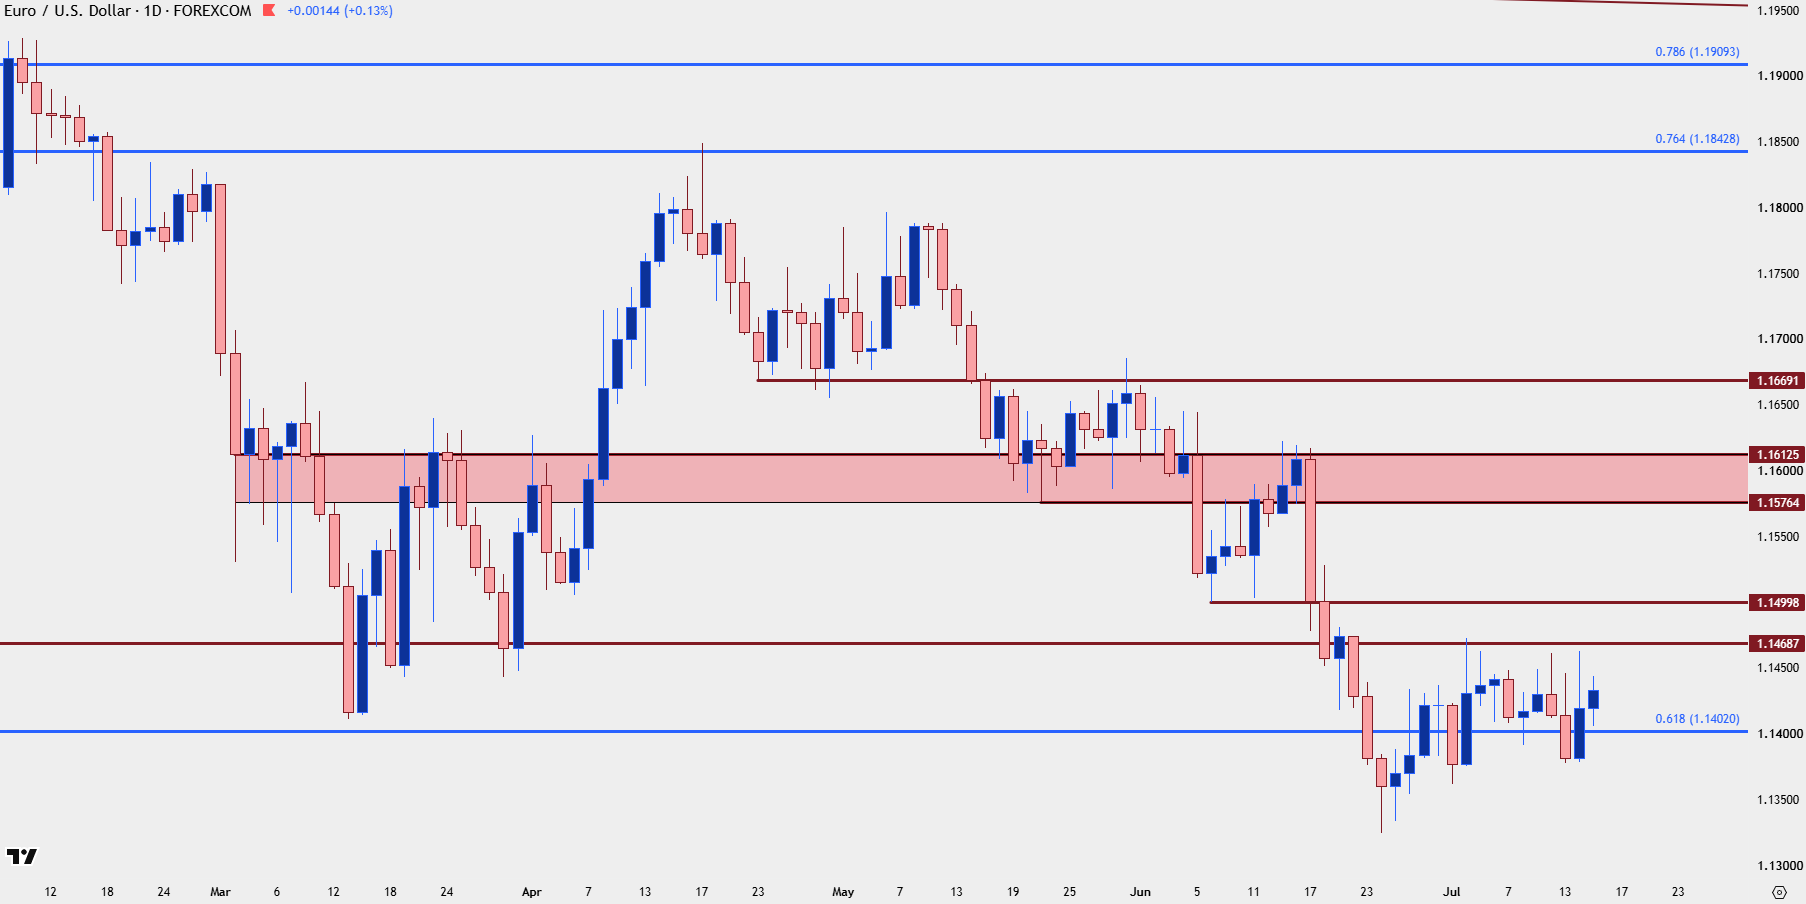
Chart prepared by James Stanley; data derived from Tradingview
EUR/USD: How to Position For Reversal
From the above two charts we can see the bearish case fairly well illustrated by the lower-lows and highs that have shown in the pair. While many retail traders will try to trade reversals at the early stage, the fact of the matter is that until bulls show greater demand the forces of trend should be considered as bearish.
For trend traders, this means that they often will not get every pip of every move, and that’s somewhat of the point, as they’re instead trying to focus on probabilities and in this case, the more cogent way of going about the matter would be waiting for price to break above the lower-highs that have so far held, around the 1.1450 area, and then waiting for bulls to stretch up to deeper resistance, whether at 1.1500 or the zone above.
And then the corresponding reaction to that, can then be sought as a higher-low for those looking for the reversal theme. That way, if strength does not pan out, they can, at the least, abandon the trade upon a break to fresh lows.
At this point, we’re just not there yet from the daily chart so until that is the case, I’m looking at rallies in EUR/USD as short-term counter-trend setups.
EUR/USD Four-Hour Chart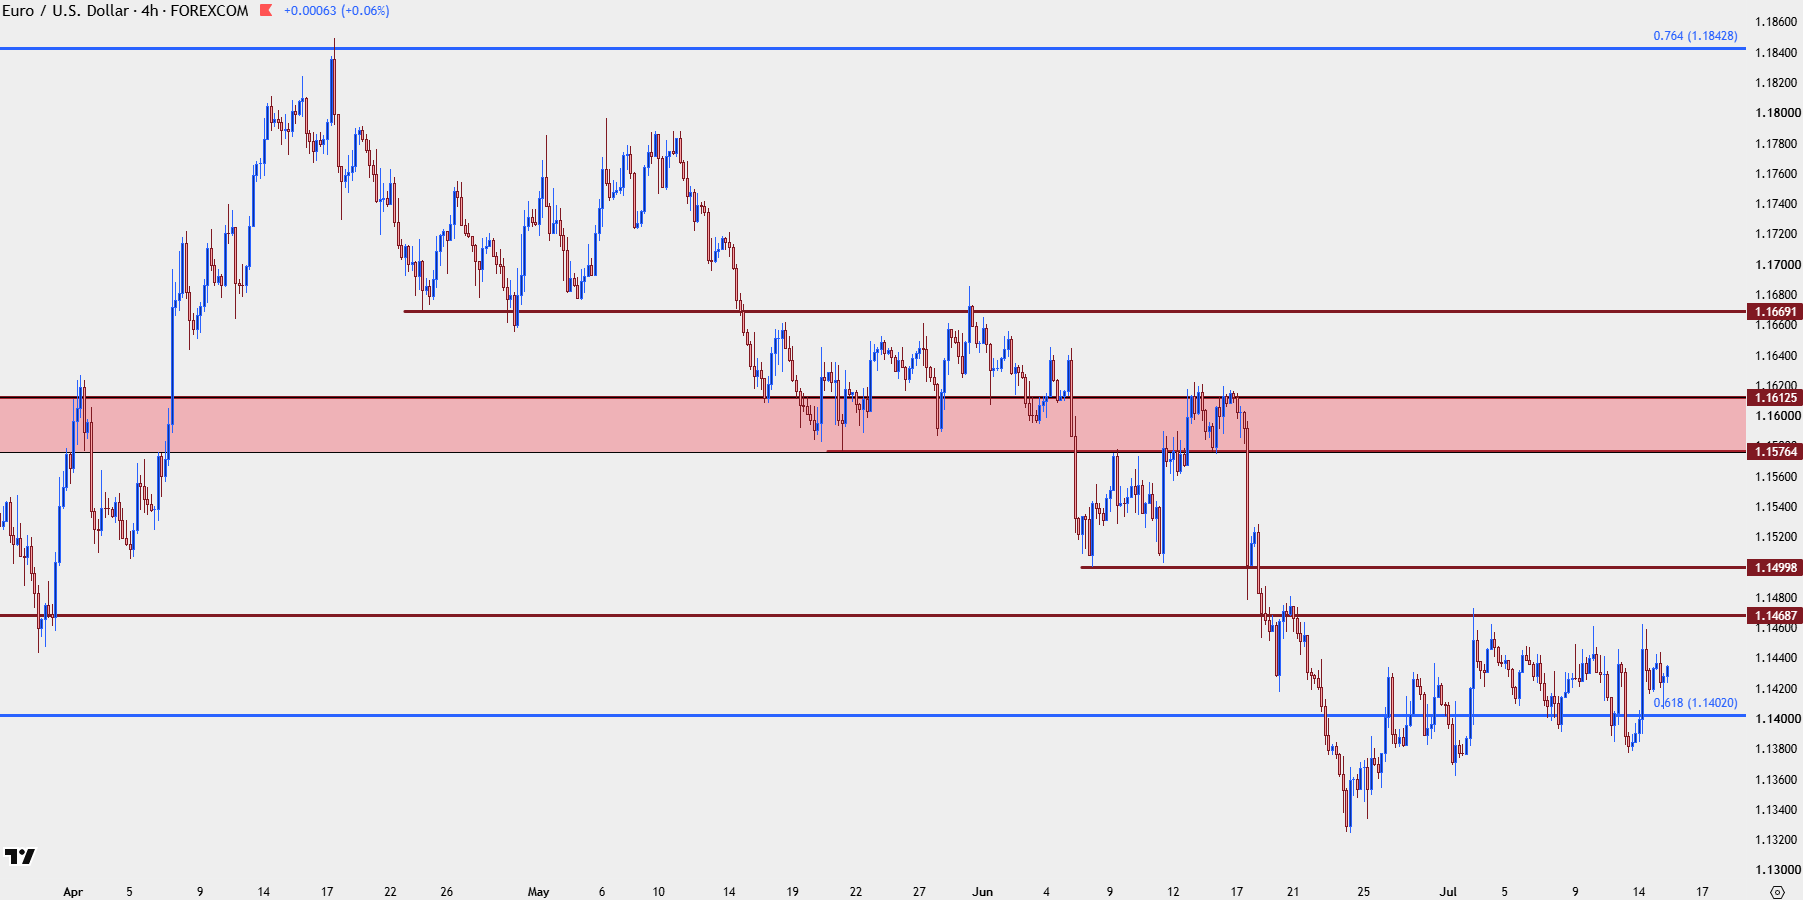
Chart prepared by James Stanley; data derived from Tradingview
--- written by James Stanley, Senior Market Analyst, Global Macro
Related tags:
Latest market news




Open an account in minutes
Experience award-winning platforms with fast and secure execution, and enjoy tight spreads from 0.5 pts on FX and 0.3 pts on indices.
Economic calendar
Web Trader platform
Our sophisticated web-based platform is packed with features.
Related articles
Gold Hammered After CPI, Tests Below $4100
Gold prices came into the day with a bullish backdrop but that has dimmed after the CPI release earlier on the day.
EUR/USD Analysis: Euro Loses Ground After a Stronger-Than-Expected U.S. CPI Report
The trading week continues to unfold and weakness around the euro has once again become increasingly evident in the short term. This can be seen in the recent performance of EUR/USD, which has declined roughly 0.3% over the last three trading sessions, highlighting renewed strength in the U.S. dollar.
Stocks on Watch After CPI-Fueled Breakdown: SPX, Nasdaq, NVDA
Coming into the week there was an early case of divergence as AI and tech had started to show lag behind the S&P. That shift is growing more noticeable following a higher-than-expected CPI print.
This report is intended for general circulation only. It should not be construed as a recommendation, or an offer (or solicitation of an offer) to buy or sell any financial products. The information provided does not take into account your specific investment objectives, financial situation or particular needs. Before you act on any recommendation that may be contained in this report, independent advice ought to be sought from a financial adviser regarding the suitability of the investment product, taking into account your specific investment objectives, financial situation or particular needs.
StoneX Financial Pte. Ltd., may distribute reports produced by its respective foreign entities or affiliates within the StoneX group of companies or third parties pursuant to an arrangement under Regulation 32C of the Financial Advisers Regulations. Where the report is distributed to a person in Singapore who is not an accredited investor, expert investor or an institutional investor (as defined in the Securities Futures Act), StoneX Financial Pte. Ltd. accepts legal responsibility to such persons for the contents of the report only to the extent required by law. Singapore recipients should contact StoneX Financial Pte. Ltd. at 6826 9988 for matters arising from, or in connection with the report.
In the case of all other recipients of this report, to the extent permitted by applicable laws and regulations neither StoneX Financial Pte. Ltd. nor its associated companies will be responsible or liable for any loss or damage incurred arising out of, or in connection with, any use of the information contained in this report and all such liability is hereby expressly disclaimed. No representation or warranty is made, express or implied, that the content of this report is complete or accurate.
StoneX Financial Pte. Ltd. is not under any obligation to update this report.
Trading CFDs carries a high level of risk that may not be suitable for some investors. Consider your investment objectives, level of experience, financial resources, risk appetite and other relevant circumstances carefully. The possibility exists that you could lose some or all of your investments, including your initial deposits. If in doubt, please seek independent expert advice. Visit www.forex.com/en-sg/terms-and-policies for the complete Risk Disclosure Statement.