



EUR/USD, Oil outlook: Two trades to watch
EUR/USD falls ahead of Eurozone inflation data. Oil rises as hawkish Fed bets ease, the House pass the debt ceiling bill & China data beats.
Share this:

EUR/USD falls ahead of Eurozone inflation data
- EZ inflation set to cool to 6.3% YoY
- ECB meeting minutes are also due
- EUR/USD needs to break 1.0635 for further losses
EUR/USD is falling for a second straight day ahead of the eurozone inflation and US jobs data and as the US debt bill passes through the House of Representatives.
Eurozone inflation is expected to cool to 6.3% YoY in May, down from 7% in April. The data comes after inflation in France, Germany, and Spain cooled by more than expected, easing pressure on the ECB to raise interest rates aggressively.
However, core inflation is still proving to be sticky and is expected to ease to 5. 5%, down from 5.6%. Hotter-than-expected inflation figures would force the ECB to continue raising interest rates to tame inflation.
The market is currently pricing in two 25-basis-point rate hikes. The minutes to the latest ECB meeting are also due to be released and could shed more light on the future path for interest rates. ECB President Christine Lagarde was hawkish in the post-meeting press conference, confirming that the central bank wasn’t finished hiking rates. Hawkish minutes could also boost the euro.
In addition to inflation data, investors are digesting weaker-than-expected German retail sales, which rose 0.8% after falling -2.4% in April. Expectations had been for a rise of a 1% rise.
Eurozone manufacturing PMI data is expected to confirm the preliminary reading of 46.9, a deeper contraction in May than the 47.8 in April.
Meanwhile, the USD is rising as the debt ceiling bill passes its first test in the House of Representatives and makes its way to the Senate for a vote there. The bill needs to be agreed upon before the 5th June.
US ADP payrolls, jobless claims, and ISM manufacturing data are due and could influence the greenback.
EUR/USD outlook – technical analysis
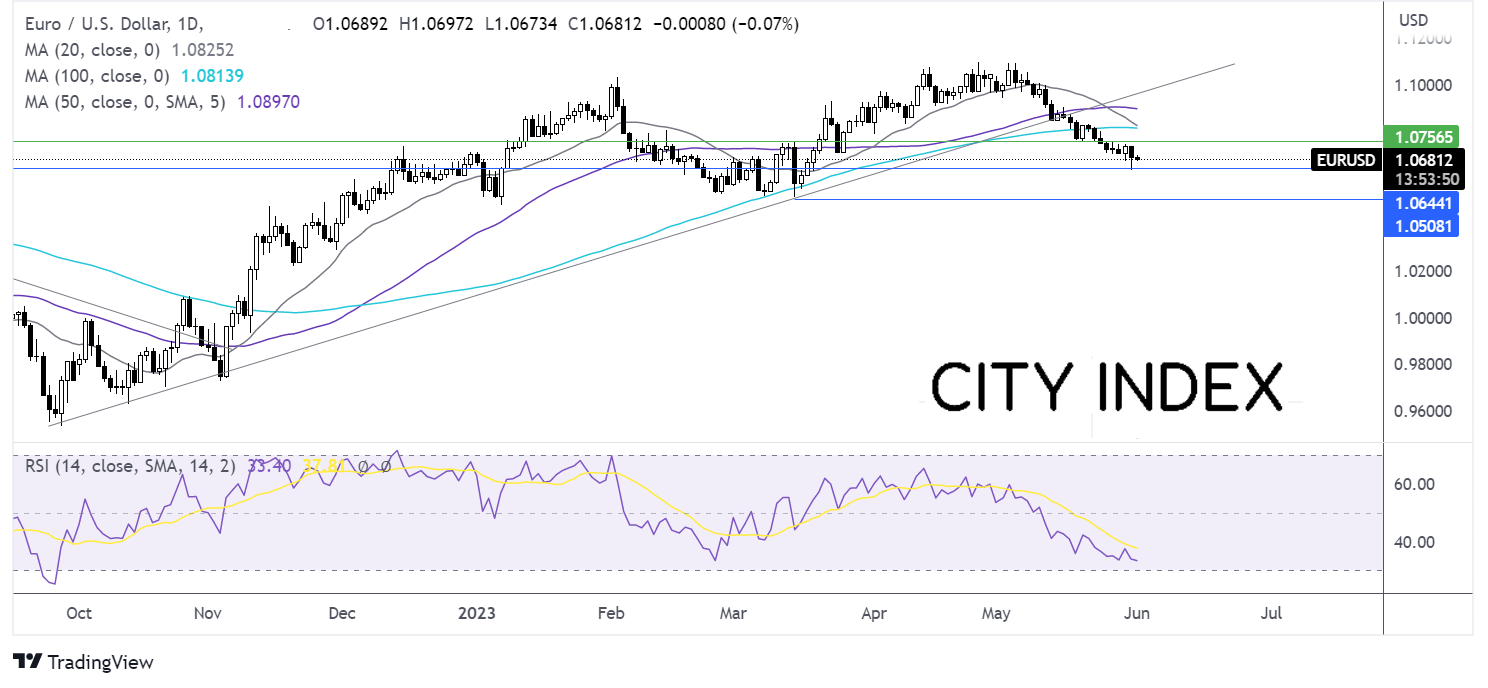
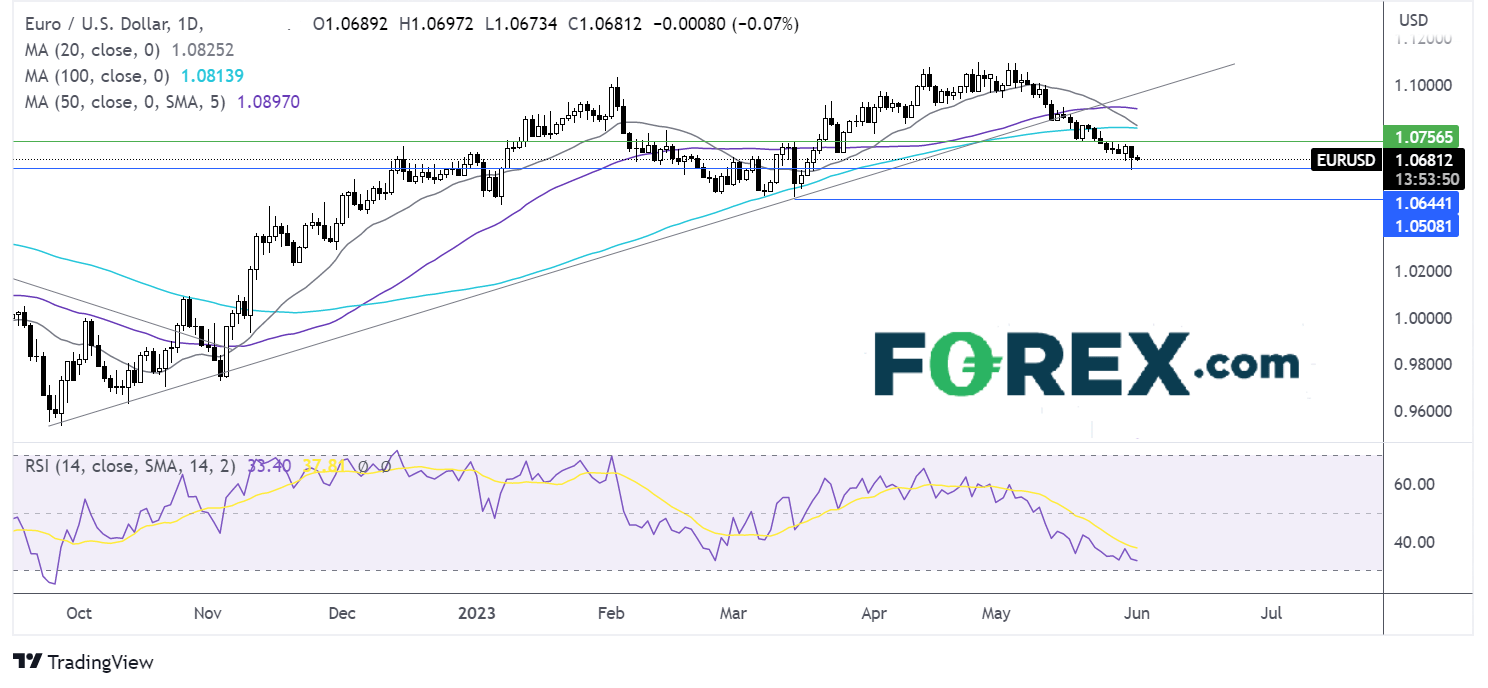
EUR/USD has been trending lower across May, taking out the multi-month rising trendline and, more recently, support at 1.0750. The 20 sma crossed below the 100 sma and looks to be crossing below the 50 sma in a bearish signal, while the RSI below 50 supports further downside.
The price found support at 1.0635, which is the level the sellers need to take out to create a lower low and extend the sell-off to 1.06 round number, before bringing 1.0516, the March low, into play.
Buyers could be encouraged by the long lower wick on yesterday’s candle, pointing to dip buying at the lower price. Buyers will look for a rise above 1.0750 to extend gains to the 100 sma at 1.0815.
Oil rises as hawkish Fed bets ease, the House pass the debt ceiling bill & after China data
- Fed speakers hint at a pause in rate hikes
- China paints a mixed picture
- API inventories rise
Oil prices are pushing higher after three straight days of losses as investors cheers a potential pause in US interest rate hikes and as the debt ceiling bill passes a key vote in Congress.
The US House of Representatives passed the debt ceiling bill, improving the chances of the US avoiding an economically disastrous debt default. The bill is now passed to the Democrat-controlled Senate to be voted on and approved before the 5th June X-date.
With the debt bill on track, investors are back Fed watching. Several Fed speakers yesterday hinted at a pause in rate hikes in June. These comments helped to ease fears of an overtightening and a recession in the US, which would hurt the oil demand outlook.
Meanwhile, Chinese Caixin manufacturing PMI was better than expected, rising to 50.9 in May, up from 49.5 in April. The data showing a return to expansion came following the official gauge yesterday, which showed a deeper contraction. The data for the world’s largest oil importer has painted a mixed picture.
Meanwhile, on the supply side, API data showed that crude oil inventories rose by 5.2 million barrels last week, which could keep the lid on oil’s upside. EIA data is due later today.
Attention is also turning to the OPEC+ meeting at the weekend. Members have been sending mixed signals. Goldman Sachs have said that they don’t expect further cuts to be announced.
Oil outlook – technical analysis
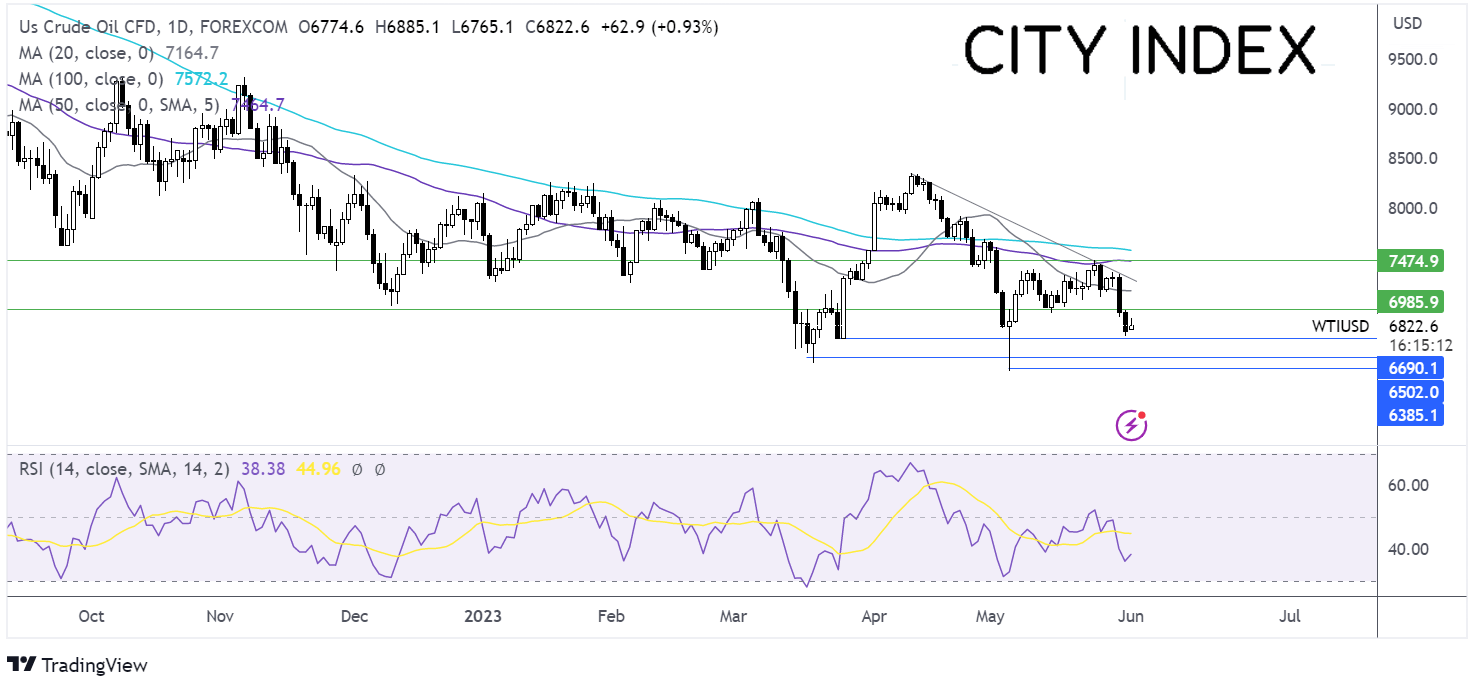
Oil has been forming a series of lower highs since early April. After running into the falling trendline resistance at 73.35, the price rebounded lower.
Oil fell aggressively below the 20 sma and 70.00 psychological level, which, together with the RSI below 50, supports further downside.
Sellers will look to take out 67.00, the weekly low, to bring 65.35 into focus, the March low, ahead of 63.60, the May low.
On the flip side, a rise above 70.00 exposes the 20 sma at 71.70 and 73.20, the falling trendline resistance.

Related tags:



Open an account in minutes
Experience award-winning platforms with fast and secure execution, and enjoy tight spreads from 0.5 pts on FX and 0.3 pts on indices.
Economic calendar
Web Trader platform
Our sophisticated web-based platform is packed with features.
Related articles
USD/CAD shooting star puts September surge on notice
USD/CAD has printed a clear bearish reversal pattern after an extraordinary September surge, but confirmation may depend heavily on how US Treasury yields react to Friday’s payrolls report.

USD/CHF Reverses as Swiss Franc Surges amid Bond Carnage
USD/CHF reverses from channel resistance as bond volatility surges and broad Swiss franc strength points to a possible carry-trade unwind.


US Dollar Technical Outlook: DXY Bulls Meet Resistance at Yearly Highs 10 1 2026
The U.S. Dollar has held firm despite fading Fed hike bets, but Friday’s payrolls could test the rally’s staying power.

This report is intended for general circulation only. It should not be construed as a recommendation, or an offer (or solicitation of an offer) to buy or sell any financial products. The information provided does not take into account your specific investment objectives, financial situation or particular needs. Before you act on any recommendation that may be contained in this report, independent advice ought to be sought from a financial adviser regarding the suitability of the investment product, taking into account your specific investment objectives, financial situation or particular needs.
StoneX Financial Pte. Ltd., may distribute reports produced by its respective foreign entities or affiliates within the StoneX group of companies or third parties pursuant to an arrangement under Regulation 32C of the Financial Advisers Regulations. Where the report is distributed to a person in Singapore who is not an accredited investor, expert investor or an institutional investor (as defined in the Securities Futures Act), StoneX Financial Pte. Ltd. accepts legal responsibility to such persons for the contents of the report only to the extent required by law. Singapore recipients should contact StoneX Financial Pte. Ltd. at 6826 9988 for matters arising from, or in connection with the report.
In the case of all other recipients of this report, to the extent permitted by applicable laws and regulations neither StoneX Financial Pte. Ltd. nor its associated companies will be responsible or liable for any loss or damage incurred arising out of, or in connection with, any use of the information contained in this report and all such liability is hereby expressly disclaimed. No representation or warranty is made, express or implied, that the content of this report is complete or accurate.
StoneX Financial Pte. Ltd. is not under any obligation to update this report.
Trading CFDs carries a high level of risk that may not be suitable for some investors. Consider your investment objectives, level of experience, financial resources, risk appetite and other relevant circumstances carefully. The possibility exists that you could lose some or all of your investments, including your initial deposits. If in doubt, please seek independent expert advice. Visit www.forex.com/en-sg/terms-and-policies for the complete Risk Disclosure Statement.