



EUR/USD, Oil: Two Trades to Watch
EUR/USD looks to eurozone & US inflation data. Oil flat after Chinese PMI data & ahead of US inflation figures.
Share this:

EUR/USD looks to eurozone & US inflation
- Eurozone inflation is expected to cool to 5.1% YoY
- US core PCE is expected to tick higher to 4.2%
- EUR/USD tests 100 sma resistance
EUR/USD is holding above 1.09 after reaching a two-week high in the previous session. Today, the pair is edging lower after weaker-than-expected German retail sales and ahead of inflation data from both the US and the eurozone.
German retail sales unexpectedly fell -0.8% MoM in July after falling -0.8% in June. However, this was below the 0.3% rise forecast in a sign that households remain squeezed amid high inflation (6.1%) and rising interest rates.
Attention is now turning to eurozone inflation data, which could provide further clues over whether the ECB will pause its rate hiking cycle in September. ECB President Christine Lagarde said at Jackson Hole that a pause could be appropriate at the next meeting.
Recent data, such as August PMI figures and GDP for the region, has pointed to a slowing economy, which takes the pressure off the ECB to hike aggressively.
Headline inflation is expected to cool to 5.1% YoY from 5.3%, and core inflation is expected to cool to 5.3% YoY from 5.5%.
The data comes after German inflation ticked lower and Spanish inflation ticked higher, highlighting the problem that the ECB has.
In addition to Eurozone inflation, ECB minutes to the July meeting will be released and could shed some light on the level at which policymakers see peak rates.
The USD will also be looking towards inflation data for clues over the Fed’s next steps. US core PCE, the Fed’s preferred measure for inflation, is expected to tick higher to 4.2% after steadily falling since February.
Hotter than expected core PCE would support the view that the Fed could raise interest rates further. According to the CME FedWatch tool, the market is pricing in just a 19% probability of a rate hike in September and a 43% probability that rates will be higher by November.
EUR/USD forecast – technical analysis
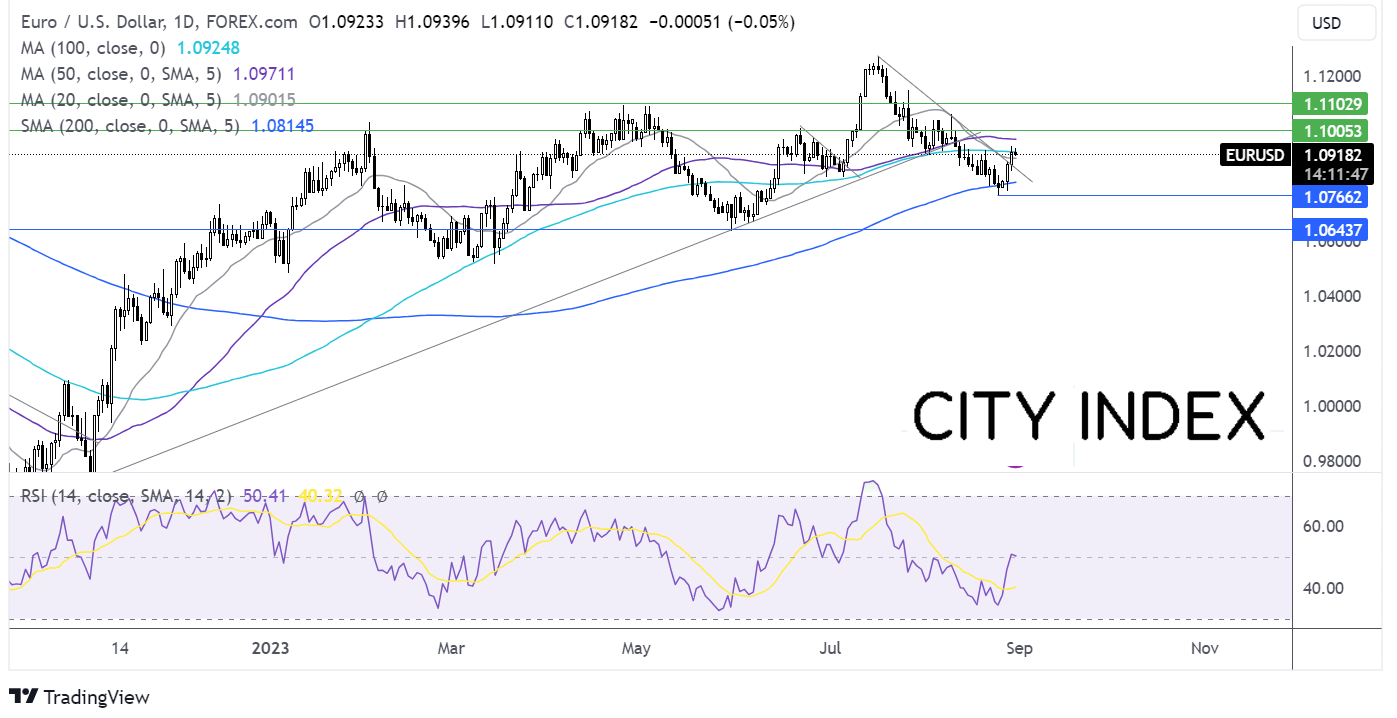
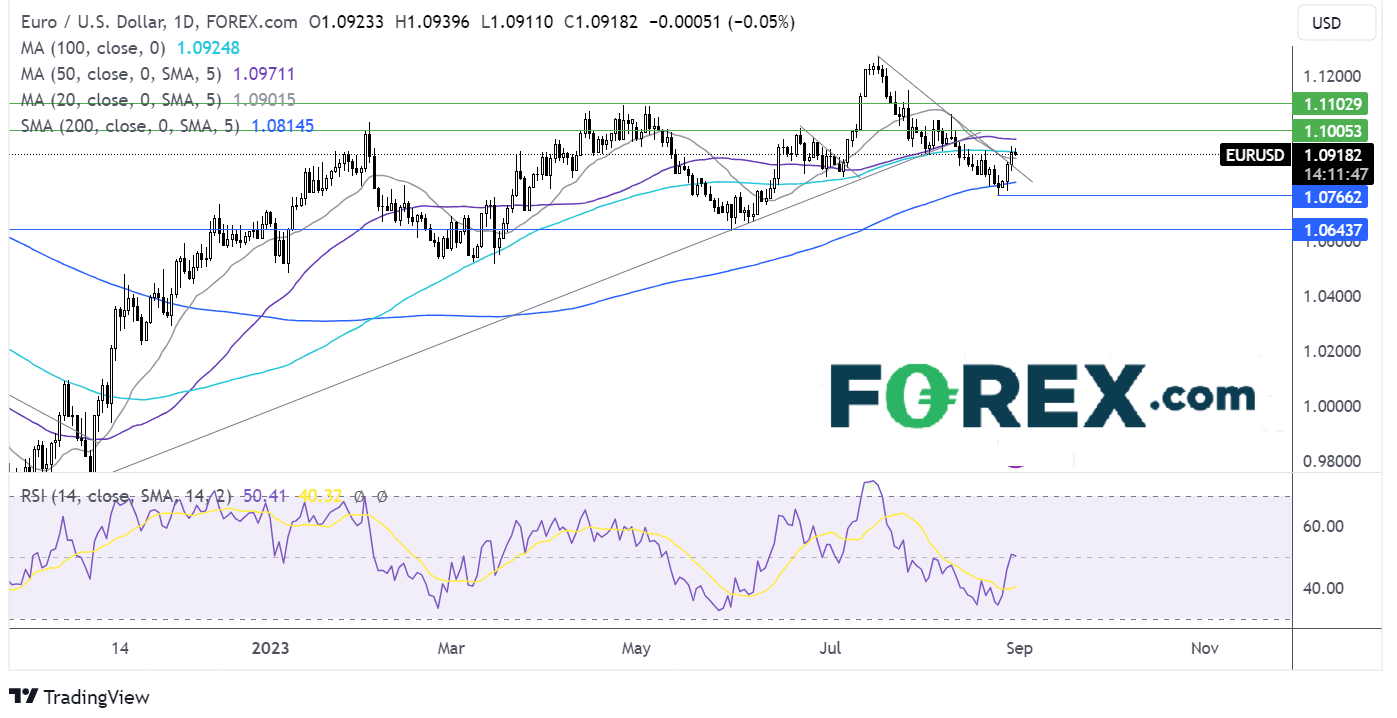
EUR/USD extended its recovery from 1.07660, rising back above the 200 sma, the falling trendline support and is testing the 100 sma resistance at 1.0920. The RSI is neutral, giving away few clues.
A rise above the 100 sma is needed to extend the recovery towards 1.10 round number and 1.1060 the August 10 high.
Should sellers successfully defend the 100 sma, bears could test the falling trendline support at 1.0850, ahead of 1.0760 the August low.
Oil flat after Chinese PMI data & ahead of US inflation figures
- Chinese official manufacturing PMI 49.7 in August
- US core PCE could drive Fed hike bets
- Oil tests resistance at 81.50
Oil is holding steady in cautious trade after 5 straight days of gains. Today, the upside is limited after Chinese manufacturing PMI remained below 50 for a fifth straight month and as investors look cautiously ahead to US core PCE data.
The China manufacturing PMI was 49.7 in August, up from 49.3 in July, still in contraction territory, raising concerns over the health of China’s economy as growth falters. While Beijing has announced some supportive measures, which could have helped manufacturing activity climb, the government has resisted mounting calls for more targeted, aggressive support measures.
Attention now turns to US inflation figures which could provide further clues over whether the Fed is likely to raise interest further. Hot inflation could point to further rate hikes, which would be considered bad news for oil demand.
US data yesterday showed that US Q2 GDP was downwardly revised to 2.1%, but oil prices rose in a case of bad news is good news for the oil market as it means more rate hikes are less likely.
On the supply side, Saudi Arabia is expected to continue its 1 million barrel-a-day voluntary oil output cut for a third consecutive month, adding to the existing OPEC cuts and keeping supply tight.
Oil forecast – technical analysis
Oil has extended its rebound from 77.50 earlier in the month, running into resistance at 81.50. The RSI points to further gains while it remains out of overbought territory and the 50 sma crossing above the 200 sma in a golden cross formation keeps buyers hopeful of further gains.
A rise above 81.50 could see the price head towards 83.50 the April high ahead of 84.60 the August high..
Sellers could look for a break below 79.30, the weekly low to extend the selloff towards 77.50.


Related tags:



Open an account in minutes
Experience award-winning platforms with fast and secure execution, and enjoy tight spreads from 0.5 pts on FX and 0.3 pts on indices.
Economic calendar
Web Trader platform
Our sophisticated web-based platform is packed with features.
Related articles
USD/CAD shooting star puts September surge on notice
USD/CAD has printed a clear bearish reversal pattern after an extraordinary September surge, but confirmation may depend heavily on how US Treasury yields react to Friday’s payrolls report.

USD/CHF Reverses as Swiss Franc Surges amid Bond Carnage
USD/CHF reverses from channel resistance as bond volatility surges and broad Swiss franc strength points to a possible carry-trade unwind.


US Dollar Technical Outlook: DXY Bulls Meet Resistance at Yearly Highs 10 1 2026
The U.S. Dollar has held firm despite fading Fed hike bets, but Friday’s payrolls could test the rally’s staying power.

This report is intended for general circulation only. It should not be construed as a recommendation, or an offer (or solicitation of an offer) to buy or sell any financial products. The information provided does not take into account your specific investment objectives, financial situation or particular needs. Before you act on any recommendation that may be contained in this report, independent advice ought to be sought from a financial adviser regarding the suitability of the investment product, taking into account your specific investment objectives, financial situation or particular needs.
StoneX Financial Pte. Ltd., may distribute reports produced by its respective foreign entities or affiliates within the StoneX group of companies or third parties pursuant to an arrangement under Regulation 32C of the Financial Advisers Regulations. Where the report is distributed to a person in Singapore who is not an accredited investor, expert investor or an institutional investor (as defined in the Securities Futures Act), StoneX Financial Pte. Ltd. accepts legal responsibility to such persons for the contents of the report only to the extent required by law. Singapore recipients should contact StoneX Financial Pte. Ltd. at 6826 9988 for matters arising from, or in connection with the report.
In the case of all other recipients of this report, to the extent permitted by applicable laws and regulations neither StoneX Financial Pte. Ltd. nor its associated companies will be responsible or liable for any loss or damage incurred arising out of, or in connection with, any use of the information contained in this report and all such liability is hereby expressly disclaimed. No representation or warranty is made, express or implied, that the content of this report is complete or accurate.
StoneX Financial Pte. Ltd. is not under any obligation to update this report.
Trading CFDs carries a high level of risk that may not be suitable for some investors. Consider your investment objectives, level of experience, financial resources, risk appetite and other relevant circumstances carefully. The possibility exists that you could lose some or all of your investments, including your initial deposits. If in doubt, please seek independent expert advice. Visit www.forex.com/en-sg/terms-and-policies for the complete Risk Disclosure Statement.