



Gold and silver forecast: Precious metals extend drop but seasonality hopes keeps bullish case alive
It has been a risk off session so far today with stocks, gold and especially silver (-4%) all taking a drop. Gold has fallen to a fresh 2026 low and its now more than $100 below the psychologically important $4,000 mark. A firmer US dollar, rising US rate expectations and fading safe-haven demand have combined to undermine the metal, despite continued central bank buying. This year has so far been a bad one for gold.
Share this:
It has been a risk off session so far today with stocks, gold and especially silver (-4%) all taking a drop. Gold has fallen to a fresh 2026 low and its now more than $100 below the psychologically important $4,000 mark. A firmer US dollar, rising US rate expectations and fading safe-haven demand have combined to undermine the metal, despite continued central bank buying. This year has so far been a bad one for gold. Not that it is any surprise to me, as regular readers would know. But there may be some light at the end of the tunnel. November through January has historically been one of gold’s stronger seasonal periods, potentially providing a tailwind just as the current correction gathers pace. For gold and silver forecast to turn positive again, we need to see at least a pause in the dollar buying.
For now, though, it makes more sense to look for resistance levels to hold rather than anticipate a major bullish reversal. That possibility should not be ruled out, and we will continue to monitor price action for signs of a turnaround. But unless the charts start offering more convincing evidence over the coming days, it is difficult to make a bullish case for gold at this stage.

Gold forecast undermined by dollar strength and rate expectations
The latest leg lower in gold is hardly surprising given the combination of forces working against the precious metals market. Stronger-than-expected US inflation data have reinforced expectations that interest rates will need to remain higher for longer, while comments from Fed officials have added to the hawkish tone. As a dollar denominated and non-yielding asset, the metal tends to struggle when the opportunity cost of holding it and/or the value of the Us dollar increases.
Some would argue that there is also less urgency to hold safe-haven assets than there was previously. Growing optimism around the prospect of an agreement between Washington and Tehran has helped unwind some of the geopolitical risk premium in gold and oil. Crude’s recent decline has stalled over the past couple of sessions, however, as increasingly hawkish rhetoric from both sides raises doubts about how quickly an agreement might materialise.
For now, the combination of a stronger dollar, higher yields and reduced haven demand explains much of gold’s weakness. It does not necessarily invalidate the longer-term investment case, with central banks continuing to buy gold, but it does make a sustained recovery difficult to envisage without a change in the macroeconomic backdrop.
Seasonal trends turn more favourable for gold
Apart from continued central bank buying, the calendar could offer some encouragement for gold. Historically, November through January or February has been a relatively strong period for gold, with January often ranking among its best-performing months.
There are several explanations for this tendency, including year-end portfolio adjustments, renewed investment demand and seasonal jewellery purchases. Festival-related buying in China can also provide additional support, particularly towards the end of the year and into the early months.
This does not mean gold is guaranteed to recover simply because of seasonality. The broader macroeconomic forces can easily override it. Nevertheless, following such a substantial correction, the shift towards a historically stronger period provides another reason not to dismiss the possibility of a recovery.
Silver forecast: strong dollar tests XAG/USD's long-term bullish trend
A strong US dollar is putting silver's long-term bullish case to a real with XAG/USD now some $3 below the $50 level after a correction of roughly 60% from its record high earlier this year. The greenback has been lifted by hawkish Federal Reserve commentary and a hotter-than-expected US inflation report, both unwelcome news for non-yielding precious metals. With prices breaking such a significant level, the near-term silver forecast hangs in the balance, although I am watching closely for signs of a reversal as I think the downside risks are likely to be limited from here on. But I’d like to see a move back above $51.95, which would be the first sign of a low, with $54.77 needed for confirmation.
More on this later, but first let’s talk technicals on gold…
Gold technical analysis
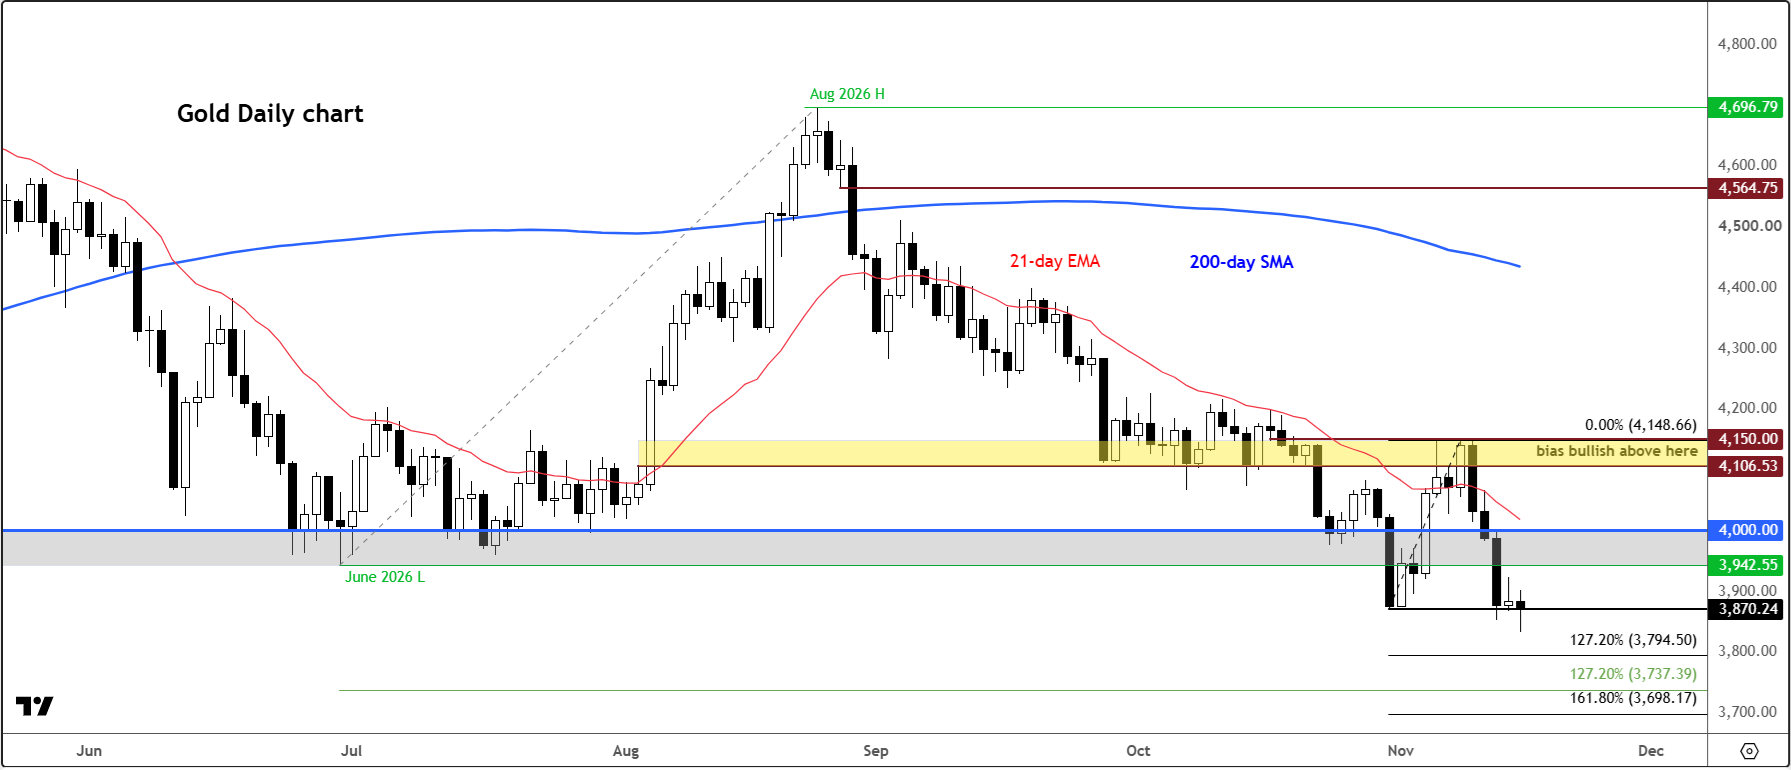
From a technical analysis perspective, gold continues to form lower highs and lower lows, while the trendlines and moving averages are all pointing lower. The path of least resistance is therefore still to the downside. The metal has already broken through several important technical levels that needed to hold if buyers were to remain in control. So, the onus is clearly on the bulls to show up and show us that they are still out there.
Key levels on XAU/USD
The $3,942–$4,000 zone is one of the most important technical areas to watch. This had previously been a major support area, holding throughout the summer months before gold staged a substantial rally. However, that recovery proved short-lived. The subsequent decline has taken gold decisively lower once again, breaking through this once important support area.
SO, a sustained move back above $3,942–$4,000 would provide the first indication that selling pressure is easing and that a recovery may be taking shape. But I would not regard that alone as confirmation that the bearish trend has ended.
For me, the more important bearish invalidation area lies between $4,106 and $4,150. This zone incorporates last week’s highs as well as a previous support and resistance area. A convincing move back above it would provide a much stronger signal that gold may finally have established a meaningful bottom.
We are some distance from that zone at present, with gold trading around the $3,900 mark. Nevertheless, it is worth keeping the $4,106–$4,150 zone on the charts as the level that would materially challenge the current bearish structure.
Until then, the balance of risks remains tilted towards further downside.
What are the next downside targets for gold?
Well, my initial objective was the liquidity sitting below October’s low around $3,870. Gold reached that area towards the end of last week and into the start of this week. So, any further weakness from here on is not something I was expecting with a great deal of confidence a few weeks ago.
But if the selling pressure does continues, and gold establish acceptance below $3,870, then the next downside target comes in at $3,737, which represents the 127.2% Fibonacci extension of the June-to-August rally. Watch out for the extensions of the more recent failed rally that took place between October 30th and November 9th, at $3795 (127.2%) and $3698 (161.8%).
Beyond those levels, the 161.8% extension of the abovementioned June-August move comes in around $3,476. Interestingly, that sits just below the next major psychological milestone at $3,500, making it an important potential target should the selling gather further momentum.
Whether gold ultimately reaches those levels remains to be seen. Until the charts tell us otherwise, downside risks remain elevated. Traders should be mindful of that backdrop, avoid taking unnecessary risks and resist the temptation to call a bottom before there is convincing evidence of one.
Technical silver forecast and key levels to watch
From a technical analysis point of view, silver has broken below long-term support around $50, an area that acted as resistance before the breakout towards the end of last year. It is also worth remembering that $50 marked the highs back in 2011, while a large cup-and-handle formation completed its breakout late last year. This area needs to be reclaimed quickly if the longer-term bullish trend is to be revived. Otherwise, a deeper correction towards the low $40s could be on the cards, potentially further if selling pressure accelerates.
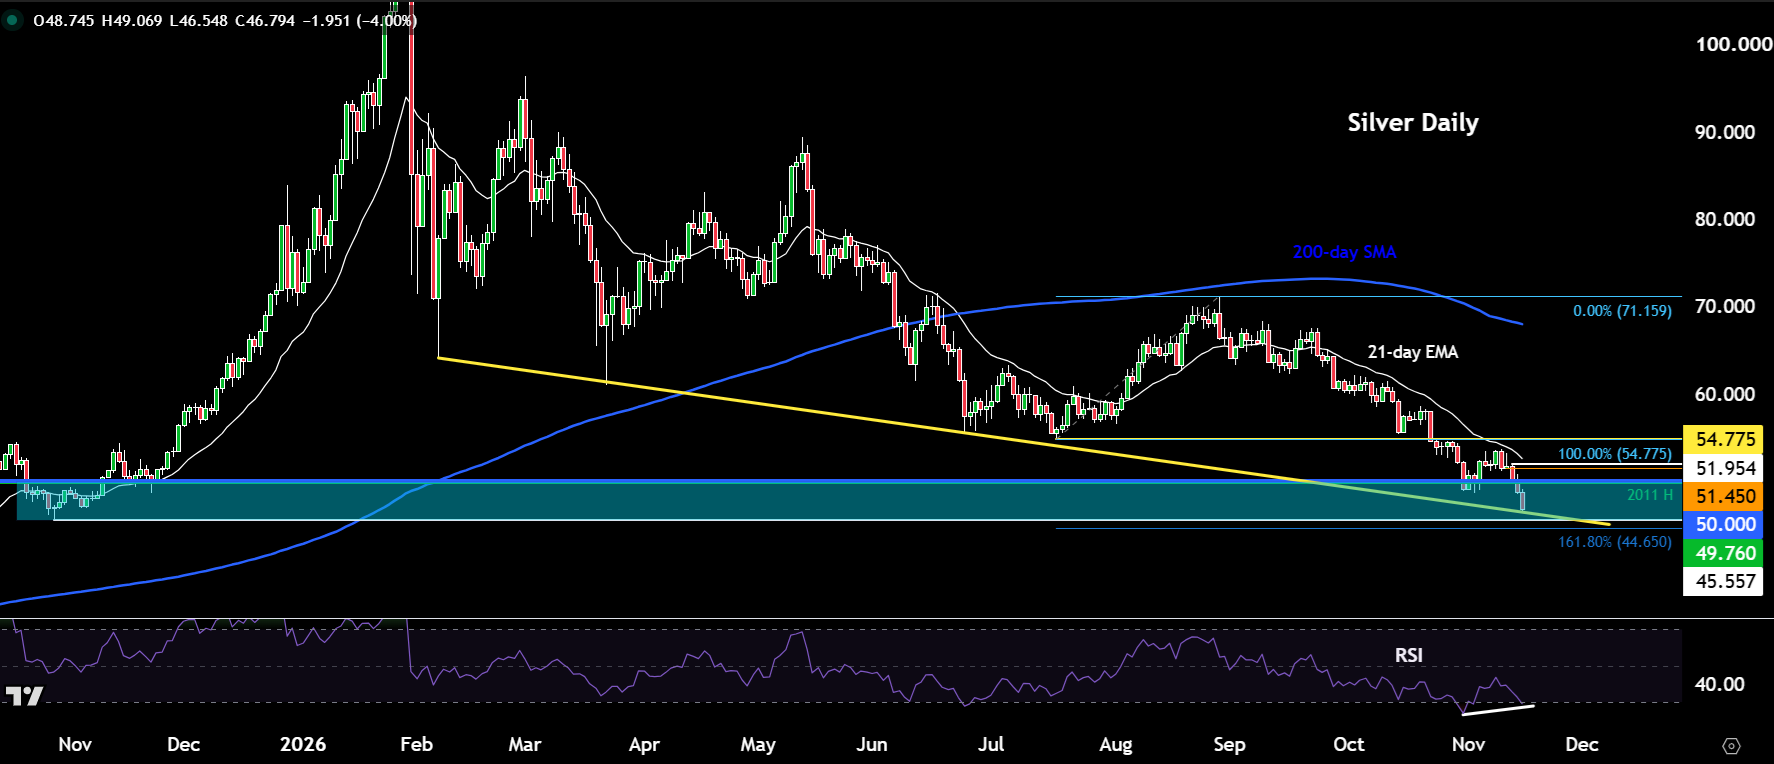
On the daily silver chart, prices need to create a higher high. A move back above the previous support around 51.10 to 51.45 area, and specifically above the local high of $51.95, would provide the first indication that sellers are getting trapped. For confirmation, I would want to see a break back above $54.77, the July low that gave way towards the end of October.
But right now, the more pressing issue for the bulls is when will the drop stop.
A lot will now depend on the direction of the dollar and interest rate expectations, which have turned decidedly against the metal.
Related tags:



Open an account in minutes
Experience award-winning platforms with fast and secure execution, and enjoy tight spreads from 0.5 pts on FX and 0.3 pts on indices.
Economic calendar
Web Trader platform
Our sophisticated web-based platform is packed with features.
Related articles
China's steel slump leaves iron ore bulls under the pump
Iron ore has broken major support, threatening a return to the lows of 2022 as mounting evidence of weakness in China's steel sector reinforces the bearish outlook.

USD/JPY, AUD/JPY: Central Bank Divergence Creates Two-Way Risk
USD/JPY eyes a breakout above 160, while AUD/JPY faces further losses as Fed, RBA and BoJ interest rate expectations diverge.


Gold and silver forecast: Precious metals extend drop but seasonality hopes keeps bullish case alive
It has been a risk off session so far today with stocks, gold and especially silver (-4%) all taking a drop. Gold has fallen to a fresh 2026 low and its now more than $100 below the psychologically important $4,000 mark. A firmer US dollar, rising US rate expectations and fading safe-haven demand have combined to undermine the metal, despite continued central bank buying. This year has so far been a bad one for gold.
This report is intended for general circulation only. It should not be construed as a recommendation, or an offer (or solicitation of an offer) to buy or sell any financial products. The information provided does not take into account your specific investment objectives, financial situation or particular needs. Before you act on any recommendation that may be contained in this report, independent advice ought to be sought from a financial adviser regarding the suitability of the investment product, taking into account your specific investment objectives, financial situation or particular needs.
StoneX Financial Pte. Ltd., may distribute reports produced by its respective foreign entities or affiliates within the StoneX group of companies or third parties pursuant to an arrangement under Regulation 32C of the Financial Advisers Regulations. Where the report is distributed to a person in Singapore who is not an accredited investor, expert investor or an institutional investor (as defined in the Securities Futures Act), StoneX Financial Pte. Ltd. accepts legal responsibility to such persons for the contents of the report only to the extent required by law. Singapore recipients should contact StoneX Financial Pte. Ltd. at 6826 9988 for matters arising from, or in connection with the report.
In the case of all other recipients of this report, to the extent permitted by applicable laws and regulations neither StoneX Financial Pte. Ltd. nor its associated companies will be responsible or liable for any loss or damage incurred arising out of, or in connection with, any use of the information contained in this report and all such liability is hereby expressly disclaimed. No representation or warranty is made, express or implied, that the content of this report is complete or accurate.
StoneX Financial Pte. Ltd. is not under any obligation to update this report.
Trading CFDs carries a high level of risk that may not be suitable for some investors. Consider your investment objectives, level of experience, financial resources, risk appetite and other relevant circumstances carefully. The possibility exists that you could lose some or all of your investments, including your initial deposits. If in doubt, please seek independent expert advice. Visit www.forex.com/en-sg/terms-and-policies for the complete Risk Disclosure Statement.