



Gold Bounces From Lows But Are Brighter Days Ahead?
Gold put in a sizable underside wick on the daily chart yesterday and this speaks to the possibility of near-term bottoming in the metal following a strong sell-off over the past six weeks.
Share this:

Gold Talking Points:
- Last week started with a descending triangle breakdown and yesterday showed the same. But the response to each has been different and this raises the prospect of change.
- The prior descending triangle saw prices break down and then range with support at the 4100 zone. The more recent item saw a fast snap back, and prices are in the same 4100 zone that was in-play before the move.
- Bigger picture, it’s the $4k level that looms large but ideally for bulls, support would show above that, illustrating a degree of bullish anticipation.
Gold prices have had a rough six-week stretch following the failure at 4700. While the Fed avoiding rate hikes in July and then the Treasury buyback announcement a couple weeks later helped to fuel a rally in gold, the backdrop has been considerably less friendly since, with Treasury yields flying and odds around the FOMC expecting more of a hawkish tilt.
But from the big picture, it’s still not terrible as the moderation earlier in the year simply took some of the fuel out of an overbought market that had spent much of the prior two years in an aggressive rally.
Gold Weekly Chart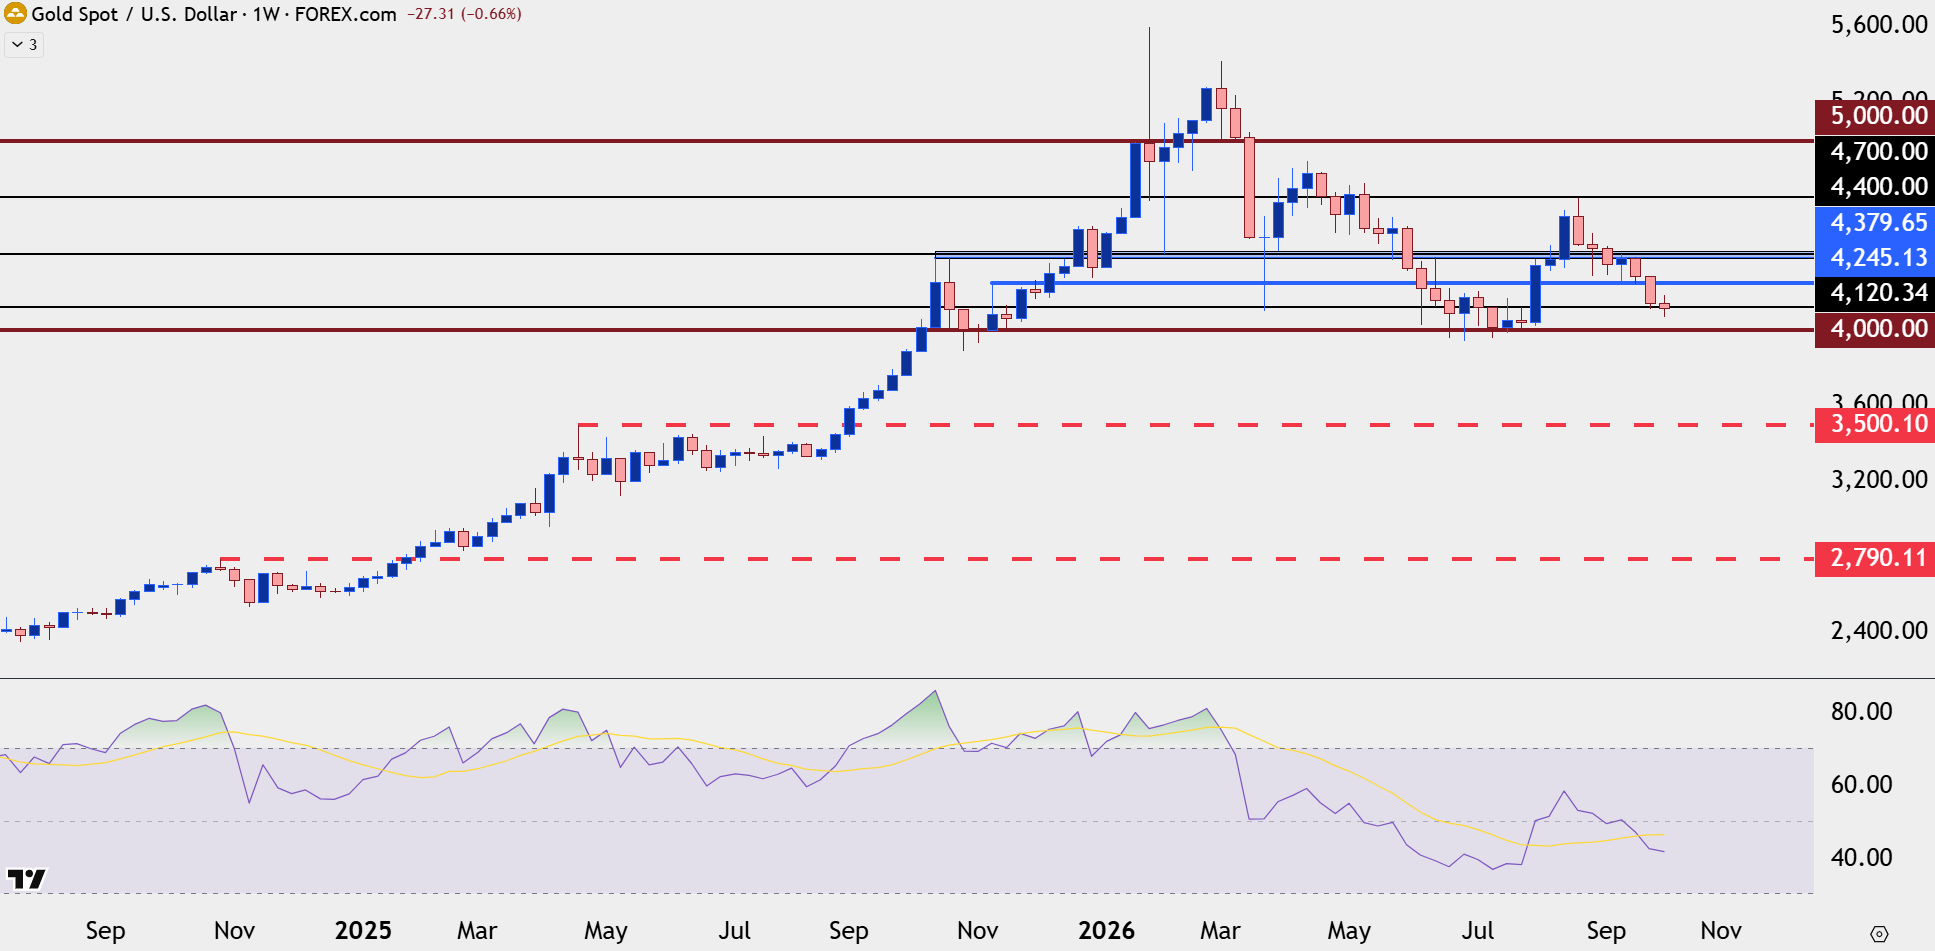
Chart prepared by James Stanley; data derived from Tradingview
The $4k level was big a year ago as it came in as support over a five week stretch in October, and as the Fed leaned into more cuts the rally took on another life of its own, with prices jumping up to and through the $5k level, eventually topping at just under $5600/oz. This certainly seemed to qualify as a ‘mania’ and the fundamental justification for such made sense given the backdrop.
With the Fed cutting in a second cycle, even with inflation remaining above their 2% target, there was even less attraction in holding reserves in US Dollars. Those rate cuts, combined with still-too-high inflation spelled for dilution of fiat currencies and because fiat currencies can really only be measured against other fiat currencies, this is something that wouldn’t necessarily show up against the Euro or the Yen or the British Pound.
But in an asset with finite supply, measured against something that’s essentially being diluted, that difference shows in a stark manner.
As a case in point, the $2k level was hard resistance for gold for three-and-a-half years, all the way until the Fed walked into a dovish posture in early-2024, eventually driving a breakout that continued to stretch for most of the next two years.
But the change-in-pace showed up earlier this year, in the form of a less controllable variable of higher oil prices, which have an expansive effect on economies as oil is in more than just transportation. This helps to explain the snap back move in gold back in March, followed by the continued drawdown as inflation levels moved higher earlier in the year.
Through much of that, however, the $4k level remained unfettered as buyers continued to show up early. But after Kevin Warsh’s first appearance at the Fed, when he took markets by surprise in sounding far more hawkish than what many expected President Trump’s hand chosen successor as the Chair of the FOMC to sound, and gold finally got down for that $4k re-test.
This took place over a seven-week period, all the way until just after the July FOMC meeting. But, from this, we can see clear evidence of buyers coming in for a perceived value whenever spot gold traded below the massive psychological level.
Gold Daily Chart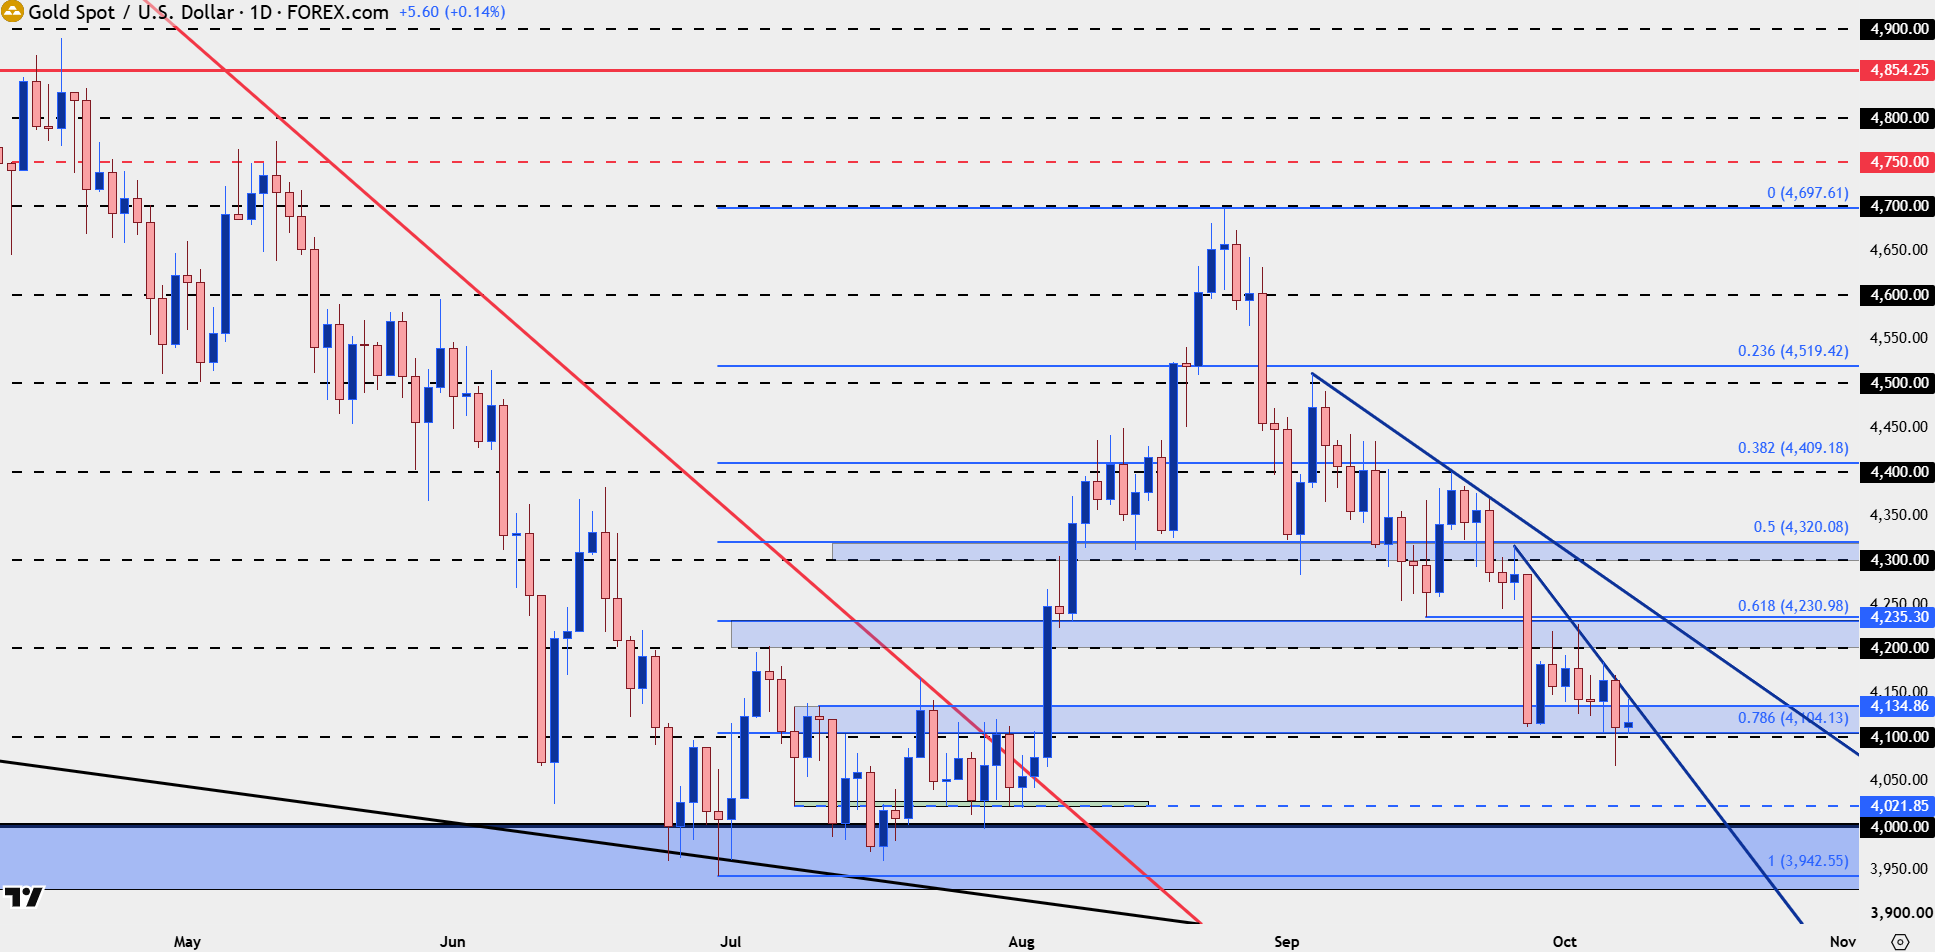
Chart prepared by James Stanley; data derived from Tradingview
Gold Sellers Are Still Driving
I talked about capitulation in the Tuesday webinar and another way of considering the topic is a liquidity sweep. When sellers have an open door to push for the breakdown, but, instead, pullback and fail to run with the sell-off, we have what could be the early stages of reversal. This kind of observation is indicative of a heavily oversold market when there’s simply few sellers left on the sidelines and, instead, profit taking after the fresh low leads into the bounce.
Yesterday was one of those scenarios, where bears had even open door to run with the break as another descending triangle had filled in. But they didn’t cease the opportunity and, instead, prices pulled back to a familiar level of $4135.
At this point, an absence of negatives doesn’t necessarily spell a positive – but it could be a novel first step.
What would be required for that scenario at this point would be a press from bulls to establish a higher-high, illustrating an increased willingness from buyers to continue to drive. We don’t have that yet, as that same $4135 level has so far proven resistant. But a higher-low support hold at $4100 – or even if a higher-low shows above yesterday’s swing low of 4066 – could begin setting the table for such.
The clear zone of resistance overhead runs from 4200-4235 and once that is taken out, there will be a more attractive bullish theme to work with. That’s quite far away, however, so, at this stage, looking for a break and re-test of higher-low support at $4135 could be an attractive early-stage illustration of that scenario.
And from the weekly bar – if it does finish the week in the green – even if it’s just a doji – that capitulation theme gains another item of confidence.
Gold Four-Hour Chart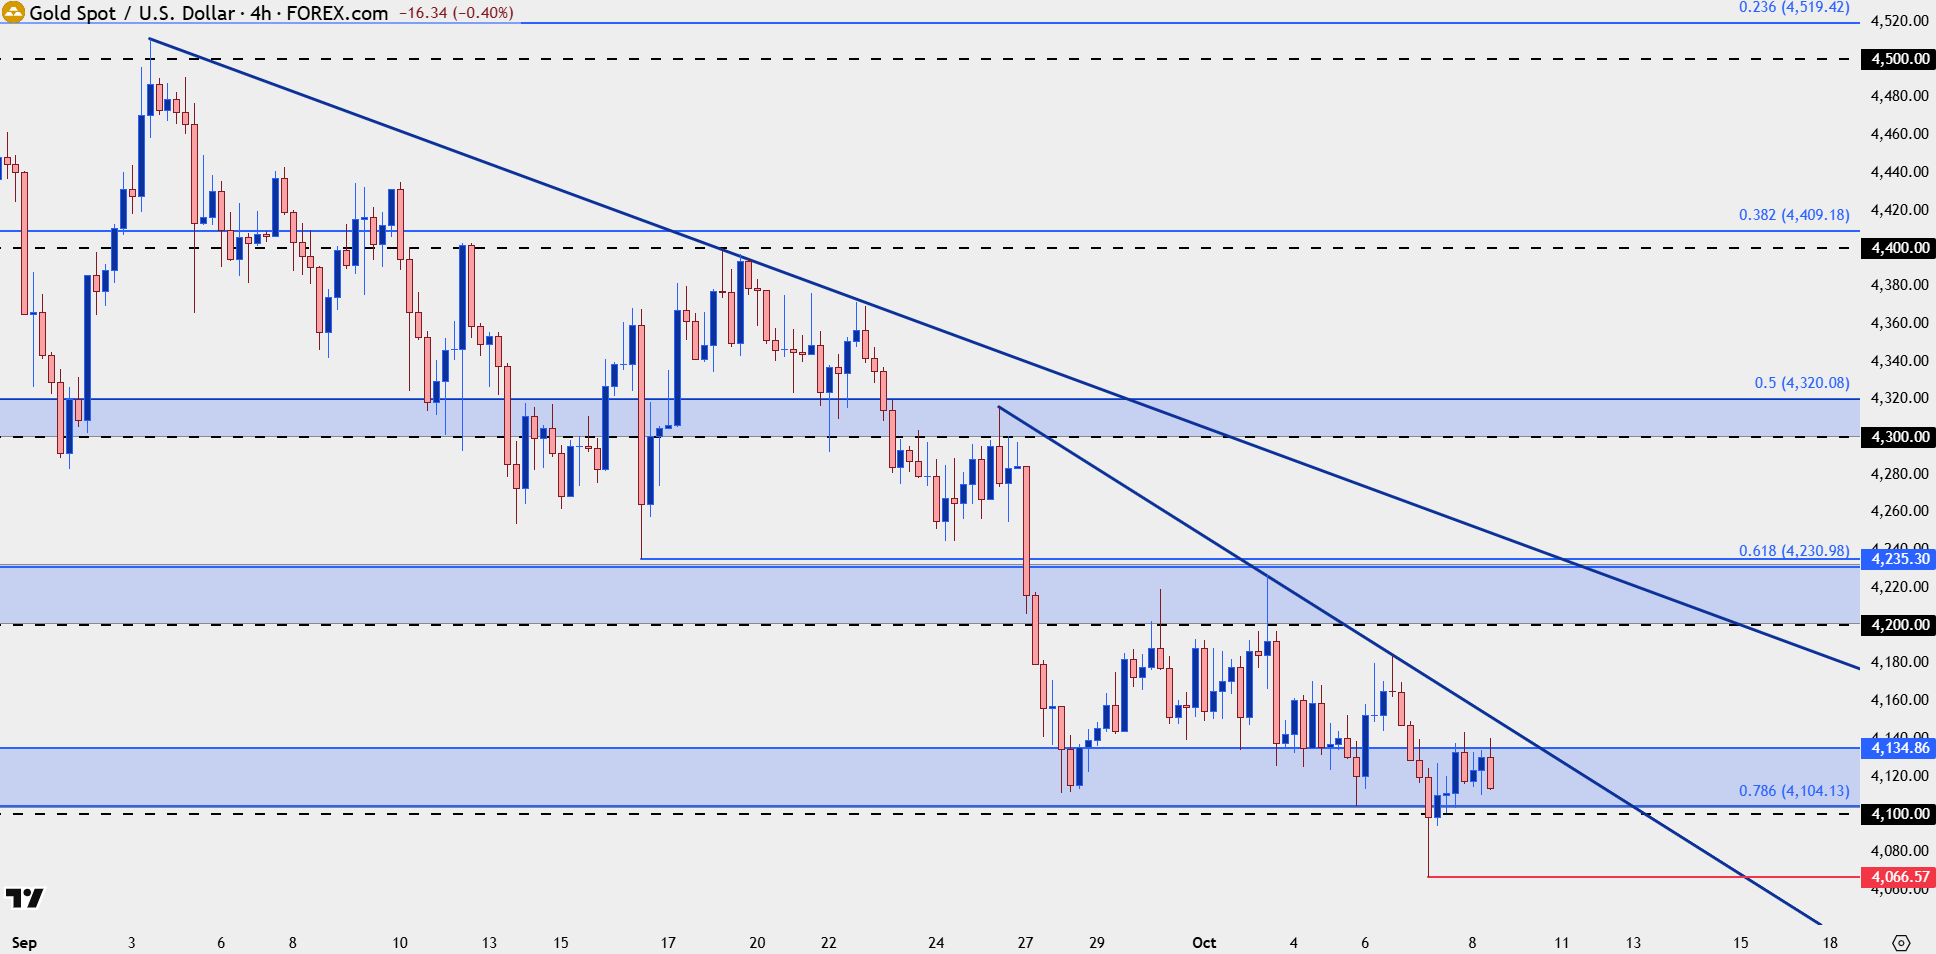
Chart prepared by James Stanley; data derived from Tradingview
--- written by James Stanley, Senior Market Analyst, Global Macro
Related tags:
Latest market news




Open an account in minutes
Experience award-winning platforms with fast and secure execution, and enjoy tight spreads from 0.5 pts on FX and 0.3 pts on indices.
Economic calendar
Web Trader platform
Our sophisticated web-based platform is packed with features.
Related articles
Gold Bounces From Lows But Are Brighter Days Ahead?
Gold put in a sizable underside wick on the daily chart yesterday and this speaks to the possibility of near-term bottoming in the metal following a strong sell-off over the past six weeks.

Gold Analysis: Fed Minutes Keep Pressure on XAU/USD
As the trading week continues to unfold, gold is once again facing difficulties in regaining momentum in the short term. This can be seen in the performance of the last three trading sessions, where the metal has declined by approximately 0.9%, resuming a bearish dynamic that has once again become evident in recent market activity.


EUR/USD Tests Most Oversold Levels in a Decade
It’s been a painful run for EUR/USD as the pair has lost more than 500 pips in a month and a half, but with the pair now deeply oversold the big question is whether sellers can stretch.
This report is intended for general circulation only. It should not be construed as a recommendation, or an offer (or solicitation of an offer) to buy or sell any financial products. The information provided does not take into account your specific investment objectives, financial situation or particular needs. Before you act on any recommendation that may be contained in this report, independent advice ought to be sought from a financial adviser regarding the suitability of the investment product, taking into account your specific investment objectives, financial situation or particular needs.
StoneX Financial Pte. Ltd., may distribute reports produced by its respective foreign entities or affiliates within the StoneX group of companies or third parties pursuant to an arrangement under Regulation 32C of the Financial Advisers Regulations. Where the report is distributed to a person in Singapore who is not an accredited investor, expert investor or an institutional investor (as defined in the Securities Futures Act), StoneX Financial Pte. Ltd. accepts legal responsibility to such persons for the contents of the report only to the extent required by law. Singapore recipients should contact StoneX Financial Pte. Ltd. at 6826 9988 for matters arising from, or in connection with the report.
In the case of all other recipients of this report, to the extent permitted by applicable laws and regulations neither StoneX Financial Pte. Ltd. nor its associated companies will be responsible or liable for any loss or damage incurred arising out of, or in connection with, any use of the information contained in this report and all such liability is hereby expressly disclaimed. No representation or warranty is made, express or implied, that the content of this report is complete or accurate.
StoneX Financial Pte. Ltd. is not under any obligation to update this report.
Trading CFDs carries a high level of risk that may not be suitable for some investors. Consider your investment objectives, level of experience, financial resources, risk appetite and other relevant circumstances carefully. The possibility exists that you could lose some or all of your investments, including your initial deposits. If in doubt, please seek independent expert advice. Visit www.forex.com/en-sg/terms-and-policies for the complete Risk Disclosure Statement.