


Gold breaks out as dollar rally cracks and Treasury futures find buyers
Gold is attempting to break out after a brutal selloff, just as the US dollar and Treasury futures show signs of turning. Historical extremes, shifting momentum and key technical levels suggest a potentially important moment for gold traders.
Share this:

- Gold attempts breakout after punishing decline since late August
- Dollar's historically stretched rally shows signs of losing momentum
- Treasury futures attempt bottom following extreme oversold conditions
- Gold bulls eye $4,225–$4,235 as first major upside target
Gold is attempting to break out after a punishing bearish period since late August, just as two of the key markets that contributed to its weakness are showing signs of potentially reversing.
US 10-year Treasury note futures look to be establishing a bottom, having hit extreme oversold conditions earlier this month, while the US Dollar Index has broken its short-term uptrend after becoming unusually stretched to the upside.
The question now is: can gold make the breakout stick?
Gold's relationship with the dollar and Treasury futures
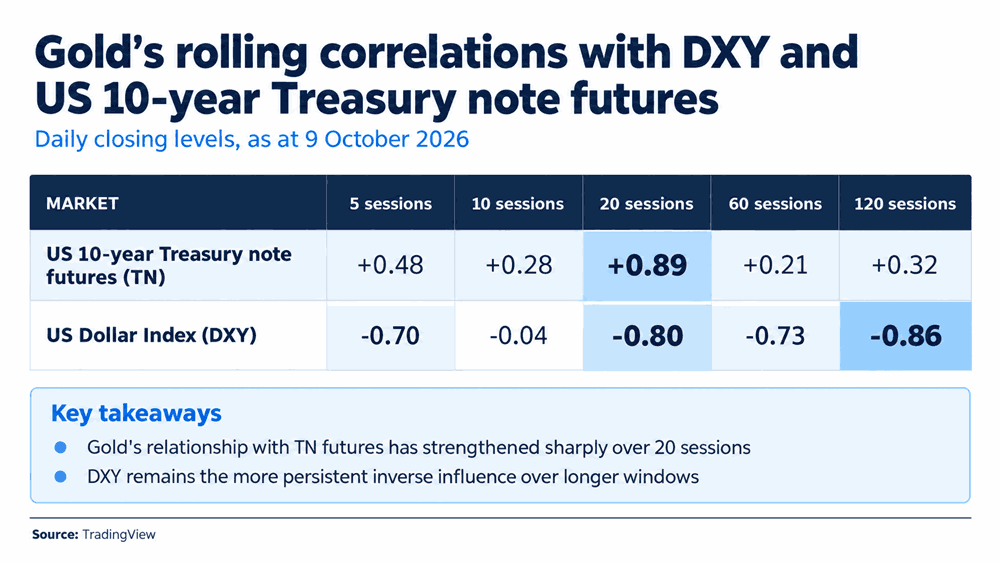
As the correlation matrix below demonstrates, the US dollar has maintained a strong inverse relationship with gold, particularly over longer timeframes, with the 120-session correlation sitting at -0.86, while the relationship over the past month remains firm at -0.80.
Source: TradingView
While less consistent than the relationship with the US dollar, 10-year Treasury note futures have also demonstrated a positive correlation with gold over the past week and fortnight, strengthening dramatically to +0.89 over the past month. Futures are used as the preferred measure given they're directly tradable, unlike Treasury yields.
US dollar rally showing signs of exhaustion
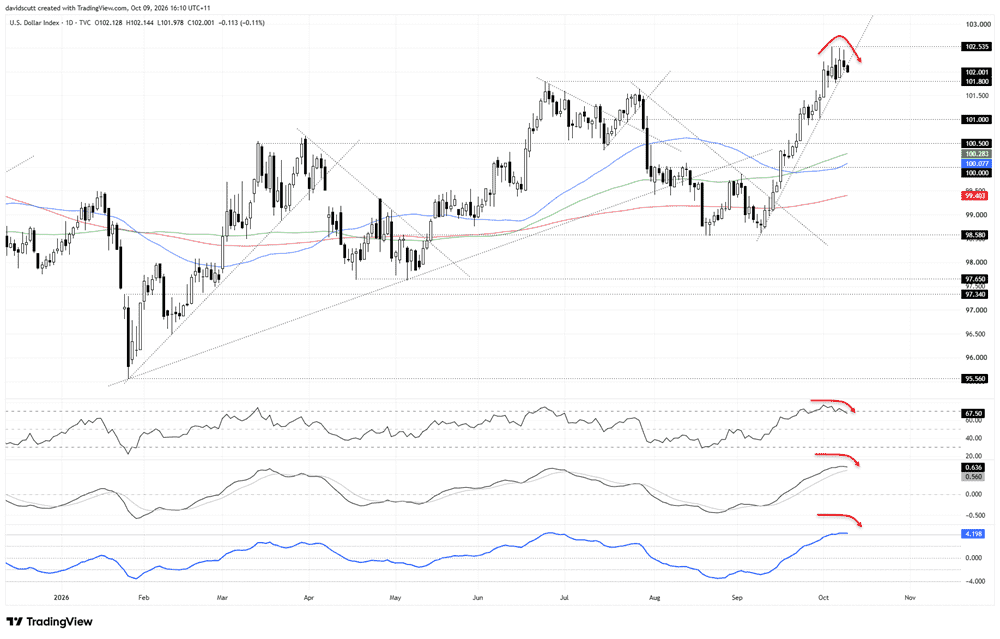
Given the strength and persistence of the inverse relationship with the dollar, the chart below makes for interesting viewing, not only for those trading FX, but also precious metals.
Source: TradingView
After becoming historically stretched to the upside, with RSI (14) reaching 76.8, placing it in the highest 1.5% of observations since 2013, and the ATR (50) stretch exceeding four, ranking in the highest 5% of the dataset, there are signs the big dollar is starting to roll over.
RSI (14) has moved back below overbought territory and is setting lower highs, while the uptrend in place since early September has cracked. That doesn't mean the break will stick, but if it does, it points to a potential change in the dollar's trend, at least over the short to medium term.
Treasury futures showing signs of a bottom
It's not just the dollar that looks like it may be approaching a turning point.
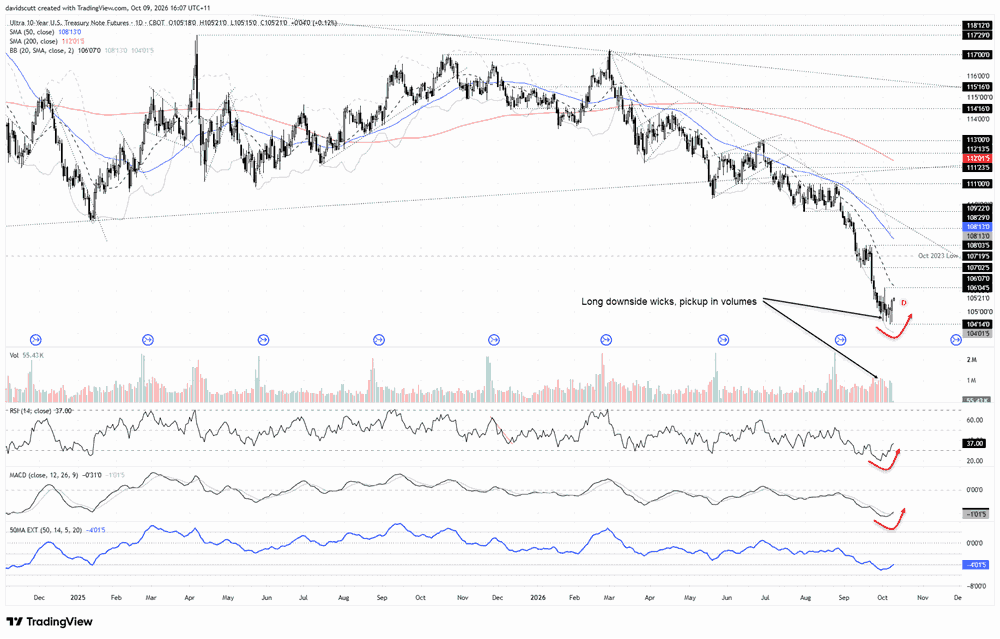
US 10-year Treasury note futures are also showing signs of trying to carve out a bottom following a punishing selloff that saw the price fall below the lows set in 2023.
Source: TradingView
RSI (14) fell to 19.7 in late September, ranking among the lowest 0.5% of observations since 2016, while the ATR (50) stretch reached -5.08, placing it among the most extreme 2% of readings.
Noticeable downside wicks suggest buyers have been stepping in at lower levels, coinciding with a significant increase in trading volumes. While this raises the possibility of a turning point over the short to medium term, it's far too early to declare a definitive bottom.
Gold breakout gathers momentum
Source: TradingView
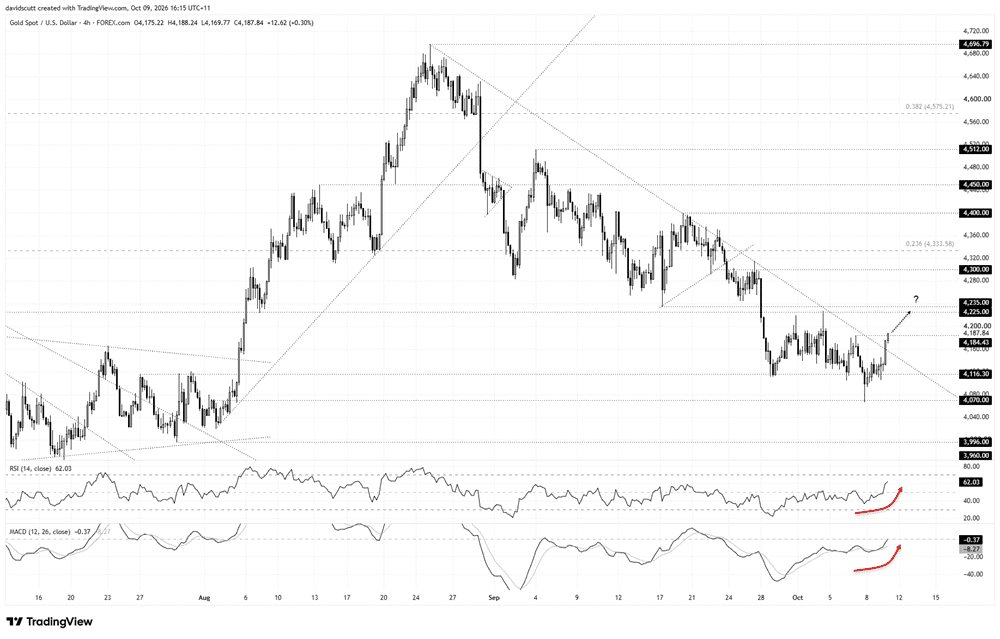
The four-hourly chart highlights the punishing bearish trend gold has endured since late August, falling more than $600 per ounce from its high just shy of $4,700.
However, after breaking to fresh multi-month lows earlier this week, the price rebounded sharply from support around $4,070. A period of grinding price action followed before today's breakout above downtrend resistance during Asian trade, with gold subsequently clearing $4,184.43, the October 7 high.
That level now becomes the immediate downside focal point. A pullback and bounce could provide an opportunity to initiate longs with a tight stop beneath for protection, initially targeting former support between $4,225 and $4,235. Beyond that, $4,300, $4,333.58 and $4,400 are the levels to watch.
Alternatively, a reversal back beneath $4,184.43 could open the door to shorts, initially targeting the broken August downtrend, followed by $4,116.30, a level that has acted as both support and resistance previously this year.
Like the price action, the oscillators are becoming more positive for the bulls. RSI (14) has moved rapidly above 50, while MACD has staged a bullish crossover and flipped positive, suggesting upside momentum is building and improving the prospects of the breakout sticking.


Open an account in minutes
Experience award-winning platforms with fast and secure execution, and enjoy tight spreads from 0.5 pts on FX and 0.3 pts on indices.
Economic calendar
Web Trader platform
Our sophisticated web-based platform is packed with features.
Related articles
Gold breaks out as dollar rally cracks and Treasury futures find buyers
Gold is attempting to break out after a brutal selloff, just as the US dollar and Treasury futures show signs of turning. Historical extremes, shifting momentum and key technical levels suggest a potentially important moment for gold traders.

Hang Seng Tech: Improving earnings can't stop the technical breakdown
Hang Seng Tech continues to slide despite improving earnings expectations across many major constituents. With valuations contracting and key technical support broken, the question is whether the selling has further to run.

USD/JPY falters, EUR/USD awaits French bond verdict
The yen has reacted to falling US yields, but the euro faces a different problem. Could French government bond yields provide the additional push needed to break EUR/USD's downtrend?
This report is intended for general circulation only. It should not be construed as a recommendation, or an offer (or solicitation of an offer) to buy or sell any financial products. The information provided does not take into account your specific investment objectives, financial situation or particular needs. Before you act on any recommendation that may be contained in this report, independent advice ought to be sought from a financial adviser regarding the suitability of the investment product, taking into account your specific investment objectives, financial situation or particular needs.
StoneX Financial Pte. Ltd., may distribute reports produced by its respective foreign entities or affiliates within the StoneX group of companies or third parties pursuant to an arrangement under Regulation 32C of the Financial Advisers Regulations. Where the report is distributed to a person in Singapore who is not an accredited investor, expert investor or an institutional investor (as defined in the Securities Futures Act), StoneX Financial Pte. Ltd. accepts legal responsibility to such persons for the contents of the report only to the extent required by law. Singapore recipients should contact StoneX Financial Pte. Ltd. at 6826 9988 for matters arising from, or in connection with the report.
In the case of all other recipients of this report, to the extent permitted by applicable laws and regulations neither StoneX Financial Pte. Ltd. nor its associated companies will be responsible or liable for any loss or damage incurred arising out of, or in connection with, any use of the information contained in this report and all such liability is hereby expressly disclaimed. No representation or warranty is made, express or implied, that the content of this report is complete or accurate.
StoneX Financial Pte. Ltd. is not under any obligation to update this report.
Trading CFDs carries a high level of risk that may not be suitable for some investors. Consider your investment objectives, level of experience, financial resources, risk appetite and other relevant circumstances carefully. The possibility exists that you could lose some or all of your investments, including your initial deposits. If in doubt, please seek independent expert advice. Visit www.forex.com/en-sg/terms-and-policies for the complete Risk Disclosure Statement.