



Gold Does Something it Hasn’t Done in a Year, is Larger Risk-Off Afoot?
With tech stocks getting hit harder last week there was collateral damage elsewhere, including gold as the metal closed below the $4k level for the week and that’s the first time that’s happened to spot gold in more than a year.
Share this:

Gold Talking Points:
- Gold prices sold off again last week as Treasuries caught a bid and tech stocks continued their descent.
- Next week brings the Fed and the wide expectation is for a hold next week but a hike in December, and as we saw in both June and July, the nuance around the press conference can have a big impact on gold prices.
It was a meteoric rise for gold after the metal spent three and a half years resisting at $2k. But as the Fed signaled rate cuts on the way, even with inflation well above the 2% target, gold markets became untethered in February of 2024 and rallied in historic fashion, at least for the time. The move eventually pushed up to $2790 ahead of the US Presidential election and after a two-month pullback, the rally resumed and this time, bulls held a decisive advantage for much of the time.
Gold Weekly Price Chart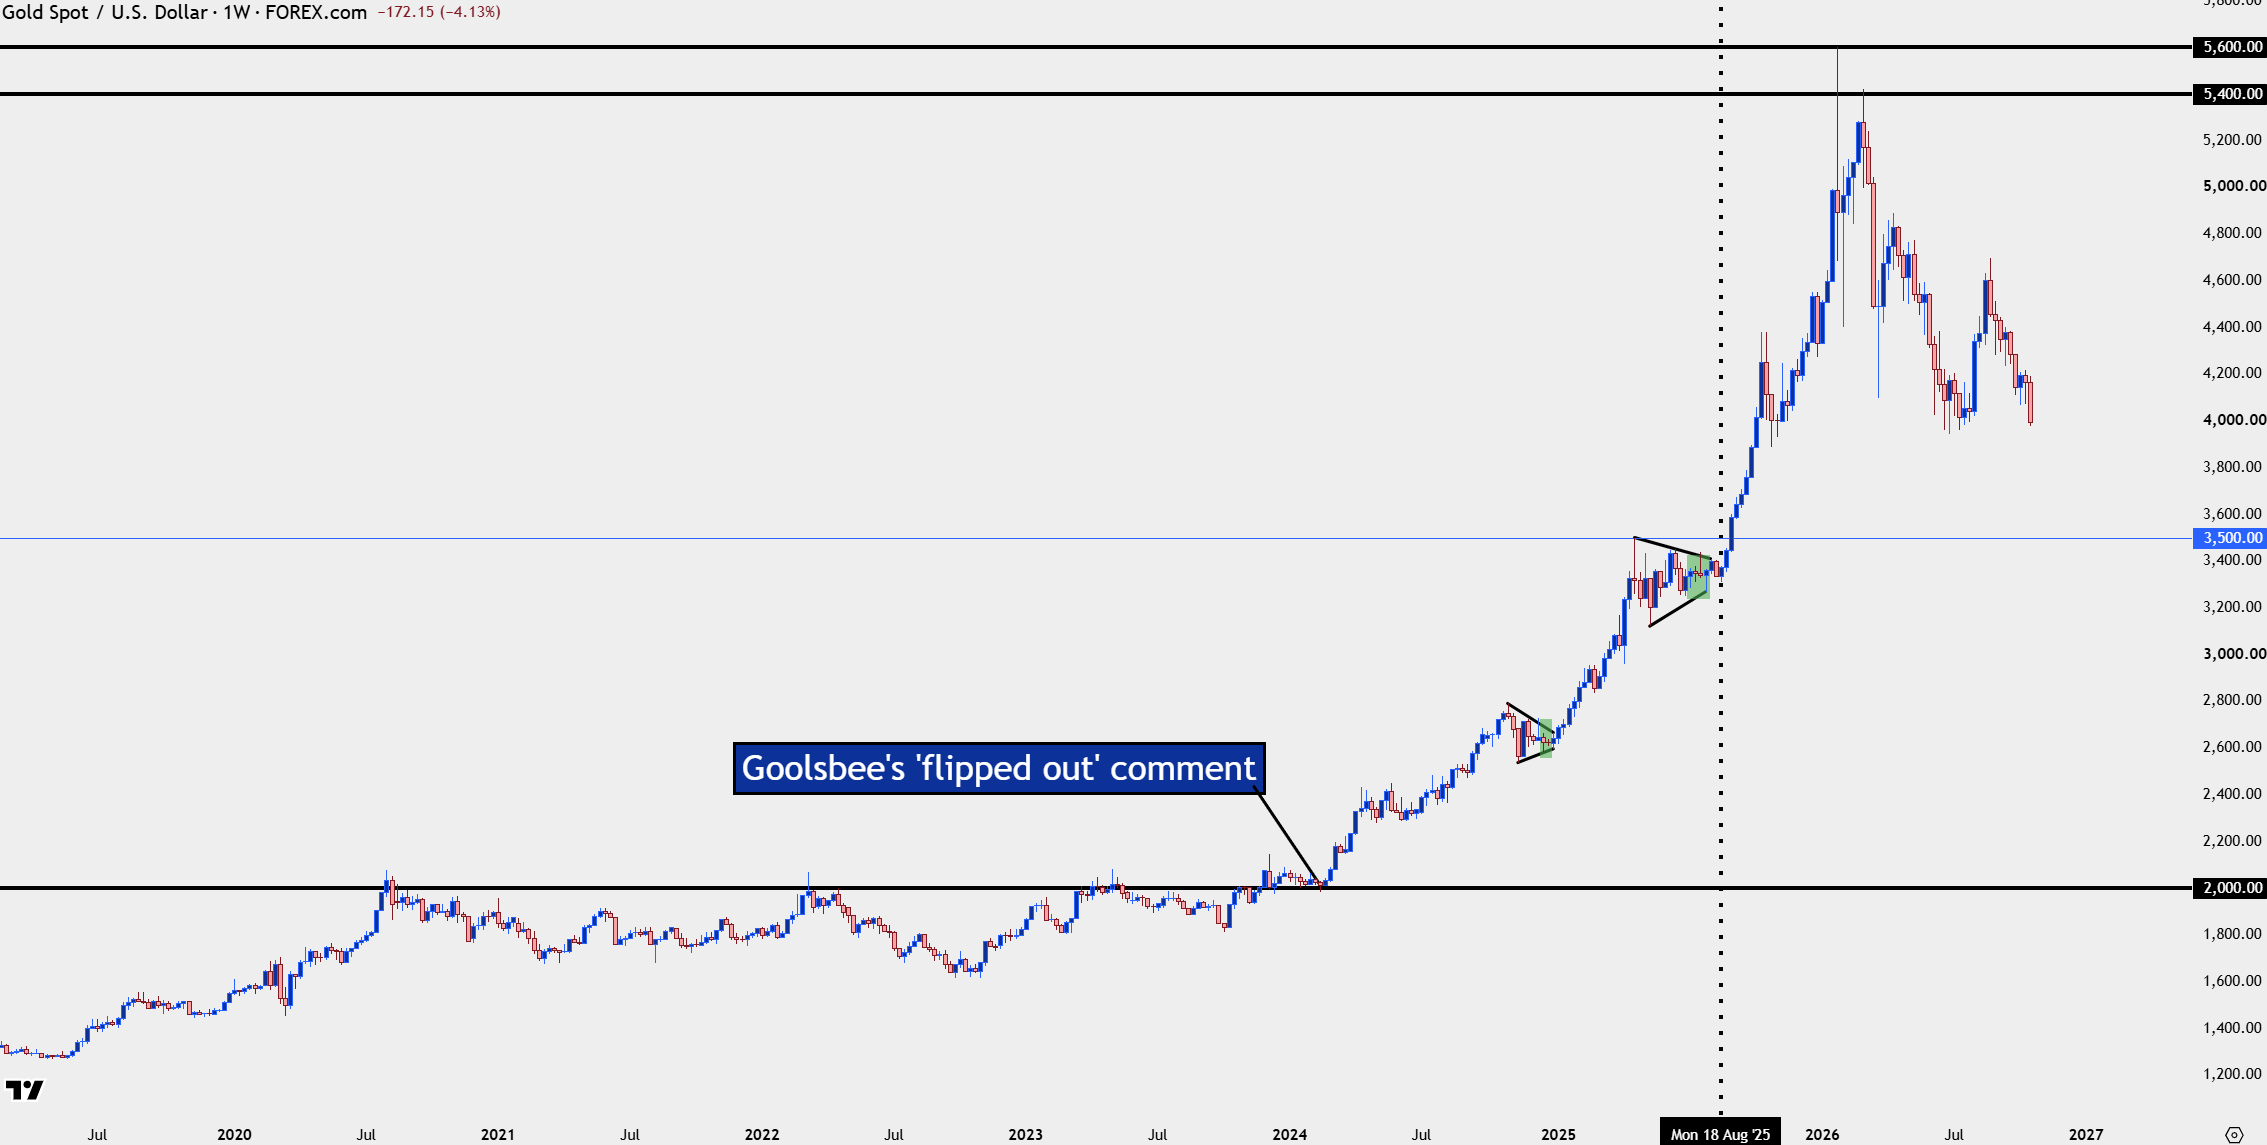
Chart prepared by James Stanley; data derived from Tradingview
In terms of pauses, the only other such scenario after that post-Presidential run was the four-month period ahead of Jackson Hole last year. This is when Jerome Powell wasn’t as dovish as markets wanted, instead, fearful that tariffs would boost inflation and that refrained the Fed from further cuts.
But it was the Jackson Hole Economic Symposium where he finally started to shift, and that’s when gold broke out of a symmetrical triangle that, eventually, ran through this year’s open.
Along the way, the $4k level was a mere speed bump that slowed bulls down for a couple of weeks. But, more recently, it’s become a bigger objective as it held support for two months earlier this summer.
Gold Daily Chart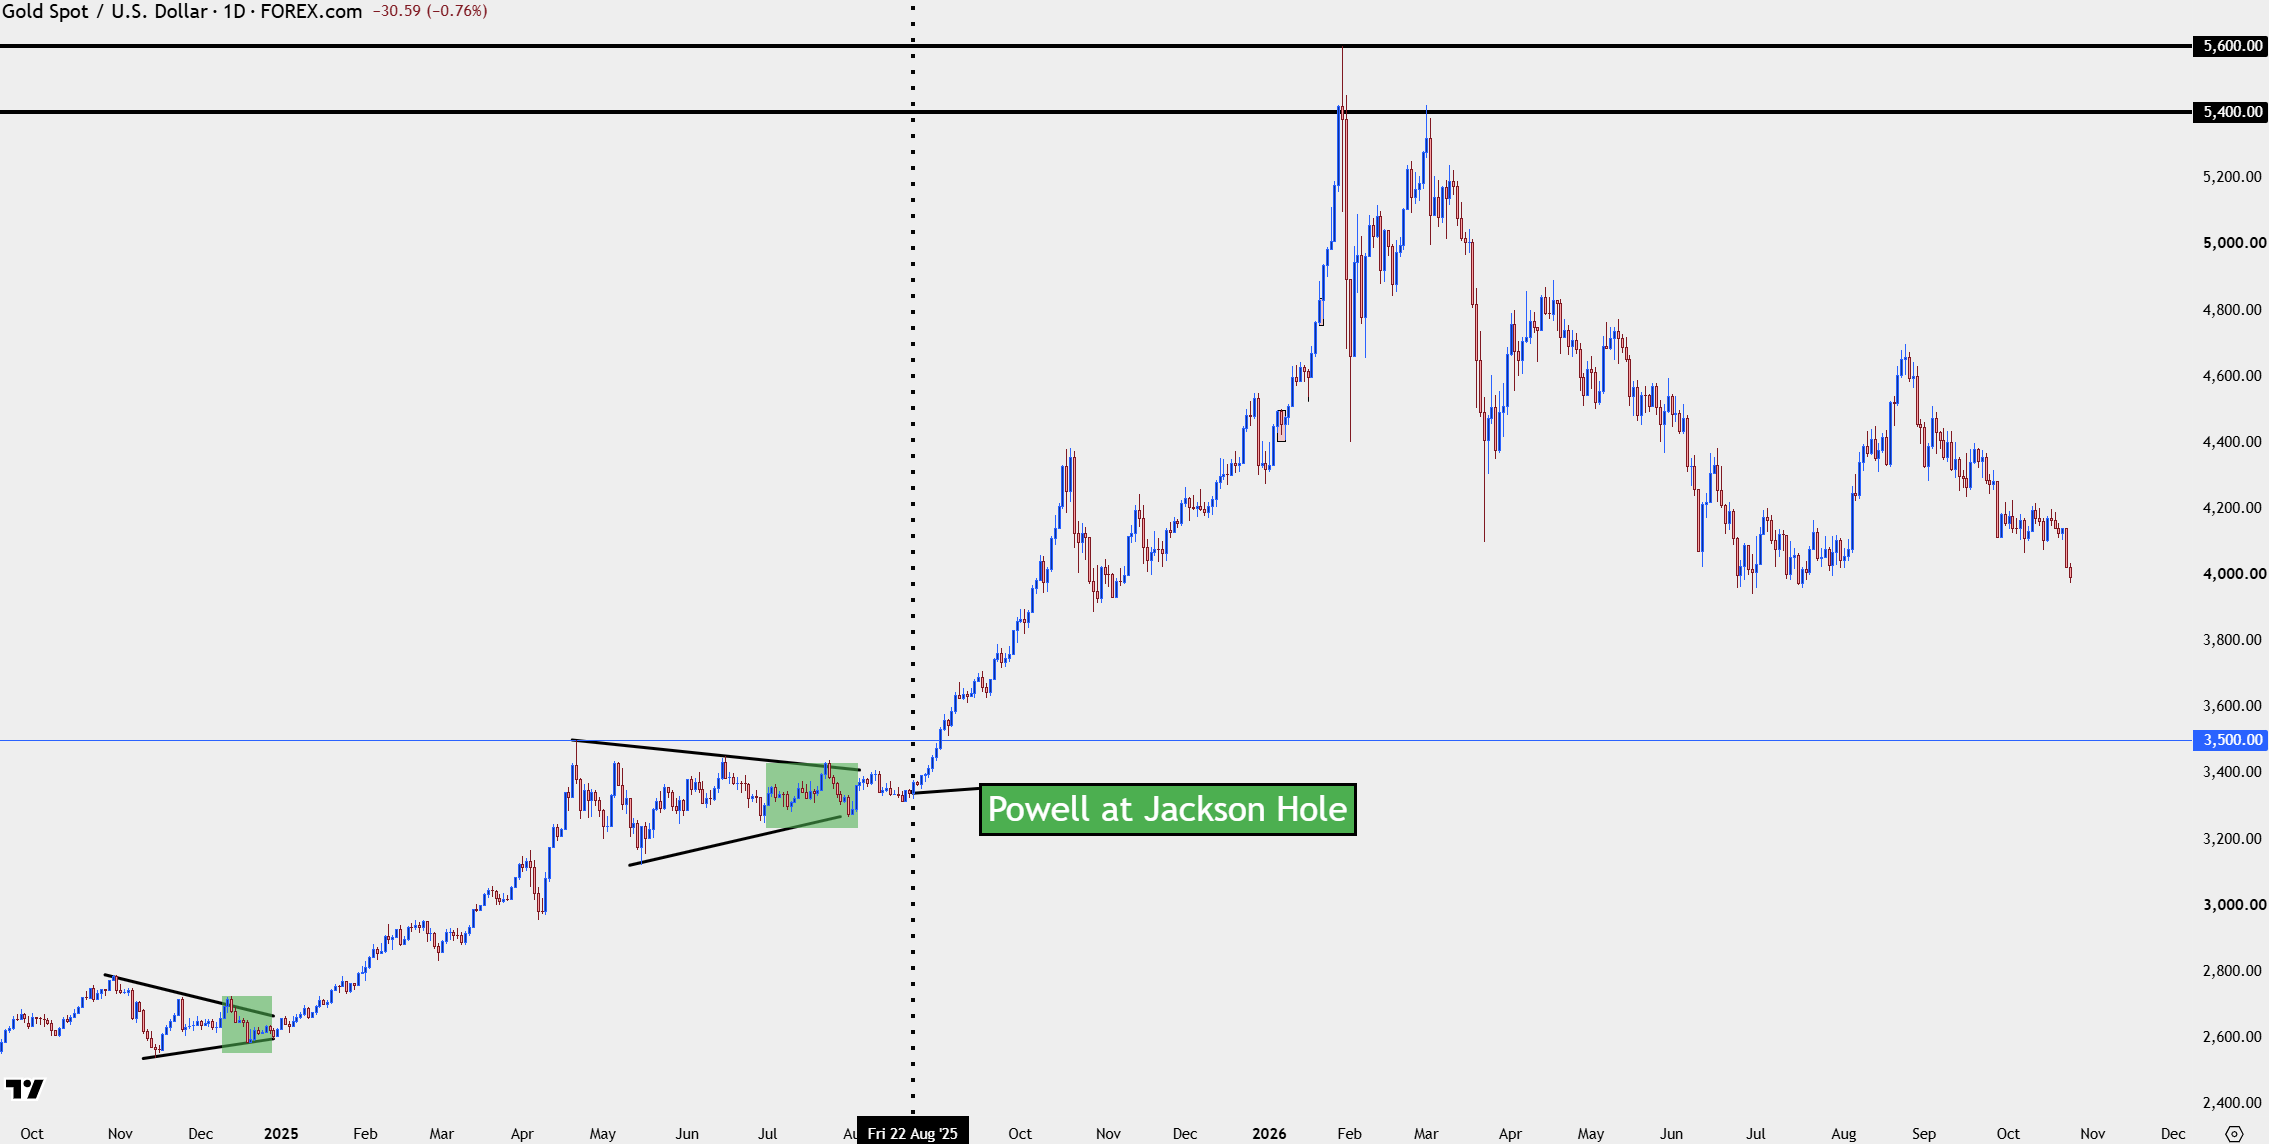
Chart prepared by James Stanley; data derived from Tradingview
Gold in 2026, the Shift
As inflation flared earlier in the year the prevailing thought was that we would get a more hawkish Fed, and that tempered gold prices in a big way in the first half of the year. But the showdown was at that $4k level, and that price finally came into play after the June rate decision, when Kevin Warsh sounded more-hawkish than markets had expected.
That $4k test lasted for a while, but on a weekly close basis, gold never finished the week below that price – until this week. I think this can be boiled down to a short-term v/s long-term concept, where longer-term buyers had come in to support that level, as rate hikes and hawkish policy in the US were seen as short-term mechanisms to tame inflation. And with President Trump’s ‘we’ll grow our way out of debt,’ that makes sense.
Even if currency debasement isn’t here right now, it probably will be whenever the Fed can finally get a handle on inflation.
But, more recently, something else has popped up, and this was something I addressed in the Friday video on StoneX.
USD/JPY Carry Trade and AI Bubble Fears
This content was created by an affiliate of FOREX.com and represents the views and opinions of the author/speakers, not the views and opinions of FOREX.com, StoneX Group Inc., or its subsidiaries. The content has not been independently reviewed by FOREX.com.
Dash for Cash
Last week saw money come out of many different pockets of the market and rush into US Treasuries. This has been a recurring theme in StoneX videos, as I’ve been highlighting that a bid in Treasuries can create an attractive trade that draws capital out of many other asset classes.
The fact that buyers did not come in to boost gold above that $4k level by the end of the week adds some color around that scenario. The continued sell-off in gold is driven not only by capital rushing into Treasuries to get higher rates before more Treasury buying pushes yields down, but also by the fear that higher inflation and a more-hawkish Fed will continue through next year.
This is where a degree of correlation could build between gold and stock prices, as risk aversion drives capital out of both markets.
Gold Weekly Chart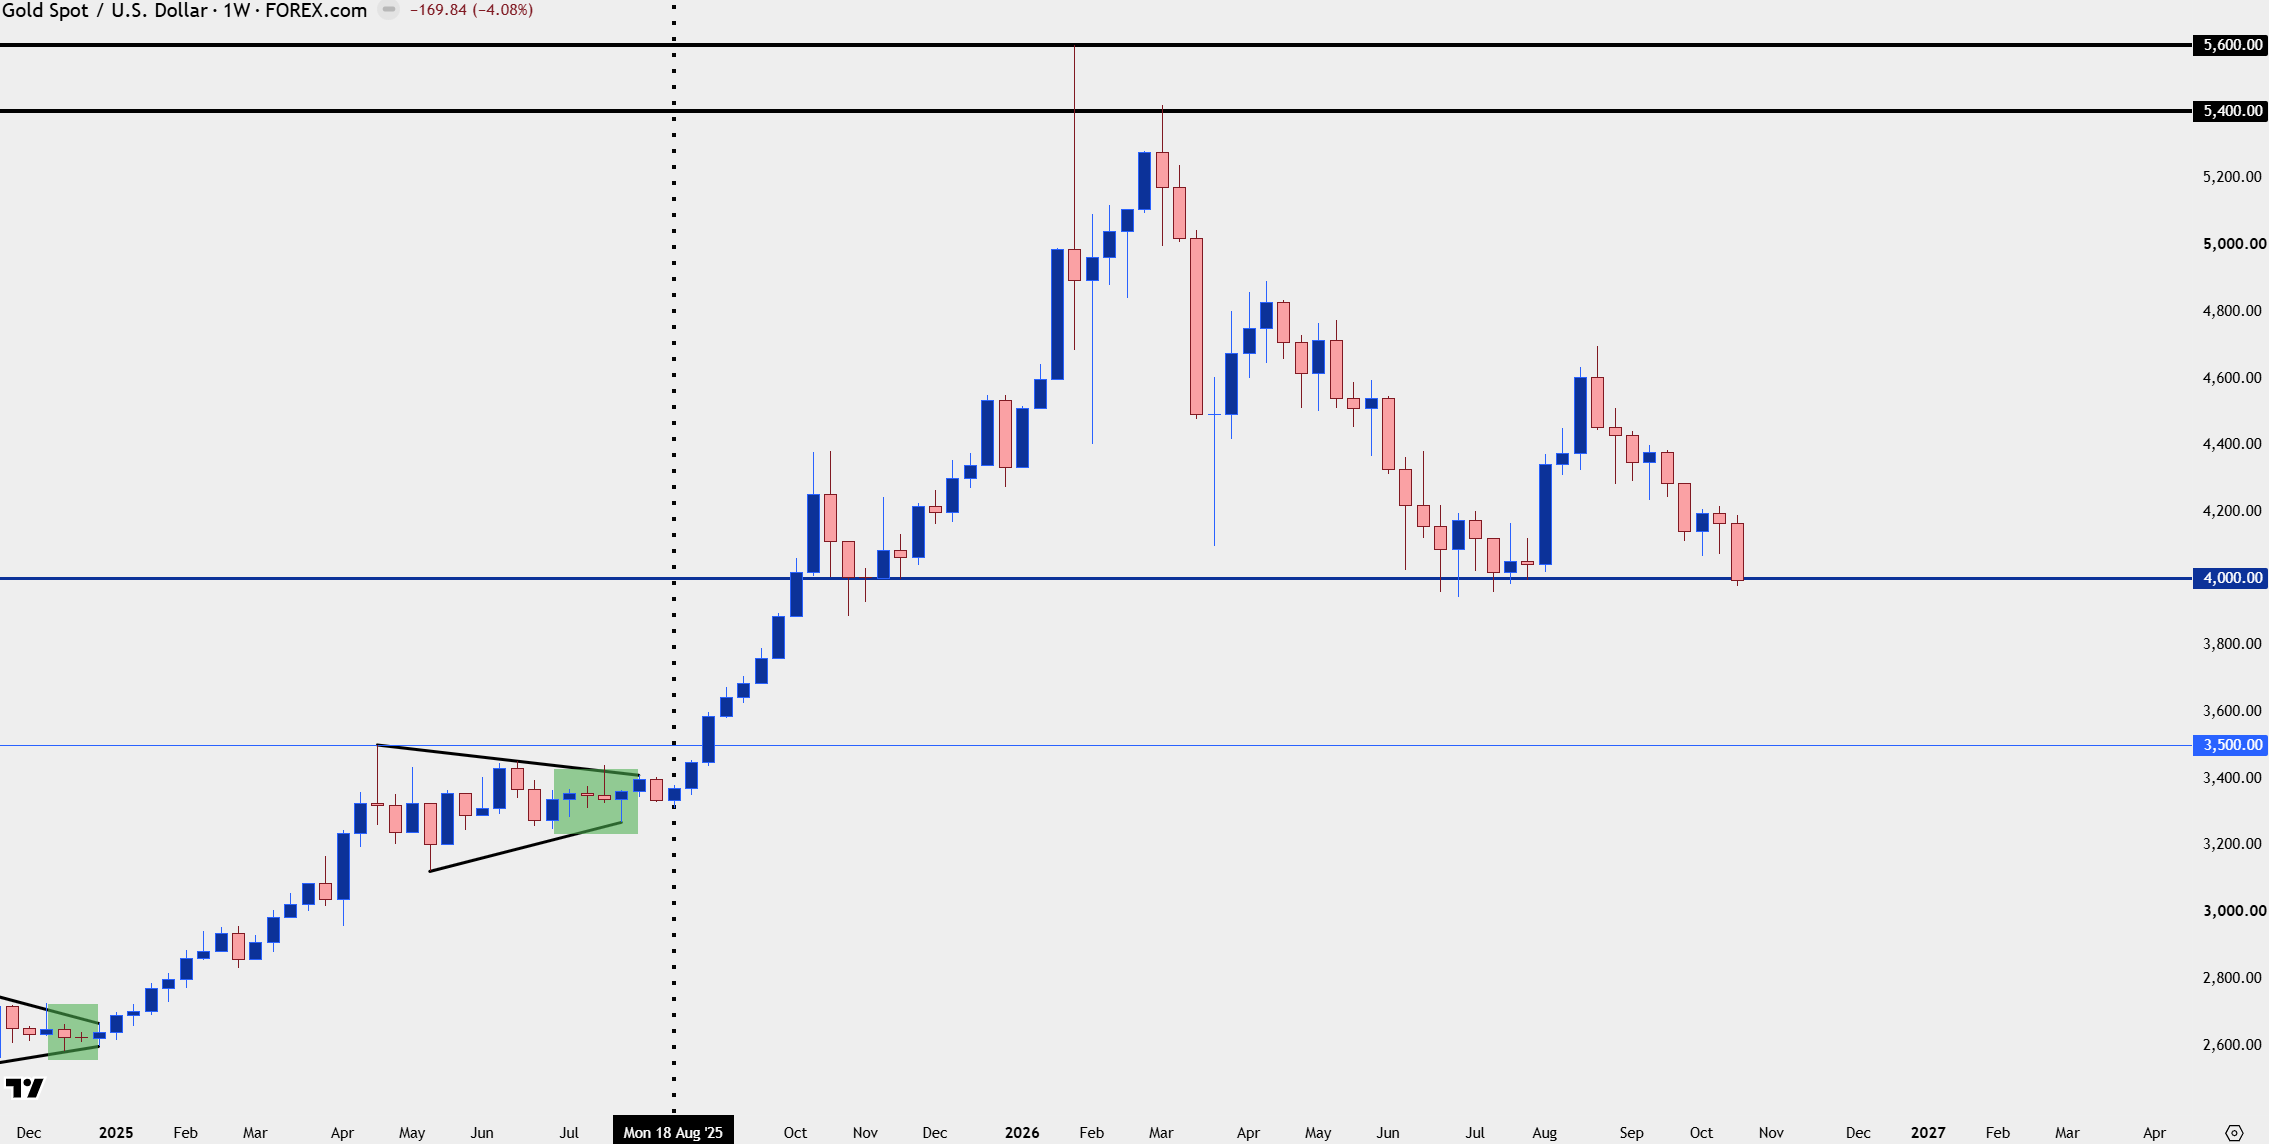
Chart prepared by James Stanley; data derived from Tradingview
Gold Near-Term Strategy
The $4k break is still rather fresh, so there can still be a case made on either side of the matter, but given the bias, we’ll first address the bearish argument.
At this point there’s a few different prior support levels overhead that can now function as lower-high resistance. For ‘r1’ resistance, the prior swing lows from 4066-4073, and above that for ‘r2’ we have a prior support zone around the 4100 psychological level that syncs up to the 4111 prior swing.
The ‘r3’ zone, and what I’m considering as invalidation for the bearish theme, is around $4200 and if we do see a break of that area, then something has shifted. That was a big spot of resistance for almost a full month and if buyers can suddenly break through, then we’ve probably seen a shift of fundamentals, of some sort.
Gold Daily Price Chart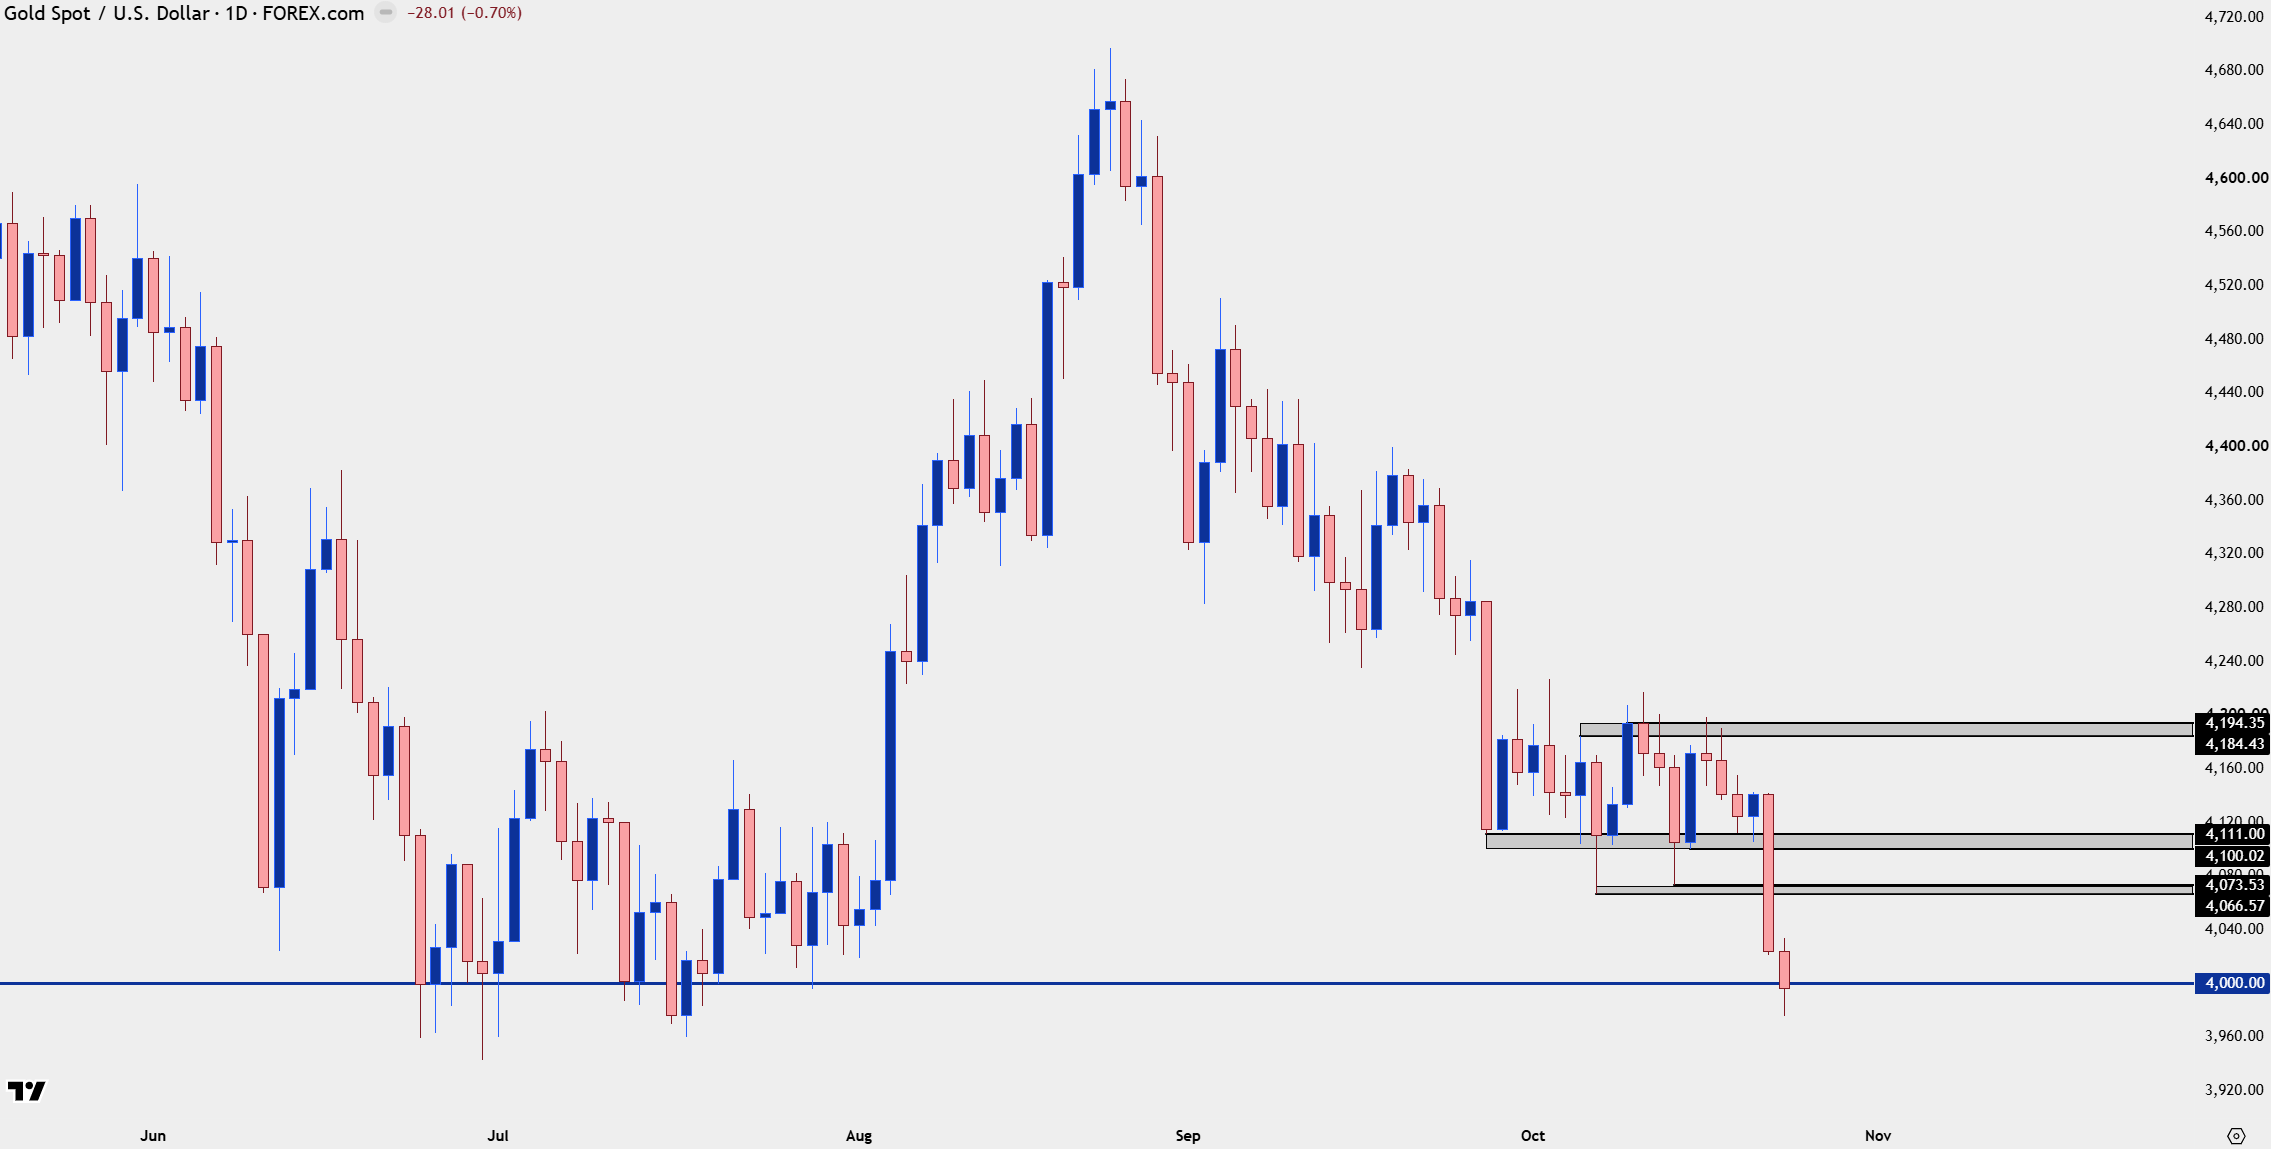
Chart prepared by James Stanley; data derived from Tradingview
Gold Bullish Strategies
At this point the long side seems like swimming upstream so some work will need to be done, but there could be a couple of ways of approaching this after the Sunday open.
The first would be for reversal scenarios, and traders would likely want some evidence of gold re-claiming $4k before looking to work a bounce up to prior resistance, around the $4030 area. The key for that would be a hold above $3975, the low from Friday.
But if we get a break of $4030, then there could be short-term bullish recovery ideas getting more attractive, which could then target those longer-term resistance levels looked at above, such as $4066-4073, after which $4023-4032 could become higher-low support potential.
Some work would need to be done on that front but if cooler heads prevail on the risk-off trade, this is certainly a scenario that could come into the picture.
Gold Four-Hour Chart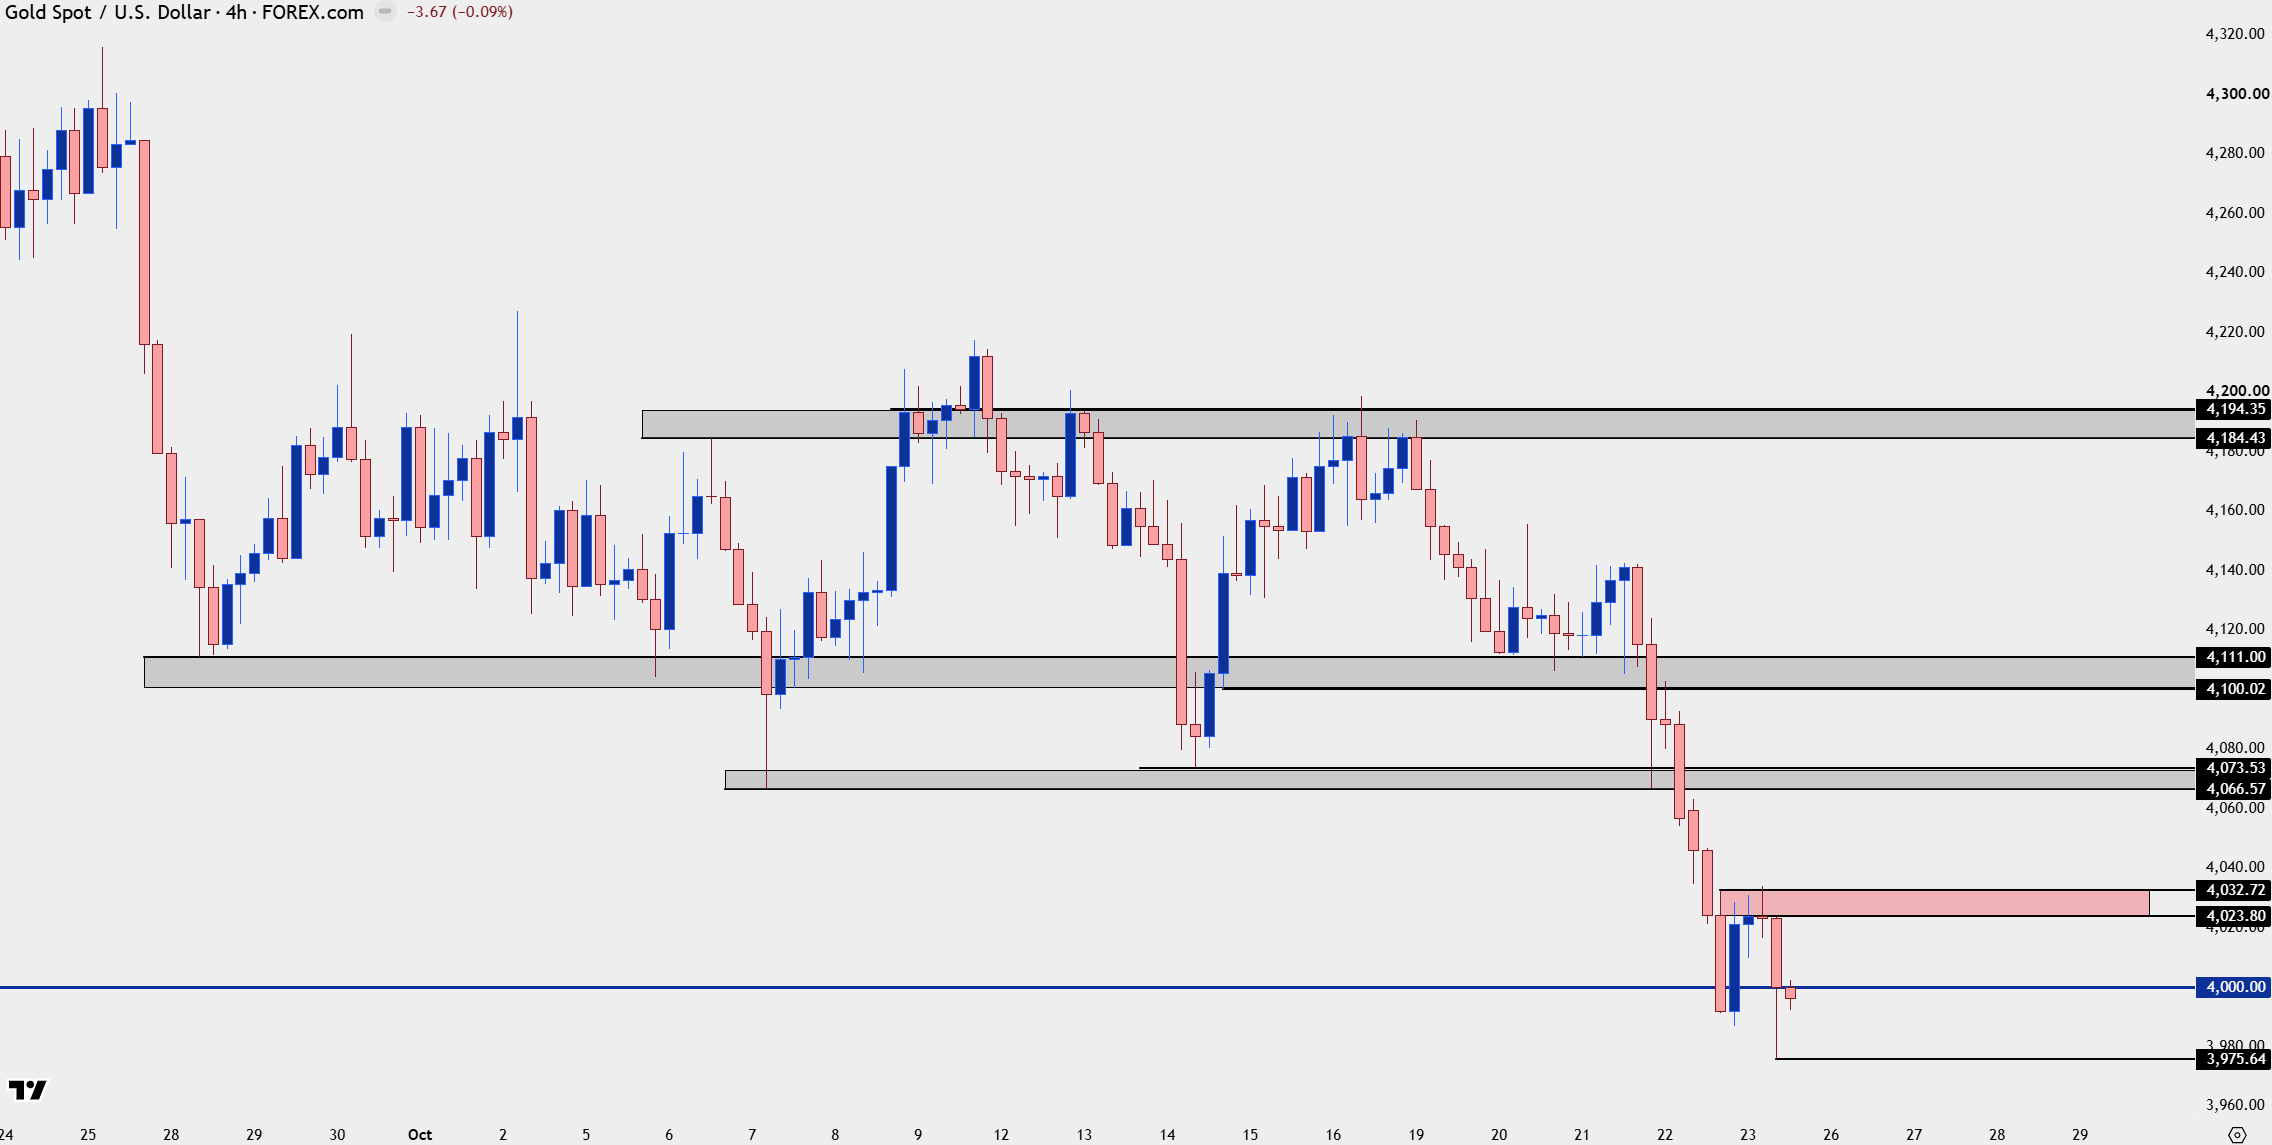
Chart prepared by James Stanley; data derived from Tradingview
--- written by James Stanley, Senior Market Analyst, Global Macro
Latest market news




Open an account in minutes
Experience award-winning platforms with fast and secure execution, and enjoy tight spreads from 0.5 pts on FX and 0.3 pts on indices.
Economic calendar
Web Trader platform
Our sophisticated web-based platform is packed with features.
Related articles

Gold Does Something it Hasn’t Done in a Year, is Larger Risk-Off Afoot?
With tech stocks getting hit harder last week there was collateral damage elsewhere, including gold as the metal closed below the $4k level for the week and that’s the first time that’s happened to spot gold in more than a year.
USD/JPY Weekly Outlook: AI earnings could overshadow the Fed and BoJ
AI sentiment has become a major driver of US Treasury yields and USD/JPY. With Microsoft, Alphabet and Amazon reporting this week, central bank decisions may have competition for traders' attention.

US Dollar Price Action Setups: EUR/USD, USD/JPY, GBP/USD, USD/CAD
The Dollar is working on its second consecutive red week and while sellers didn’t exactly pounce on fresh lows, there’s an opening door for bears to make a move.
This report is intended for general circulation only. It should not be construed as a recommendation, or an offer (or solicitation of an offer) to buy or sell any financial products. The information provided does not take into account your specific investment objectives, financial situation or particular needs. Before you act on any recommendation that may be contained in this report, independent advice ought to be sought from a financial adviser regarding the suitability of the investment product, taking into account your specific investment objectives, financial situation or particular needs.
StoneX Financial Pte. Ltd., may distribute reports produced by its respective foreign entities or affiliates within the StoneX group of companies or third parties pursuant to an arrangement under Regulation 32C of the Financial Advisers Regulations. Where the report is distributed to a person in Singapore who is not an accredited investor, expert investor or an institutional investor (as defined in the Securities Futures Act), StoneX Financial Pte. Ltd. accepts legal responsibility to such persons for the contents of the report only to the extent required by law. Singapore recipients should contact StoneX Financial Pte. Ltd. at 6826 9988 for matters arising from, or in connection with the report.
In the case of all other recipients of this report, to the extent permitted by applicable laws and regulations neither StoneX Financial Pte. Ltd. nor its associated companies will be responsible or liable for any loss or damage incurred arising out of, or in connection with, any use of the information contained in this report and all such liability is hereby expressly disclaimed. No representation or warranty is made, express or implied, that the content of this report is complete or accurate.
StoneX Financial Pte. Ltd. is not under any obligation to update this report.
Trading CFDs carries a high level of risk that may not be suitable for some investors. Consider your investment objectives, level of experience, financial resources, risk appetite and other relevant circumstances carefully. The possibility exists that you could lose some or all of your investments, including your initial deposits. If in doubt, please seek independent expert advice. Visit www.forex.com/en-sg/terms-and-policies for the complete Risk Disclosure Statement.