




Gold Forecast: Gold Bull Pennant Breakout to Fresh ATHs
Gold prices broke out of a second bull pennant and now sit more than 80% above last year’s lows. The CPI and PPI reports next week could present opportunity for bullish continuation scenarios.
Share this:

Gold Talking Points:
- While gold has been in a parabolic-like move ever since Jerome Powell’s speech at Jackson Hole, last week saw the move take on a new degree of strength as price aggressively broke-above the $3500/oz level.
- There’s been only a minimum of pullback in the move so far after gold spent four months brewing the bull pennant, quite similar to the two months to finish last year when a similar formation set up into the 2025 breakout.
- Gold prices are now 80% above last year’s low, which has largely been pushed by a dovish FOMC even as inflation has remained high. If we do see the Fed pare back rate cut expectations at their September meeting, there could perhaps be pullback potential, but for full on reversals, it would seem a hawkish turn from the FOMC is not currently nearby.
Gold prices have been in a massive bull trend now for the past year and a half, with the metal gaining more than 80% over that span of time. That move has been followed closely in these articles, as seemingly small items have led to large rallies, with the source going back to an episode back in February of last year.
On February 13th of last year, US CPI was released to a larger than expected print. And that wasn’t the first above-expectation CPI print that was seen around that time, and worry had begun to build that the Fed might not be able to cut rates later in the year like markets had been expecting.
Up to that point, gold held support above the $2k/oz level, which was resistance until December of the year prior. But as the Fed highlighted rate cuts on the way in late 2023, gold was finally able to push above that vaulted psychological level, and for the first month and a half of 2024 trade, that price had become support. Until the CPI release in February, that is.
Suddenly, gold prices pushed below the big figure and that day of February 13th was the first daily close below the $2k/oz level. A day later, Chicago Fed President, a widely-watched Fed figure had a statement seemingly dismissing the CPI print, saying something along the lines of ‘lets not get all flipped out about a single inflation print.’
A day later gold jumped back above the $2k/oz level, and in the almost nineteen months since it hasn’t traded below that price. That comment helped to trigger a massive rally in gold that’s only paused for a couple of points along the way.
Gold Daily Chart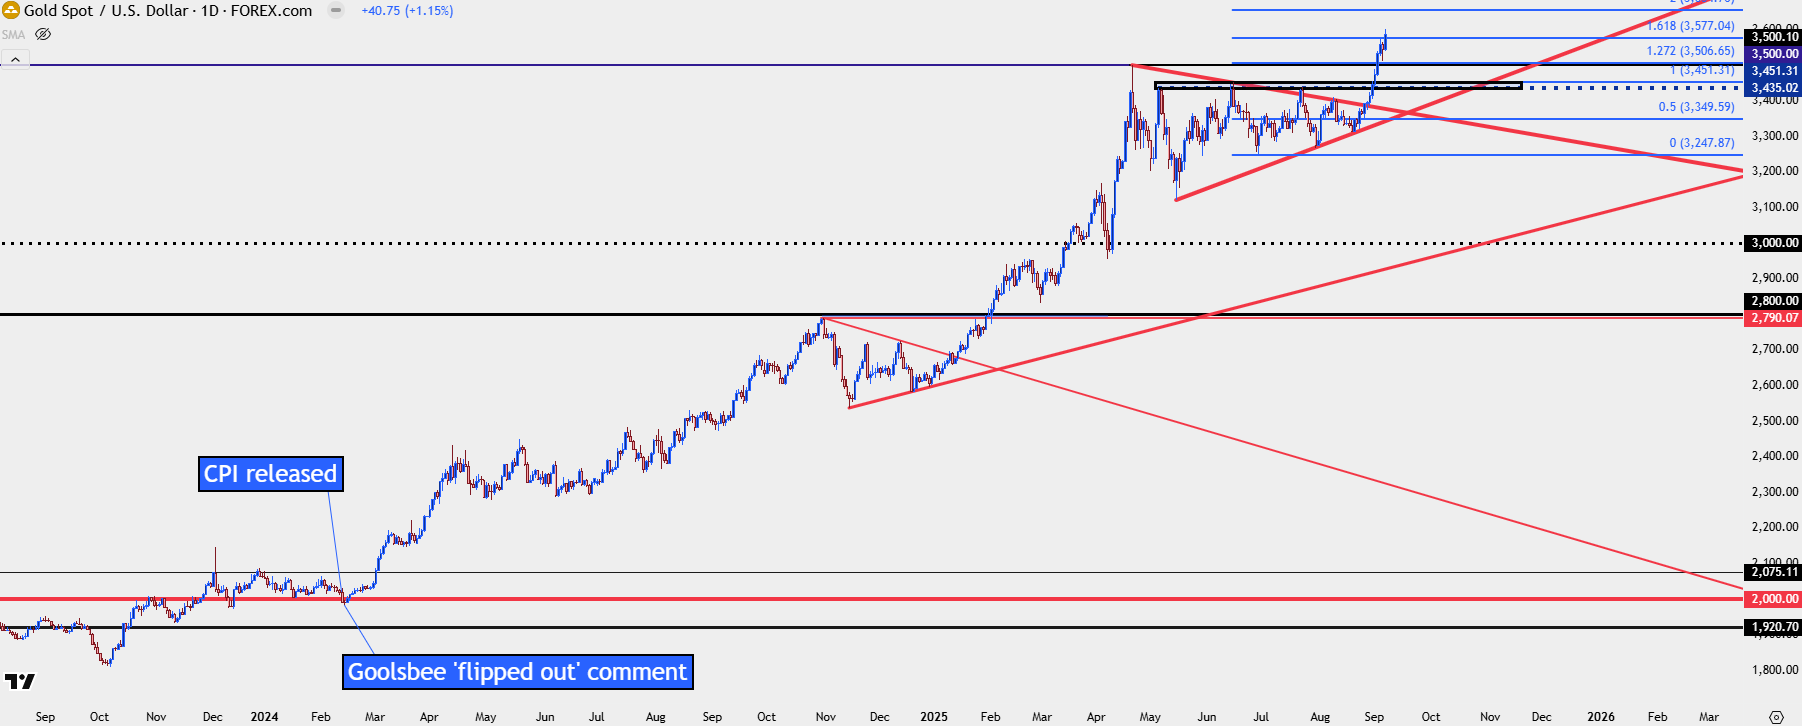
Chart prepared by James Stanley; data derived from Tradingview
Interestingly it was the Presidential election last year that seemed to give gold bulls a reason for pause. More likely, this had something to do with anti-fiat and anti-USD flows pushing into cryptocurrencies as a crypto-friendly president had just been elected into office.
While the gold rally did pause for the final two months of 2024, it didn’t go away completely; and as a matter of fact, with a rally like we saw earlier in the year, normally there would be larger motive for profit taking. That didn’t really happen though as bulls came into show support at increasingly higher-lows, making for a symmetrical triangle that made up a bull pennant formation.
As we came into 2025, bulls began to push again, and the breakout extended, this time, running up to the $3500/oz level in April, at which point a similar pause began to show.
This time, the symmetrical triangle built over a four-month period, and that lasted all the way until two weeks ago. It was the combined force of Powell’s speech at Jackson Hole along with the reaction to the Core PCE print that helped gold bulls to finally take out the $3500 level, and that’s since led into a continued breakout into this week.
Gold Daily Chart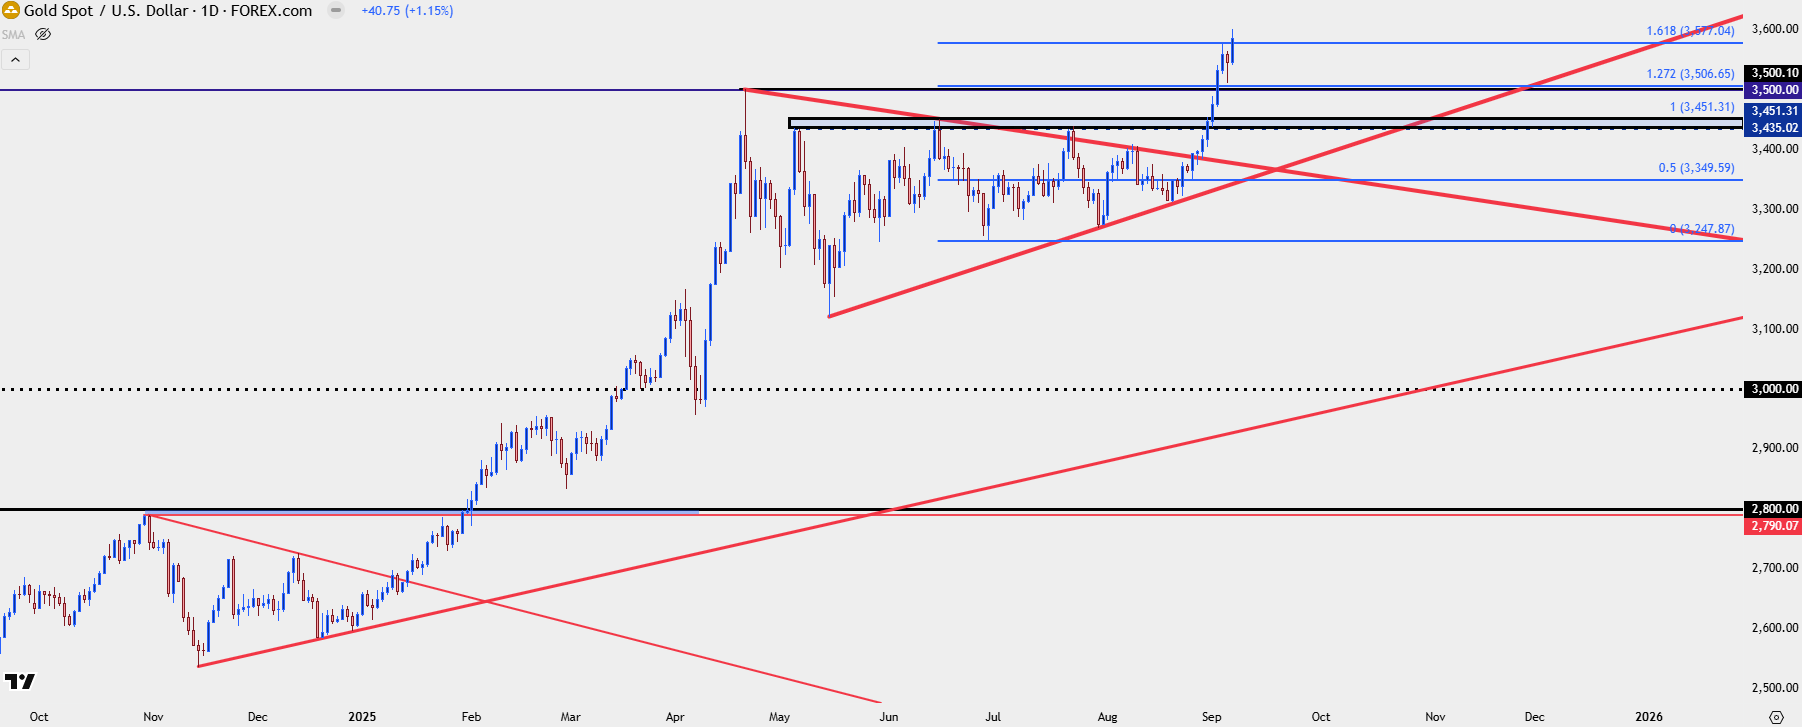
Chart prepared by James Stanley; data derived from Tradingview
Gold - What’s Behind the Push
Gold is a non-yielding asset, and that can actually be a strength. When rates are low but inflation is high, holding yield-based assets like bonds isn’t very attractive, as the income produced is losing more and more purchasing power. When the Fed cuts rates even with inflation being high, gold can be an attractive safe harbor – and this is at least part of the reason why gold prices began to rally last year when Austan Goolsbee seemed reticent to temper hopes for rate cuts even with inflation remaining extremely high.
To be sure, USD-weakness can play to the long side of gold as gold is priced in USD, and like pair-based markets like spot FX, that can have a mathematical effect where a weaker USD means a stronger net value of the function, as a whole.
But if we’re in a backdrop where there’s dilution being expected across a swath of fiat currencies, like the USD and Euro at the same time, that impact may not be as noticeable in the EUR/USD quote. But for gold? Well, gold becomes an attractive place for capital to flow to avoid the dilutionary impact of higher inflation and lower rates.
That said – this is still a market, and while a market can remain irrational for a while, it also doesn’t make it smart to just leap in and hope that matters work out. This is where the rubber meets the road with gold, at the moment, as the metal has flung so far beyond any recent resistance points that it’s difficult to catch.
What investors can do, however, is try to be patient. This does risk missing out on continuation setups, but that can potentially be seen as more attractive than getting caught buying a top. With next week’s PPI and CPI data, there’s opportunity for rate expectations in the US to pare back a bit. If we see headline CPI cross above 3% and Core CPI jump above last month’s 3.1%, the 150 bps of cuts priced into the end of next year suddenly become a daunting prospect, and perhaps this could be reason for gold bulls that have held on through the breakout to take profits.
This is where support could come into play and that would be one way for an investor or trader to move forward on gold right now, that would eliminate the need to chase a parabola. At this point, there’s a number of spots to look for support to develop at, such as the $3500 level that was resistance back in April but, to date, hasn’t been tested as support. Or, perhaps, the $3435-$3451 zone that was resistance three different times until the breakout after Core PCE.
Gold Daily Chart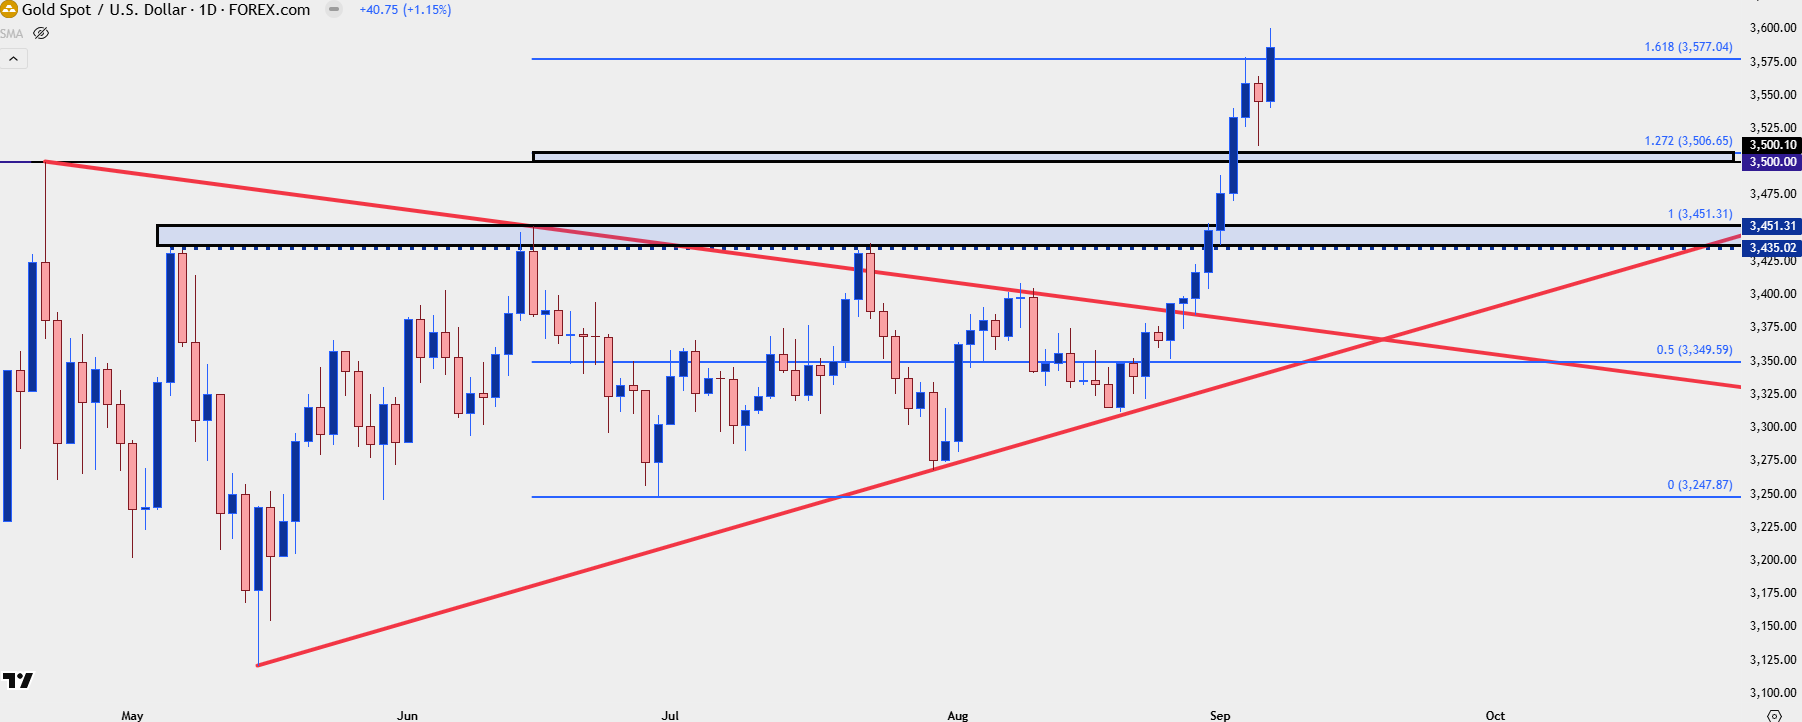
Chart prepared by James Stanley; data derived from Tradingview
--- written by James Stanley, Senior Strategist
Related tags:



Open an account in minutes
Experience award-winning platforms with fast and secure execution, and enjoy tight spreads from 0.5 pts on FX and 0.3 pts on indices.
Economic calendar
Web Trader platform
Our sophisticated web-based platform is packed with features.
Related articles

USD/JPY Buyers Continue to Bid Support – but Can They Force a Breakout?
USD/JPY has been pushed from the top of the headlines as a meltdown in the Euro has stolen attention from FX markets, but with USD at a fresh yearly high the USD/JPY pair retains bullish structure, and there’s the very real question now as to whether a defense of the 160.00 level would be possible given the macro backdrop.

Gold Builds Range After Descending Triangle Breakdown
Gold prices started last week in a violent manner, but since setting a low last Tuesday prices have been range-bound, begging the question as to whether a reversal might be nearby.

Gold outlook: Inflation, oil and yields keep downside risks elevated
With inflation still the Federal Reserve’s main concern and elevated oil prices keeping pressure on bond yields, the near-term gold outlook remains tilted to the downside, even if the longer term view remains constructive.

This report is intended for general circulation only. It should not be construed as a recommendation, or an offer (or solicitation of an offer) to buy or sell any financial products. The information provided does not take into account your specific investment objectives, financial situation or particular needs. Before you act on any recommendation that may be contained in this report, independent advice ought to be sought from a financial adviser regarding the suitability of the investment product, taking into account your specific investment objectives, financial situation or particular needs.
StoneX Financial Pte. Ltd., may distribute reports produced by its respective foreign entities or affiliates within the StoneX group of companies or third parties pursuant to an arrangement under Regulation 32C of the Financial Advisers Regulations. Where the report is distributed to a person in Singapore who is not an accredited investor, expert investor or an institutional investor (as defined in the Securities Futures Act), StoneX Financial Pte. Ltd. accepts legal responsibility to such persons for the contents of the report only to the extent required by law. Singapore recipients should contact StoneX Financial Pte. Ltd. at 6826 9988 for matters arising from, or in connection with the report.
In the case of all other recipients of this report, to the extent permitted by applicable laws and regulations neither StoneX Financial Pte. Ltd. nor its associated companies will be responsible or liable for any loss or damage incurred arising out of, or in connection with, any use of the information contained in this report and all such liability is hereby expressly disclaimed. No representation or warranty is made, express or implied, that the content of this report is complete or accurate.
StoneX Financial Pte. Ltd. is not under any obligation to update this report.
Trading CFDs carries a high level of risk that may not be suitable for some investors. Consider your investment objectives, level of experience, financial resources, risk appetite and other relevant circumstances carefully. The possibility exists that you could lose some or all of your investments, including your initial deposits. If in doubt, please seek independent expert advice. Visit www.forex.com/en-sg/terms-and-policies for the complete Risk Disclosure Statement.