


USD/JPY Buyers Continue to Bid Support – but Can They Force a Breakout?
USD/JPY has been pushed from the top of the headlines as a meltdown in the Euro has stolen attention from FX markets, but with USD at a fresh yearly high the USD/JPY pair retains bullish structure, and there’s the very real question now as to whether a defense of the 160.00 level would be possible given the macro backdrop.
Share this:

USD/JPY Talking Points:
- While USD/JPY was the big deal from July through September, more recently it’s the meltdown in the Euro, driven by the moves in sovereign bond markets that’s started to get more attention.
- While USD is at a fresh yearly high, USD/JPY is still well below it’s yearly high and since the early-September swipe, the pair hasn’t yet re-tested the 160.00 handle.
It’s been a slow climb-higher in USD/JPY over the past three weeks and from the weekly chart, there remains a tonality shift ever since the dual intervention in late-July. So, it would be far too early to assume that the threat of sell-offs and unwind is completely gone and as the pair re-approaches the 160.00 handle, the very real question is whether or not policymakers will want to burn the dry powder to defend a lower-high.
At this point, US Treasury Secretary Scott Bessent’s gambit hasn’t really paid off. The comment when he said ‘I am the house,’ and daring markets to ‘bet against me if you want’ appeared very near the current low around the 153 handle. Since then, buyers have clawed back another 400-plus pips and each pullback has been bid.
The problem is one of resources, as US Treasury yields continue to spike the Treasury Secretary has his hands full elsewhere. The increased bond buybacks, while delivering a short dose of pullback in yields, are small compared to the issuance that’s due in the coming months. It simply hasn’t been enough to inspire market participants to want to hold bonds with the idea that the Treasury department will be able to arrest the climb in yields.
What ultimately could do that – the Fed – and another bond buying round, seems highly improbable with inflation where it’s at.
On the side of Japan, they have their own concern with inflation and their bond yields have been climbing, as well, just not to the same degree as what’s shown in the UST market. Ideally Japan would probably want a lower spot rate in USD/JPY but an actual intervention requires capital, which, traditionally, means selling Treasuries. That additional supply would mean lower prices and higher yields and this explains why Scott Bessent became so concerned with the matter in the first place.
So, there is a conundrum of sorts, and the consequences could be massive. We can see trepidation in the USD/JPY market as buyers have pulled back from fresh highs and the inflection points of the intervention two months ago at 164 and then the pointed intervention comments at 160.00 have remained untested.
Two weeks ago, following the Bank of Japan’s rate hike when the BoJ failed to provide any timing on their next move, USD/JPY broke out and ran up to 159.00. This, again, elicted comments regarding intervention that helped prices to pullback. But, just as I had looked at around the time, this was still a ‘buy the dip’ setup for bulls as the fundamental bias remained decisively-tilted to the long side of the pair.
USD/JPY Daily Chart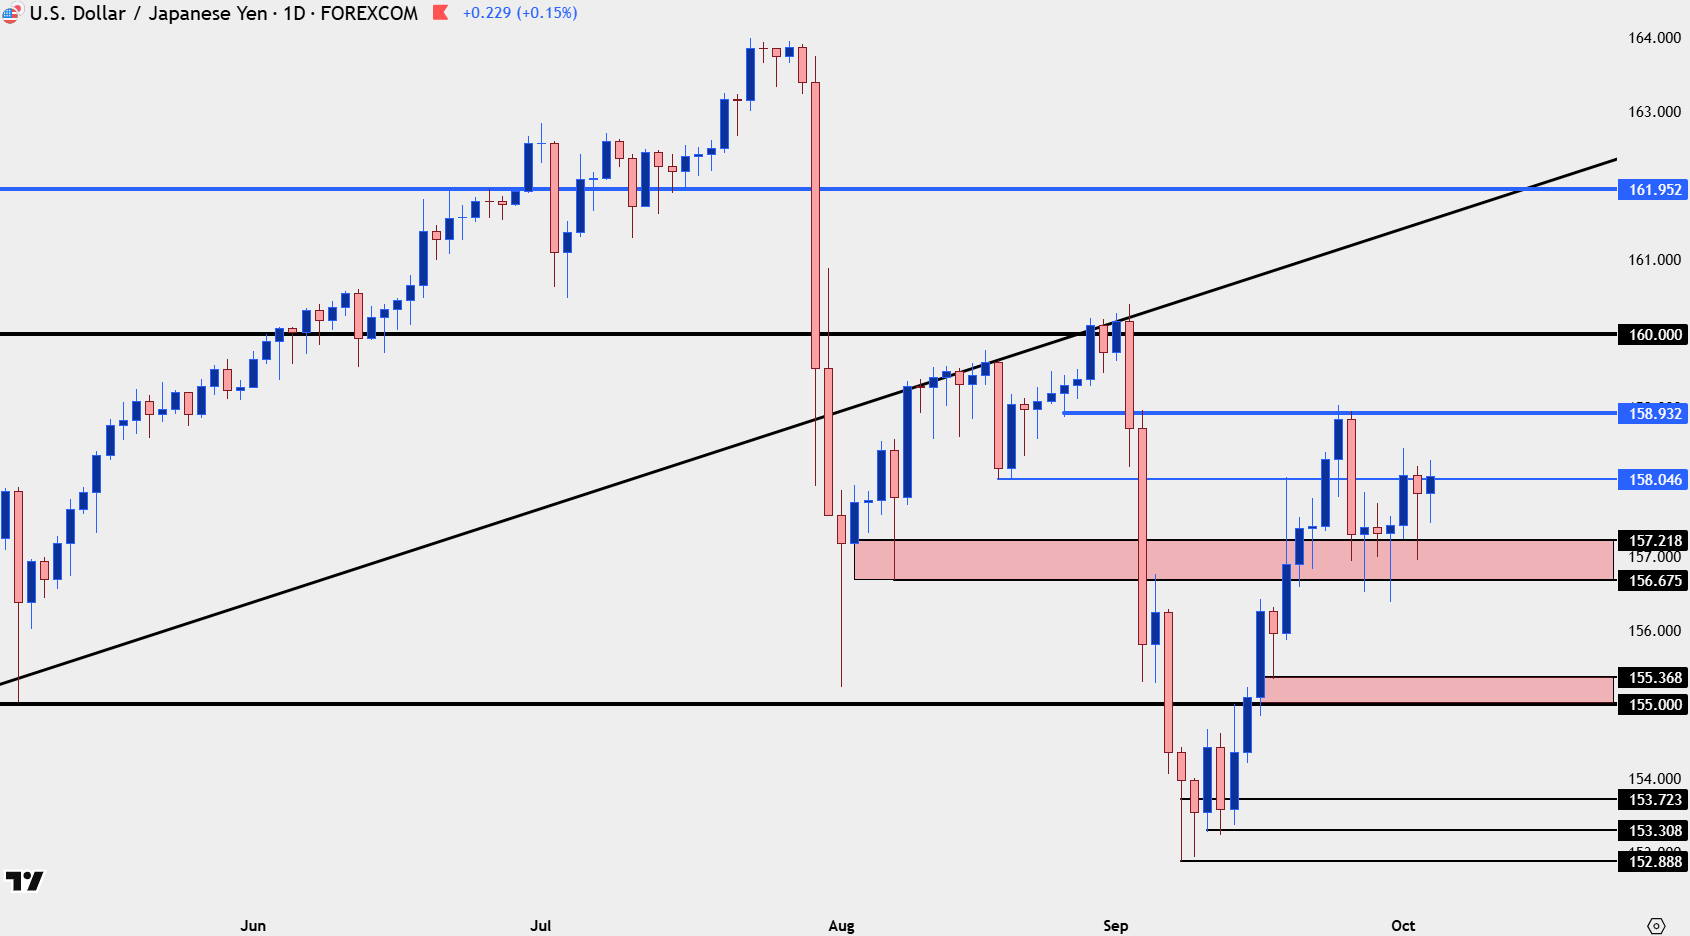
Chart prepared by James Stanley; data derived from Tradingview
USD/JPY Support
The 156.69-157.22 zone is a familiar one, and it was tested for support for six consecutive days through last week’s close. The underside wicks on the above daily chart show how well that zone was defended by buyers during pullbacks, and that sets up for a higher-low.
The next challenge is the prospect of a higher-high. The last time the pair was at 159.00, it got some pointed comments from policymakers. And I think they were looking around the next corner, and trying to get in the headlines before a 160 print, which I expect to be a more important line-in-the-sand, at this point.
But, for now, I’d be cautious in looking for breakouts beyond 159.00 and, instead, look to factor resistance targets around the premise of that level providing at least a pause for upside rallies. This would also mean that a pullback could be a more ideal way to address the matter, rather than chasing when price is so close to that line-in-the-sand.
From the four-hour chart below, I’ve added the 157.50 psychological level, and the 157.22 level would still be viable as a higher-low, above the swing low from last Thursday.
USD/JPY Four-Hour Chart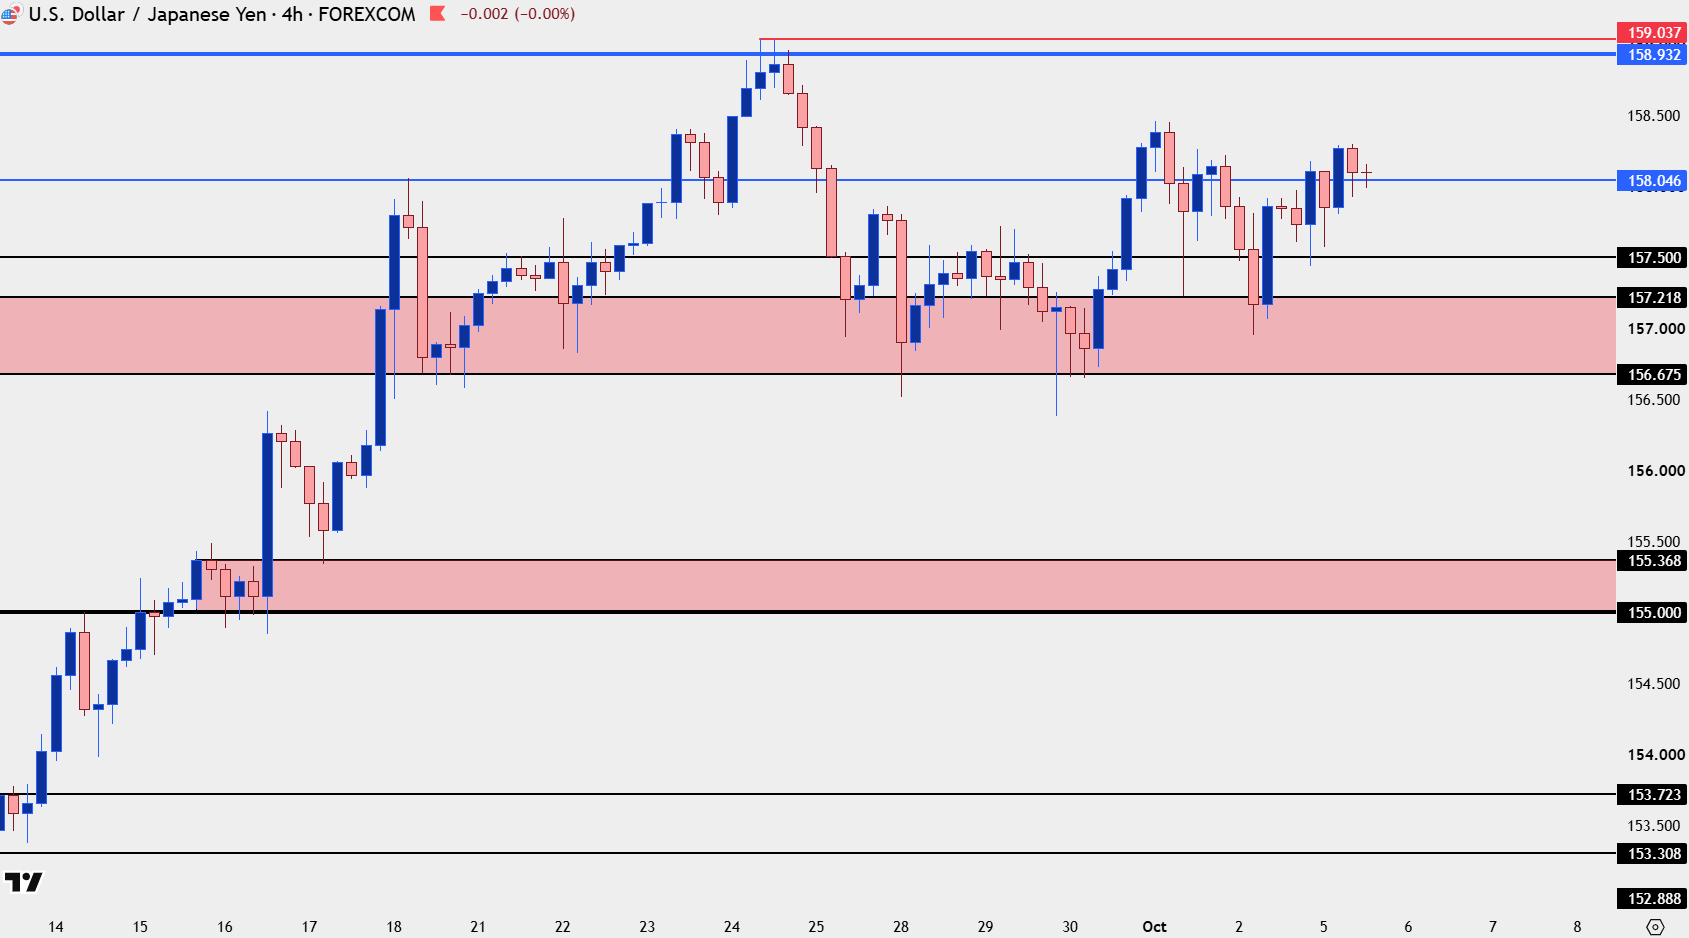
Chart prepared by James Stanley; data derived from Tradingview
--- written by James Stanley, Senior Market Analyst, Global Macro
Related tags:



Open an account in minutes
Experience award-winning platforms with fast and secure execution, and enjoy tight spreads from 0.5 pts on FX and 0.3 pts on indices.
Economic calendar
Web Trader platform
Our sophisticated web-based platform is packed with features.
Related articles
USD/JPY Buyers Continue to Bid Support – but Can They Force a Breakout?
USD/JPY has been pushed from the top of the headlines as a meltdown in the Euro has stolen attention from FX markets, but with USD at a fresh yearly high the USD/JPY pair retains bullish structure, and there’s the very real question now as to whether a defense of the 160.00 level would be possible given the macro backdrop.

Gold Builds Range After Descending Triangle Breakdown
Gold prices started last week in a violent manner, but since setting a low last Tuesday prices have been range-bound, begging the question as to whether a reversal might be nearby.

USD/JPY Analysis: NFP Eases Fed Concerns and the Yen Fails to Respond
Indecision continues to be a defining feature of the yen's recent price action. This can be seen in USD/JPY, which has posted average fluctuations of just 0.4% over the last three trading sessions, failing to establish a clear direction and reinforcing an increasingly evident neutral bias.

This report is intended for general circulation only. It should not be construed as a recommendation, or an offer (or solicitation of an offer) to buy or sell any financial products. The information provided does not take into account your specific investment objectives, financial situation or particular needs. Before you act on any recommendation that may be contained in this report, independent advice ought to be sought from a financial adviser regarding the suitability of the investment product, taking into account your specific investment objectives, financial situation or particular needs.
StoneX Financial Pte. Ltd., may distribute reports produced by its respective foreign entities or affiliates within the StoneX group of companies or third parties pursuant to an arrangement under Regulation 32C of the Financial Advisers Regulations. Where the report is distributed to a person in Singapore who is not an accredited investor, expert investor or an institutional investor (as defined in the Securities Futures Act), StoneX Financial Pte. Ltd. accepts legal responsibility to such persons for the contents of the report only to the extent required by law. Singapore recipients should contact StoneX Financial Pte. Ltd. at 6826 9988 for matters arising from, or in connection with the report.
In the case of all other recipients of this report, to the extent permitted by applicable laws and regulations neither StoneX Financial Pte. Ltd. nor its associated companies will be responsible or liable for any loss or damage incurred arising out of, or in connection with, any use of the information contained in this report and all such liability is hereby expressly disclaimed. No representation or warranty is made, express or implied, that the content of this report is complete or accurate.
StoneX Financial Pte. Ltd. is not under any obligation to update this report.
Trading CFDs carries a high level of risk that may not be suitable for some investors. Consider your investment objectives, level of experience, financial resources, risk appetite and other relevant circumstances carefully. The possibility exists that you could lose some or all of your investments, including your initial deposits. If in doubt, please seek independent expert advice. Visit www.forex.com/en-sg/terms-and-policies for the complete Risk Disclosure Statement.