





Gold Forecast: XAU/USD Slips Toward 3,300 as Ceasefire Calms Tensions
Gold prices have depreciated by more than 1.5% over the past two trading sessions, as market demand for safe-haven assets has diminished. For now, downward pressure on the precious metal remains steady.
Share this:

Gold prices have depreciated by more than 1.5% over the past two trading sessions, as market demand for safe-haven assets has diminished. For now, downward pressure on the precious metal remains steady, as the situation in the Middle East appears to have reached a tentative ceasefire agreement. As long as this agreement holds and continues to provide a sense of stability, selling pressure on XAU/USD could become more relevant in the short term.
What has happened with the Middle East conflict?
After twelve consecutive days of fighting, U.S. diplomatic pressure has helped broker a rapid ceasefire agreement between Iran and Israel, announced on June 24. Although tensions remain and both sides continue exchanging threats, the agreement has shown partial effectiveness so far, with both countries stating they will halt direct attacks.
Iran has expressed a willingness to negotiate on the condition that Israel refrains from further aggression and that clear terms are established. Notably, Iran also indicated its openness to resume nuclear talks with the United States. This stance was unexpectedly moderate, and markets welcomed the move, which had not been anticipated in the short term. As a result, the spotlight has now shifted toward diplomacy, and the United States will play a key role in steering this toward a real solution.
Still, it is important to note that the ceasefire is perceived as fragile, given the ongoing wave of mutual accusations between Iran and Israel. A strong diplomatic effort will be essential to prevent a new escalation, and it will be crucial to address deeper historical grievances between the two nations. Additionally, the conflict in Gaza remains active, which means full demilitarization in the region is far from a reality.
In this environment, gold has played a critical role. At the onset of the conflict, as uncertainty spiked, gold was heavily demanded as a safe haven, serving as a shield for capital in risk-off scenarios. Now that tensions have eased somewhat, gold has lost part of that appeal, becoming one of the catalysts behind the recent bearish pressure. However, the situation remains fragile, and gold has proven sensitive to renewed geopolitical tension. Should the ceasefire collapse and uncertainty return in the coming days, gold may once again benefit from a surge in demand, potentially reviving currently dormant buying pressure.
Sentiment behavior
The Fear and Greed Index, provided by CNN, has risen again and remains steadily within the "greed" zone, currently reading 63 points. In recent trading sessions, it has shown a consistent rebound, supported by the easing of the Middle East conflict, contributing to a gradual recovery in investor confidence.
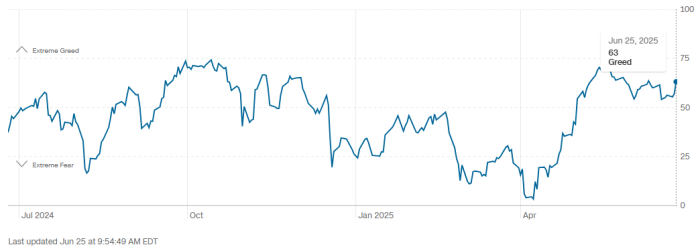
Source: CNN
The index suggests that perceived financial market risk is decreasing, reducing the appeal of safe-haven assets like gold and redirecting investor interest toward risk assets. As a result, gold has temporarily fallen out of favor. If this confidence trend continues in the coming sessions, it could become a negative factor for gold, potentially reinforcing further short-term selling pressure.
Gold Technical Outlook

Source: StoneX, Tradingview
- Lateral range begins to form: Although the long-term upward trendline remains intact, buying momentum has not been sufficient to break decisively above historical highs. Recent price movements have resulted in a clearer sideways range between $3,400 and $3,200 per ounce, signaling a possible shift toward technical neutrality in the short term.
- RSI: The RSI indicator has dropped to the 50 level, signaling a balance between supply and demand. This reflects the lack of a dominant market impulse. As long as RSI hovers near this level, indecision may continue, with gold remaining directionless.
- MACD: The MACD histogram shows slight bearish momentum, staying just below the zero line. Moving averages are also trending neutral, and unless the histogram begins to diverge meaningfully from the center, the chart is likely to preserve a state of broad indecision, with markets awaiting a clear catalyst.
Key levels to watch:
- $3,400 – Major resistance: This level marks the recent highs and the ceiling of the current range. A clear breakout would open the door to new all-time highs and revive long-term bullish sentiment.
- $3,300 – Current barrier: A psychological level that has served as the mid-point of the consolidation channel. Price action around this zone could prolong the sideways phase and delay market direction.
- $3,200 – Critical support: This level represents recent lows and forms the floor of the range. A break below could endanger the current bullish structure and tilt momentum in favor of sellers. If support holds, however, the sideways pattern will remain dominant.
Written by Julian Pineda, CFA – Market Analyst
Follow him: @julianpineda25
Related tags:



Open an account in minutes
Experience award-winning platforms with fast and secure execution, and enjoy tight spreads from 0.5 pts on FX and 0.3 pts on indices.
Economic calendar
Web Trader platform
Our sophisticated web-based platform is packed with features.
Related articles

Gold Price Forecast: XAU/USD Plunges 12.4% Toward Critical Support 10 1 2026
Softer inflation has revived expectations for a Fed pause, but Friday’s payrolls could put gold’s recovery prospects to the test.


Gold Price Outlook: XAU/USD Resistance at $4200 Sets Up for NFP
It was a strong sell-off to start the week in gold and despite a Tuesday bounce, sellers are continuing to push following a resistance hit at the $4200 level.


Treasury Yields Lose Momentum as Energy ETF Retreats
The 10-year Treasury yield is testing a resistance zone respected since the 1920s, as bearish RSI divergence signals fading upside momentum.

This report is intended for general circulation only. It should not be construed as a recommendation, or an offer (or solicitation of an offer) to buy or sell any financial products. The information provided does not take into account your specific investment objectives, financial situation or particular needs. Before you act on any recommendation that may be contained in this report, independent advice ought to be sought from a financial adviser regarding the suitability of the investment product, taking into account your specific investment objectives, financial situation or particular needs.
StoneX Financial Pte. Ltd., may distribute reports produced by its respective foreign entities or affiliates within the StoneX group of companies or third parties pursuant to an arrangement under Regulation 32C of the Financial Advisers Regulations. Where the report is distributed to a person in Singapore who is not an accredited investor, expert investor or an institutional investor (as defined in the Securities Futures Act), StoneX Financial Pte. Ltd. accepts legal responsibility to such persons for the contents of the report only to the extent required by law. Singapore recipients should contact StoneX Financial Pte. Ltd. at 6826 9988 for matters arising from, or in connection with the report.
In the case of all other recipients of this report, to the extent permitted by applicable laws and regulations neither StoneX Financial Pte. Ltd. nor its associated companies will be responsible or liable for any loss or damage incurred arising out of, or in connection with, any use of the information contained in this report and all such liability is hereby expressly disclaimed. No representation or warranty is made, express or implied, that the content of this report is complete or accurate.
StoneX Financial Pte. Ltd. is not under any obligation to update this report.
Trading CFDs carries a high level of risk that may not be suitable for some investors. Consider your investment objectives, level of experience, financial resources, risk appetite and other relevant circumstances carefully. The possibility exists that you could lose some or all of your investments, including your initial deposits. If in doubt, please seek independent expert advice. Visit www.forex.com/en-sg/terms-and-policies for the complete Risk Disclosure Statement.