



Gold, Silver Stall as Dollar Refuses to Buckle
Precious metals are rangebound, the dollar is hanging tough and traditional macro signals have turned messy. The FOMC minutes may help determine which side breaks first.
Share this:

- Gold and silver consolidate after strong breakouts
- Historic drivers are sending conflicting signals
- DXY keeps holds firm despite stiffening macro headwinds
- FOMC minutes could spark range breakout
The bullish breakouts in gold and silver seen earlier this month have given way to a period of consolidation, suggesting traders are now waiting for the next catalyst to see whether the move extends or reverses.
With historic drivers nowhere to be seen right now, you can’t help but think the release of the minutes from the July FOMC meeting later Wednesday may provide the catalyst to spark the market out of its temporary funk.
Macro Signals Turn Muddled
The recent consolidation in precious metals may be explained in part by the breakdown in their usual relationships with historic macro drivers.
Source: TradingView, FOREX.com
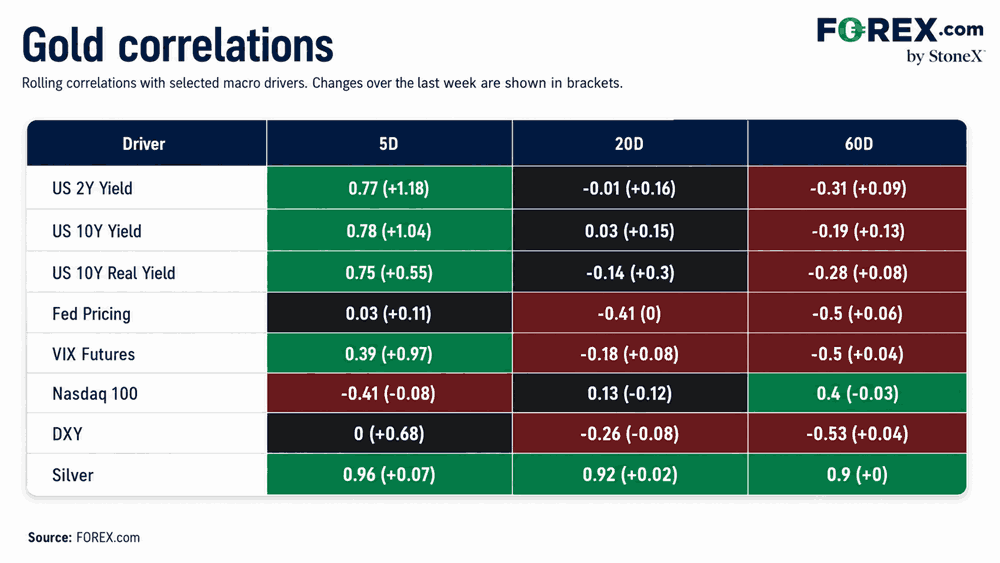
While a strong positive relationship between gold and silver remains firmly intact, with five-day correlations sitting at 0.96 respectively, beyond that, the message is one of total confusion.
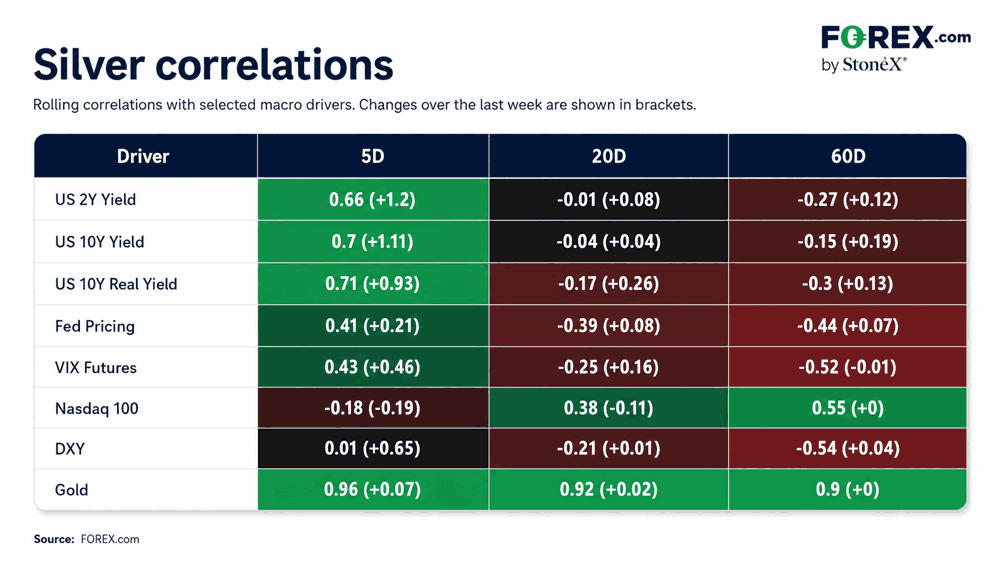
Over the past five days, gold has shown correlations of 0.77 with US two-year yields, 0.78 with 10-year yields and 0.75 with 10-year real yields. Silver tells much the same story at 0.66, 0.70 and 0.71 respectively. That is the exact opposite of what would normally be expected fundamentally.
Source: TradingView, FOREX.com
At the same time, there has been virtually no relationship with the US dollar, with five-day correlations sitting at 0.00 for gold and 0.01 for silver. Fed pricing has also offered little direction, while relationships with the Nasdaq 100 and VIX futures have been weak and contradictory.
Outside the tight relationship between gold and silver, the usual macro signals offer very little guidance on where precious metals want to go next.
Dollar Refuses to Buckle
Source: TradingView
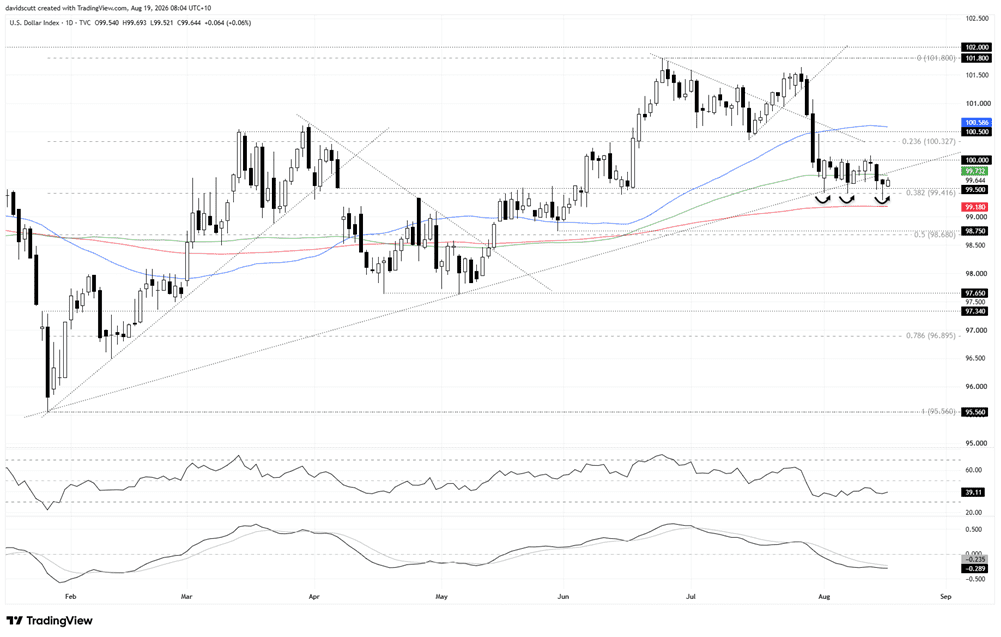
The lack of a relationship with the US dollar makes sense when looking at the DXY chart.
Despite being buffeted by negative headwinds this month, the dollar has continued to hang tough. While DXY has broken the uptrend in place from the January lows, it has been rangy over the past few weeks, attracting bids below 99.50 down to the 38.2% Fibonacci retracement of the January to June bull move, while offers have capped gains above 100.
That is notable given the role the dollar played in the precious-metals breakout earlier this month. As I discussed in the video below, the decline in DXY was an important contributor to the move in gold and silver, even if it could not fully explain its magnitude.
With the 50, 100 and 200-day moving averages flattening out, the dollar’s rangy price action may have stalled what was otherwise looking like a very promising breakout in precious metals.
This content was created by an affiliate of FOREX.com and represents the views and opinions of the author/speakers, not the views and opinions of FOREX.com, StoneX Group Inc., or its subsidiaries. The content has not been independently reviewed by FOREX.com.
Gold Breakout Gives Way to Consolidation
Source: TradingView
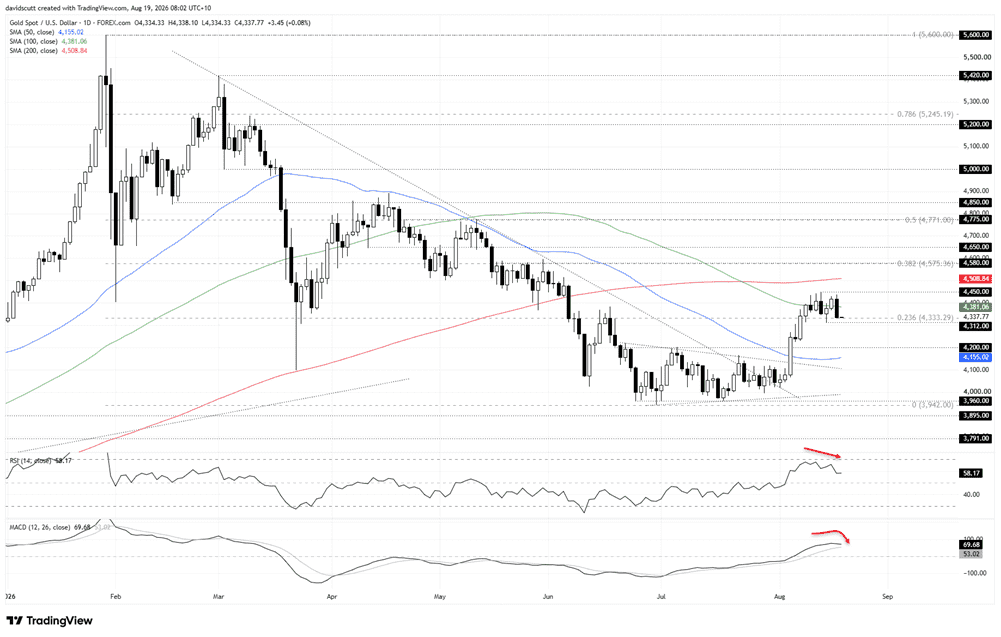
Having surged to as high as $4,450 an ounce following the breakout of the bearish trend from the January highs and wedge structure it had been coiling in since early June, gold has since consolidated .
The price has attracted bids from beneath the 23.6% Fibonacci retracement of the January to June bear move at $4,333, with this week’s low set at $4,312. With gains capped towards $4,450 overhead, that is the range traders should be focusing on right now.
On the topside, the 200-day moving average looms large for bulls. If broken cleanly, the 38.2% Fibonacci retracement of the January to June bear move lines up neatly with $4,580, a level that has also acted as both support and resistance this year. Those two levels screen as particularly important when it comes to gold’s longer-term trajectory.
Underneath, a break below $4,312 may open the door for a run back towards $4,200, the top of the breakout zone from earlier this month, with the 50-day moving average located just underneath.
The message from the oscillators is one of diminishing upside strength. RSI (14) is setting lower highs and lower lows and is now moving back towards the neutral 50 level. MACD, while holding in positive territory, is converging on the signal line.
The overall message is therefore a more cautious one for bulls rather than a green light for bears. While I like gold’s medium and longer-term prospects, nearer term I’m not beholden to one particular bias, putting greater emphasis on price action to drive my decision-making.
Silver Tests the Lower End of Range
Source: TradingView
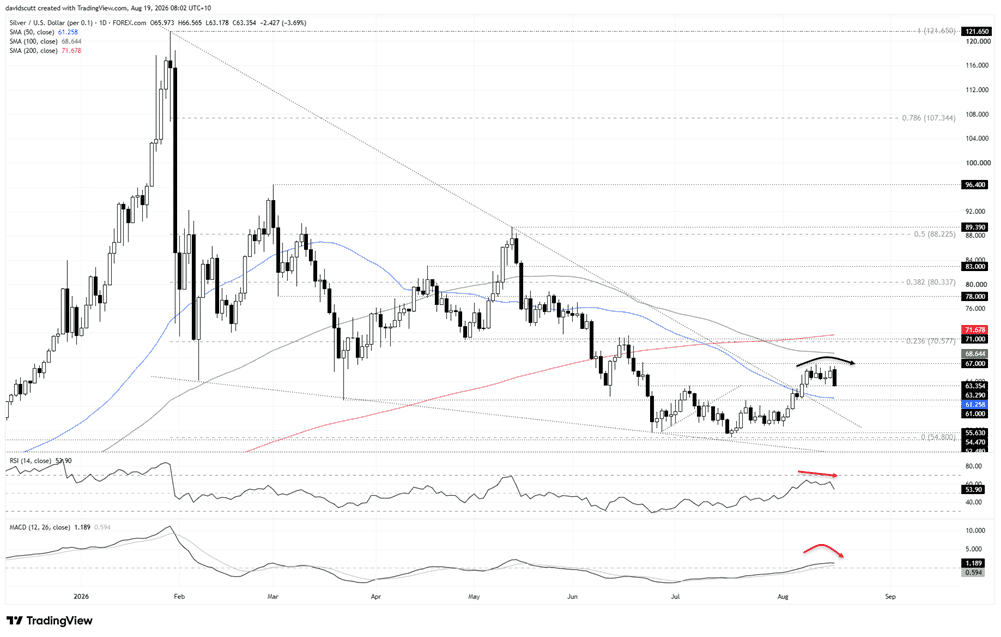
Like gold, the technical picture for silver is almost identical following the breakout of the bearish trend from the record high set in January this year.
Since then, we’ve seen a period of consolidation, with the price capped beneath resistance at $67 on the topside and support at $63.29 on the downside. However, Tuesday’s price action was a little more definitive than for gold, with a bearish engulfing candle printing, taking it back towards the lower end of the current range.
With RSI (14) setting lower highs and almost back at the neutral 50 level, and MACD rolling over and converging on the signal line while remaining in positive territory, silver feels heavy. That view is backed up by the string of noticeable upside wicks on the daily candles going back more than a week. As such, while the message from the oscillators is more neutral than bearish, in the near term playing silver from the short side comes across as more palatable.
That puts immediate emphasis on the 50-day simple moving average and $61, which now form the key support zone beneath the current range. A clean break beneath that zone would bring a potential retest of support between $55.63 and the mid-July low of $54.80 into focus.
Should support at $63.29 hold, the focus overhead would be $67, with the 100-day simple moving average and the resistance zone comprising the 23.6% Fibonacci retracement of the January to July bear move and 200-day moving average forming a far more important barrier overhead for bulls.
A break above the latter would point to a resumption of the prior breakout and put $78 resistance in focus.


Open an account in minutes
Experience award-winning platforms with fast and secure execution, and enjoy tight spreads from 0.5 pts on FX and 0.3 pts on indices.
Economic calendar
Web Trader platform
Our sophisticated web-based platform is packed with features.
Related articles
S&P 500, Nasdaq, Dow Forecast: Nasdaq Selloff Deepens as Dow Rally Stalls 10 24 2026
A failed S&P breakout and looming Nasdaq support test raise the stakes for next week’s Fed decision and October’s monthly close.

Gold Does Something it Hasn’t Done in a Year, is Larger Risk-Off Afoot?
With tech stocks getting hit harder last week there was collateral damage elsewhere, including gold as the metal closed below the $4k level for the week and that’s the first time that’s happened to spot gold in more than a year.


USD/JPY Weekly Outlook: AI earnings could overshadow the Fed and BoJ
AI sentiment has become a major driver of US Treasury yields and USD/JPY. With Microsoft, Alphabet and Amazon reporting this week, central bank decisions may have competition for traders' attention.
This report is intended for general circulation only. It should not be construed as a recommendation, or an offer (or solicitation of an offer) to buy or sell any financial products. The information provided does not take into account your specific investment objectives, financial situation or particular needs. Before you act on any recommendation that may be contained in this report, independent advice ought to be sought from a financial adviser regarding the suitability of the investment product, taking into account your specific investment objectives, financial situation or particular needs.
StoneX Financial Pte. Ltd., may distribute reports produced by its respective foreign entities or affiliates within the StoneX group of companies or third parties pursuant to an arrangement under Regulation 32C of the Financial Advisers Regulations. Where the report is distributed to a person in Singapore who is not an accredited investor, expert investor or an institutional investor (as defined in the Securities Futures Act), StoneX Financial Pte. Ltd. accepts legal responsibility to such persons for the contents of the report only to the extent required by law. Singapore recipients should contact StoneX Financial Pte. Ltd. at 6826 9988 for matters arising from, or in connection with the report.
In the case of all other recipients of this report, to the extent permitted by applicable laws and regulations neither StoneX Financial Pte. Ltd. nor its associated companies will be responsible or liable for any loss or damage incurred arising out of, or in connection with, any use of the information contained in this report and all such liability is hereby expressly disclaimed. No representation or warranty is made, express or implied, that the content of this report is complete or accurate.
StoneX Financial Pte. Ltd. is not under any obligation to update this report.
Trading CFDs carries a high level of risk that may not be suitable for some investors. Consider your investment objectives, level of experience, financial resources, risk appetite and other relevant circumstances carefully. The possibility exists that you could lose some or all of your investments, including your initial deposits. If in doubt, please seek independent expert advice. Visit www.forex.com/en-sg/terms-and-policies for the complete Risk Disclosure Statement.