



Gold Stalls at $3900 But Are Bulls Finished?
A trend like this is both difficult to chase but impossible to ignore, as spot gold rallies up to towards the psychologically important $4k/oz level.
Share this:

Gold Talking Points:
- It was another impressive week for gold as spot gold prices were up another 3.38%.
- The $3900 level has finally given some pause to the move and logically, the $4k/oz level sitting overhead is bringing some impact despite not having traded yet. But, is this something that can lead to anything more than a pullback in gold?
Gold has now gained for seven consecutive weeks. This is after the bull pennant breakout that triggered around Jerome Powell’s speech at Jackson Hole, and with little expectation for the Fed to abandon the rate cuts that markets have priced in – even with high inflation – there’s little reason to think that the fundamental drive behind the move is anywhere near over yet.
But, fundamentals aren’t a perfect push point for price, and we saw this twice already during gold’s 90% rally from last year’s lows. There was a two-month period towards the end of last year, and then the four month outlay after the high in April of this year. In each instance, a symmetrical triangle developed, both of which were highlighted in these articles. And when that symmetrical triangle came along with a previously strong bullish move, they could be further qualified as a bull pennant formation.
Both broke out with aggression as the Federal Reserve continued to lean on lower rates and looser monetary policy. But – we can also glean from each of those instances something that could be helpful in trying to forecast future price movements – and that’s the potential for a pause as gold pushes closer and closer to the psychological level at $4k an ounce.
Gold Daily Chart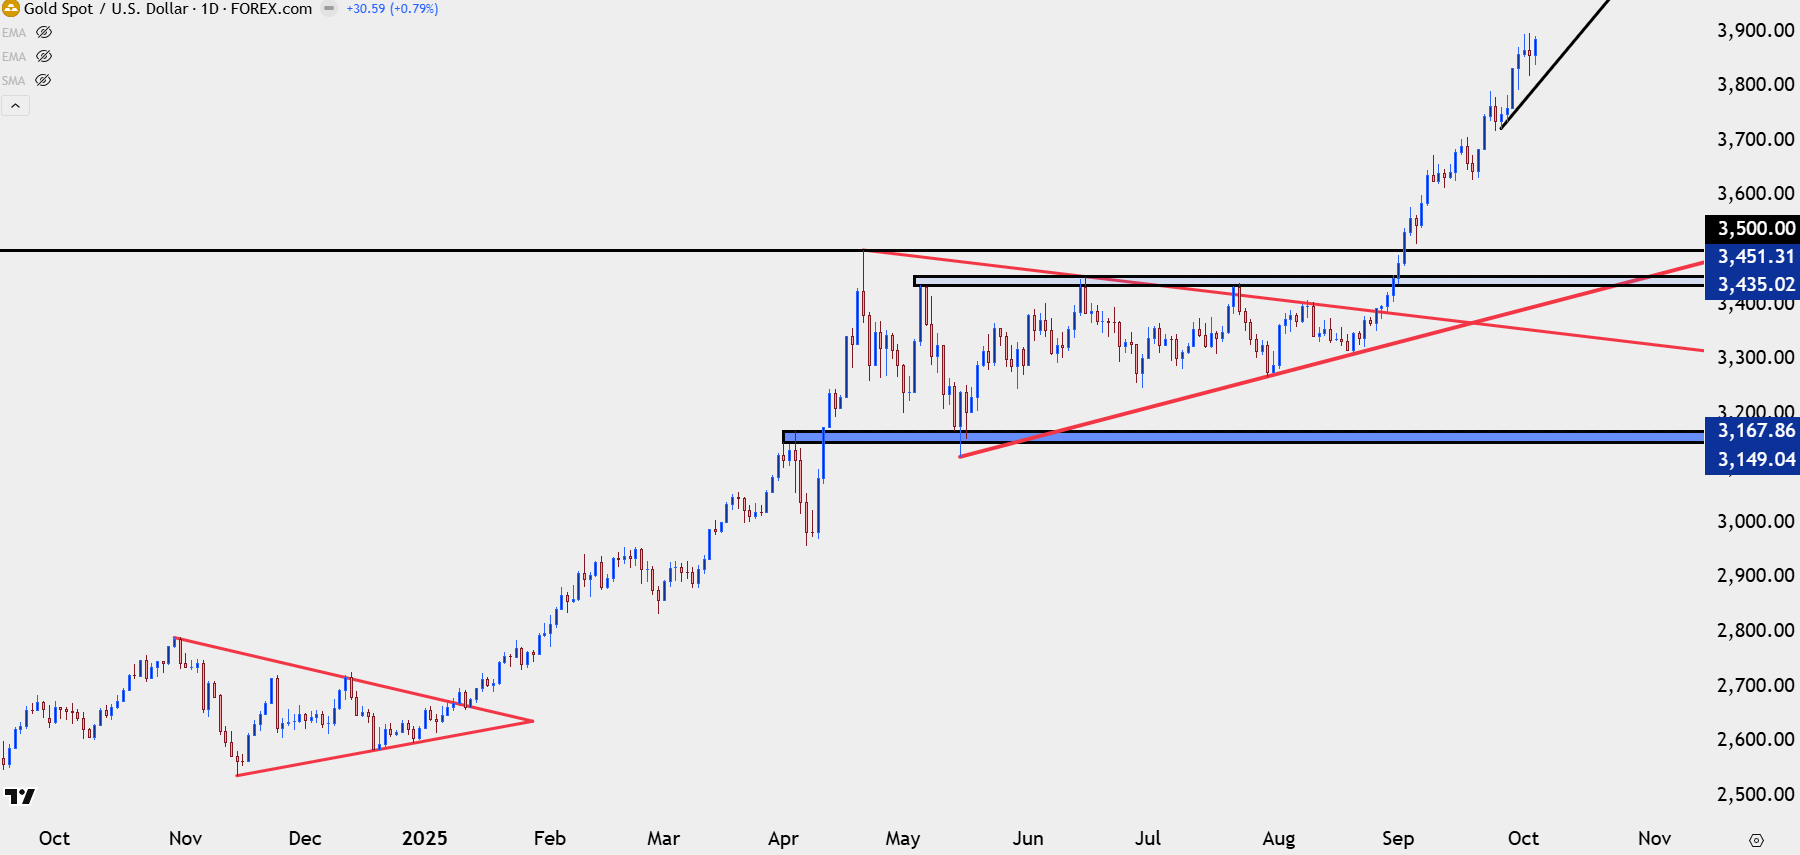
Chart prepared by James Stanley; data derived from Tradingview
Fundamentals don’t directly push prices in a true market environment.
In that backdrop, only buying and selling – supply and demand can do that. Now, fundamentals can influence supply and demand but it’s often going to be imperfect, because if anyone willing able or wanting to buy is already long, well even the best news in the world will fail to increase demand, because there’s simply no buyers left on the sidelines. The very deduction of price not moving higher on seemingly good news can instead be reason for longs to sell, which can create weakness and, in turn, more selling, as stops then get hit and longs are further influenced to pare positions even despite the otherwise ‘good news’ that one would expect to have led to increased prices.
A good example of this is what happened back in the summer of 2020.
At the time, the Fed was full pedal to the floor with monetary policy, to the point that stocks were thrusting to fresh all-time-highs even as the global economy remained shut down. This got gold up to its first ever test of the $2k psychological level. The trend at the time was near-parabolic, similar to what’s shown more recently, but that $2k level sent buyers into a tailspin.
At that point, Bitcoin was struggling to get back over the $12k marker and it’s almost as if capital flows shifted from gold and into cryptocurrencies, with gold then going into a range for the next three-and-a-half years, with an obedient hold of resistance right around that $2k/oz level.
That lasted into 2024, at which point gold began to find support on that price and there were just two days in which prices closed below $2k. But, a comment from Chicago Fed President Austan Goolsbee sent gold prices back above the big figure – and they never looked back. That was no almost 100% ago as gold gets closer and closer to the $4k handle.
Gold Weekly Chart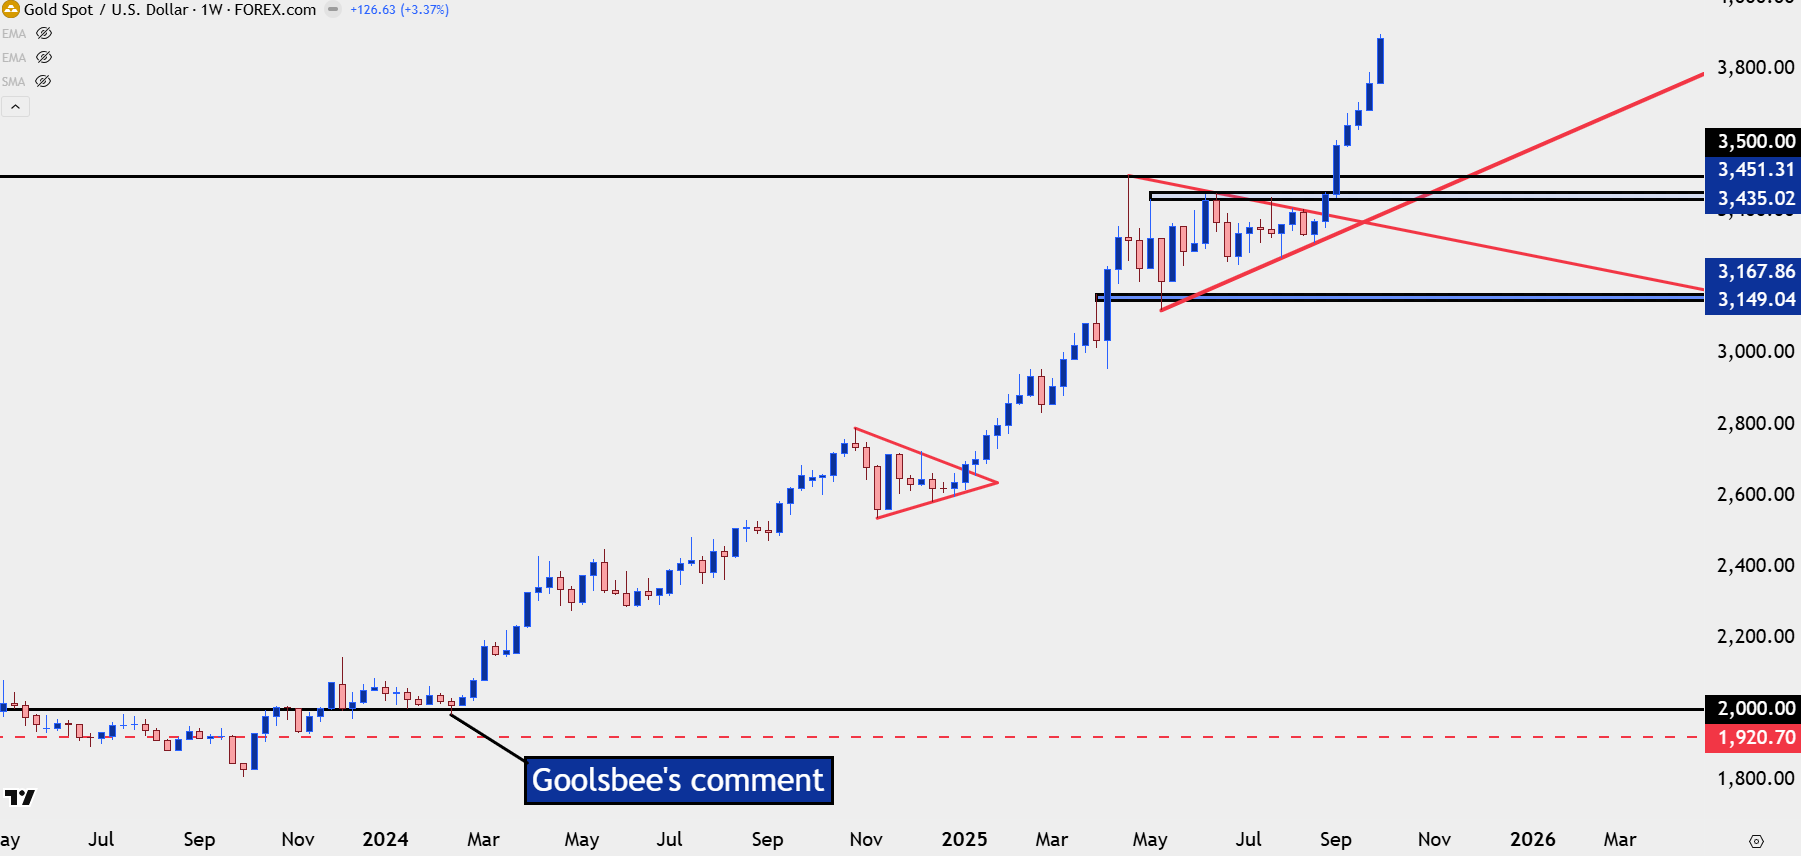
Chart prepared by James Stanley; data derived from Tradingview
Gold Near-Term Strategy
At this point the trend in gold is difficult to chase. But it’s also impossible to ignore. As I’ve been saying for months, I have little interest in the short side of gold, even if a pullback does show up. To get bearish on gold, I’ll need to see a convincing argument that the trend is ready to show anything more than a pullback, and to date, that argument hasn’t presented itself.
Instead, the $4k level may serve in a role like $3500, or perhaps even $2k. And if we look at the bull pennant that set up last year, I think the argument could even be made that it was anticipation of the $3k/oz level that helped to dissuade bulls from chasing the move in November and December.
So, for now, the look is on pullbacks to support and if we do get a bearish sequence on the daily before a test of the $4k handle, then perhaps the door opens to a larger pullback that could bring into play a support test at $3500, which notably still hasn’t happened yet.
On a short-term basis, there’s support potential at $3871 and $3854, after which $3831 comes into play. I’m looking at the $3791-$3800 zone as a significant decision point, and if bears can break through that, the door opens for that larger pullback scenario. I would still hesitate to get into a bearish stance, and, instead, would simply look for a larger pullback towards prior zones around $3738-$3759 or around the $3700 level.
Gold Four-Hour Chart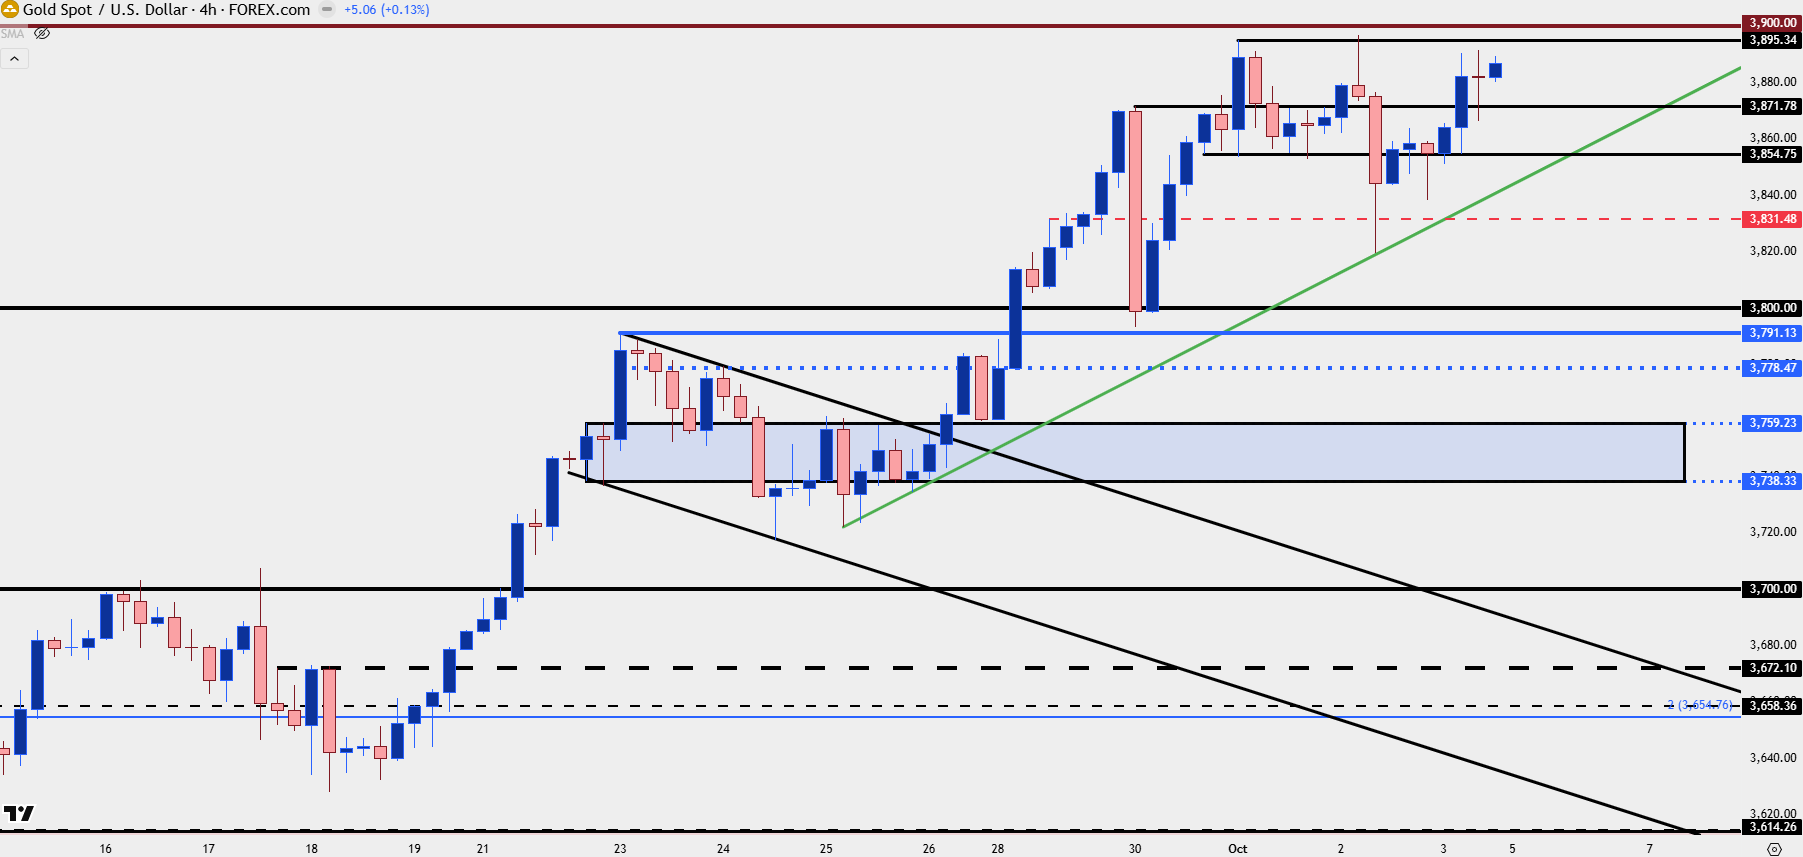
Chart prepared by James Stanley; data derived from Tradingview
--- written by James Stanley, Senior Strategist
Related tags:



Open an account in minutes
Experience award-winning platforms with fast and secure execution, and enjoy tight spreads from 0.5 pts on FX and 0.3 pts on indices.
Economic calendar
Web Trader platform
Our sophisticated web-based platform is packed with features.
Related articles

Gold Price Forecast: XAU/USD Plunges 12.4% Toward Critical Support 10 1 2026
Softer inflation has revived expectations for a Fed pause, but Friday’s payrolls could put gold’s recovery prospects to the test.


Gold Price Outlook: XAU/USD Resistance at $4200 Sets Up for NFP
It was a strong sell-off to start the week in gold and despite a Tuesday bounce, sellers are continuing to push following a resistance hit at the $4200 level.

Nasdaq Breakout Potential into Q4 for Melt Up Scenarios
The headlines seem negative in almost any place that you look, with surging Treasury yields and frothy AI valuations getting more and more attention. But, if it’s so bad, why hasn’t the Nasdaq melted down yet, even as the Fed has started hiking rates?
This report is intended for general circulation only. It should not be construed as a recommendation, or an offer (or solicitation of an offer) to buy or sell any financial products. The information provided does not take into account your specific investment objectives, financial situation or particular needs. Before you act on any recommendation that may be contained in this report, independent advice ought to be sought from a financial adviser regarding the suitability of the investment product, taking into account your specific investment objectives, financial situation or particular needs.
StoneX Financial Pte. Ltd., may distribute reports produced by its respective foreign entities or affiliates within the StoneX group of companies or third parties pursuant to an arrangement under Regulation 32C of the Financial Advisers Regulations. Where the report is distributed to a person in Singapore who is not an accredited investor, expert investor or an institutional investor (as defined in the Securities Futures Act), StoneX Financial Pte. Ltd. accepts legal responsibility to such persons for the contents of the report only to the extent required by law. Singapore recipients should contact StoneX Financial Pte. Ltd. at 6826 9988 for matters arising from, or in connection with the report.
In the case of all other recipients of this report, to the extent permitted by applicable laws and regulations neither StoneX Financial Pte. Ltd. nor its associated companies will be responsible or liable for any loss or damage incurred arising out of, or in connection with, any use of the information contained in this report and all such liability is hereby expressly disclaimed. No representation or warranty is made, express or implied, that the content of this report is complete or accurate.
StoneX Financial Pte. Ltd. is not under any obligation to update this report.
Trading CFDs carries a high level of risk that may not be suitable for some investors. Consider your investment objectives, level of experience, financial resources, risk appetite and other relevant circumstances carefully. The possibility exists that you could lose some or all of your investments, including your initial deposits. If in doubt, please seek independent expert advice. Visit www.forex.com/en-sg/terms-and-policies for the complete Risk Disclosure Statement.