



Gold Update: XAU/USD struggles for direction near 4k
Although gold has gained close to 1.5% over the last 2 trading sessions, this move does not yet appear to confirm a dominant buying bias. For now, the metal continues to show a more neutral behavior, with demand strength still failing to recover fully after the release of PPI inflation data in the United States.
Share this:

Although gold has gained close to 1.5% over the last 2 trading sessions, this move does not yet appear to confirm a dominant buying bias. For now, the metal continues to show a more neutral behavior, with demand strength still failing to recover fully after the release of PPI inflation data in the United States.
This is partly because, although inflation pressures have started to show signs of moderation, the bond market continues to show strength and remains a relevant substitute market for gold. This dynamic could keep a phase of indecision important in short-term XAU/USD movements.


PPI data is released
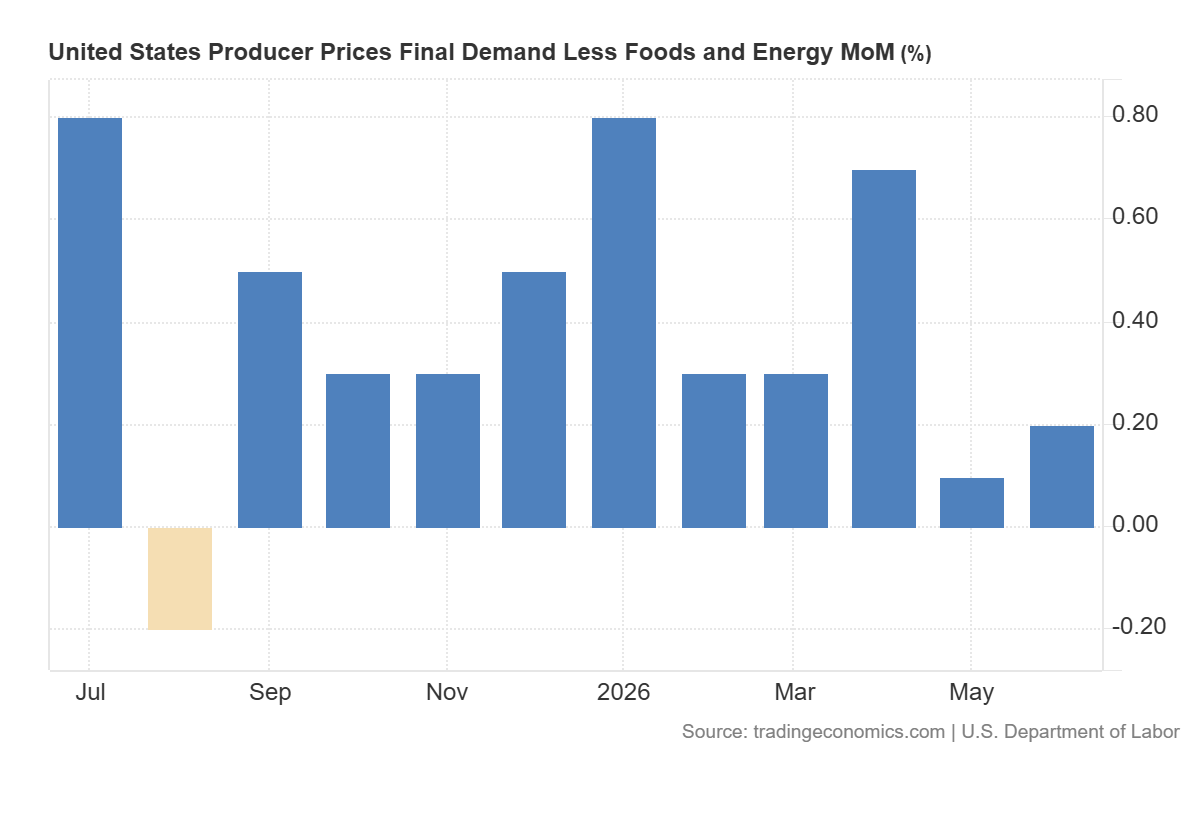
During the session, Core PPI data in the United States was released. This corresponds to the producer price index and works as an additional metric to measure potential inflation pressures.
The data came in below expectations, with a reading of 0.2% versus an expected monthly figure of 0.3%. For now, the dynamic shows that producer prices have continued to register low readings since May, moving away from the elevated levels seen in April, when the figure reached 0.7%.
Together with the CPI data released in the previous session, this figure shows that inflation pressures in the United States have started to ease to some extent.
Source: TradingEconomics
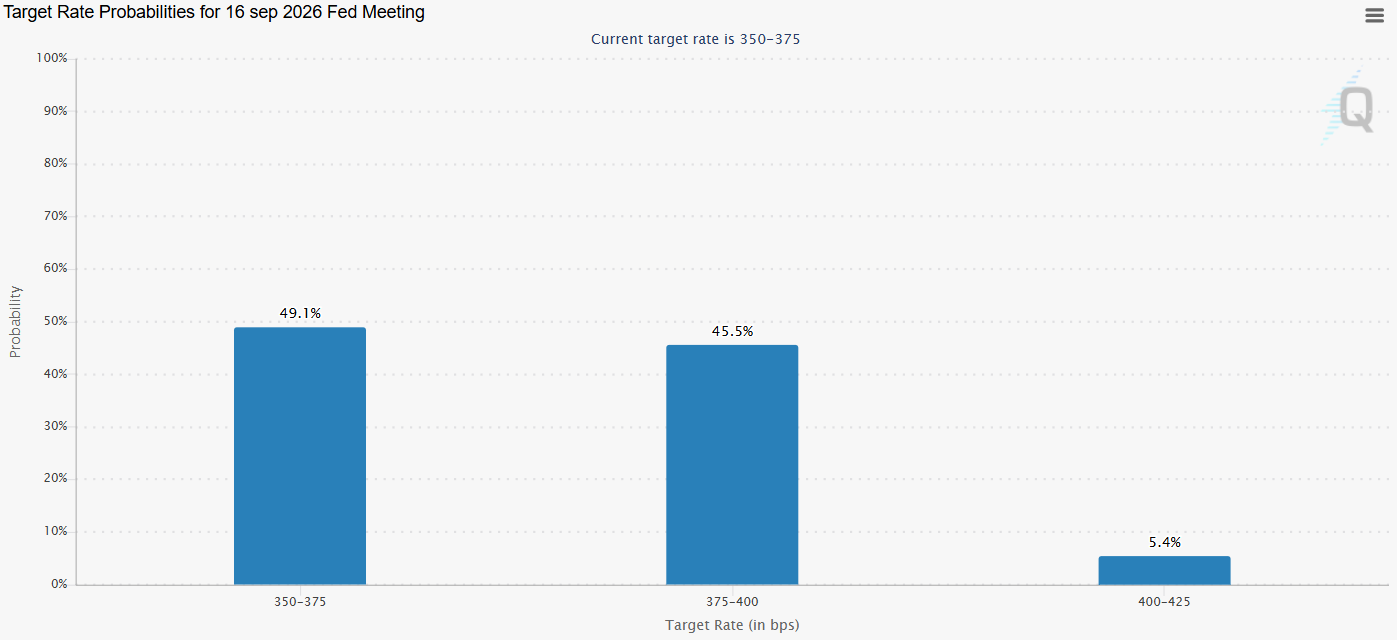
After the impact of the inflation data released over the last 2 sessions, an interesting shift has started to appear in expectations around a potentially more aggressive Federal Reserve.
Now, the probability table shows a 49.1% chance that interest rates will remain unchanged at the September 16 decision. At the same time, there is a lower probability, at 45.5%, of a 0.25% increase in U.S. interest rates, which would take them to a new reference area of 4.00%.
This suggests that expectations of a more aggressive stance from the central bank may not materialize as soon as previously expected, partly due to the recently released inflation data.
Source: CMEGROUP
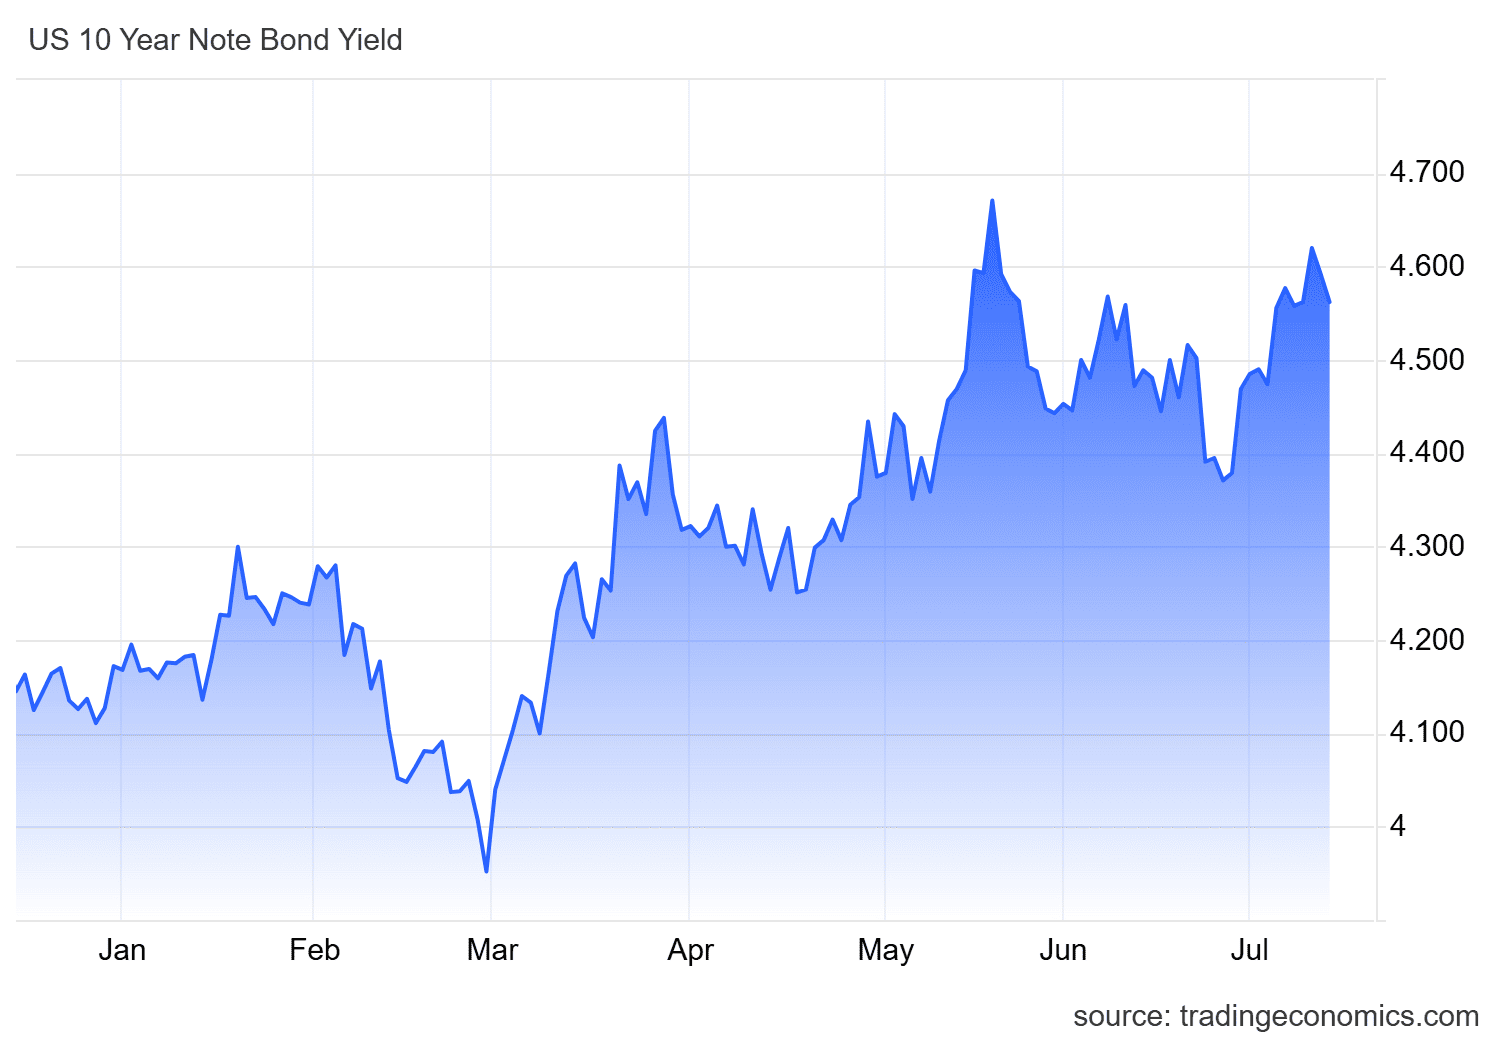
However, the most relevant factor for gold movements remains the dynamic of the 10-year U.S. bond market, considered one of the metal’s most important substitute markets.
Although a less aggressive central bank is now expected compared to what was projected weeks ago, bond yields have not shown major changes after the inflation data. While a recent decline has been observed, it has been small compared to the growth seen in previous weeks and yields still remain above the 4.5% area.
Source: TradingEconomics
This dynamic is not entirely favorable for gold because, unlike bonds, the metal does not pay interest. For this reason, it may be perceived as a less attractive market while bond yields remain stable and elevated in the short term.
In this context, strong yields could be reducing gold’s appeal and favoring a shift of capital flows toward substitute markets such as bonds.
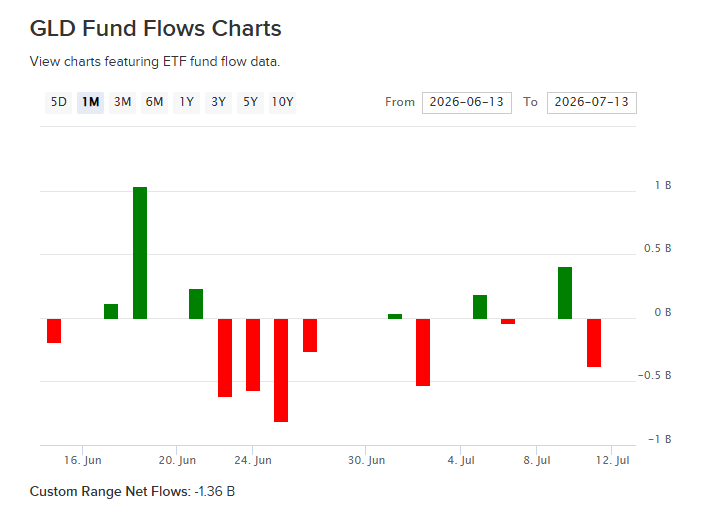
In fact, demand dynamics in the most relevant gold ETF, SPDR Gold Shares, show a lack of positive net flows over the last month of trading. For the most recent date, July 10, capital outflows of more than 350 million dollars were recorded.
This shows that capital outflows have reflected weaker appetite for gold, while the bond market has shown an important increase in yields over the last month. Overall, this dynamic highlights gold’s loss of appeal compared to substitute markets.
Source: ETFDB
With all the above in mind, one of the factors limiting a stronger recovery in gold demand may be the strength of its substitute markets. If this effect continues, it could keep preventing more consistent buying pressure from reaching the metal.
For this reason, a relevant phase of indecision could remain part of gold’s movements over the next few trading sessions.
Technical outlook for gold
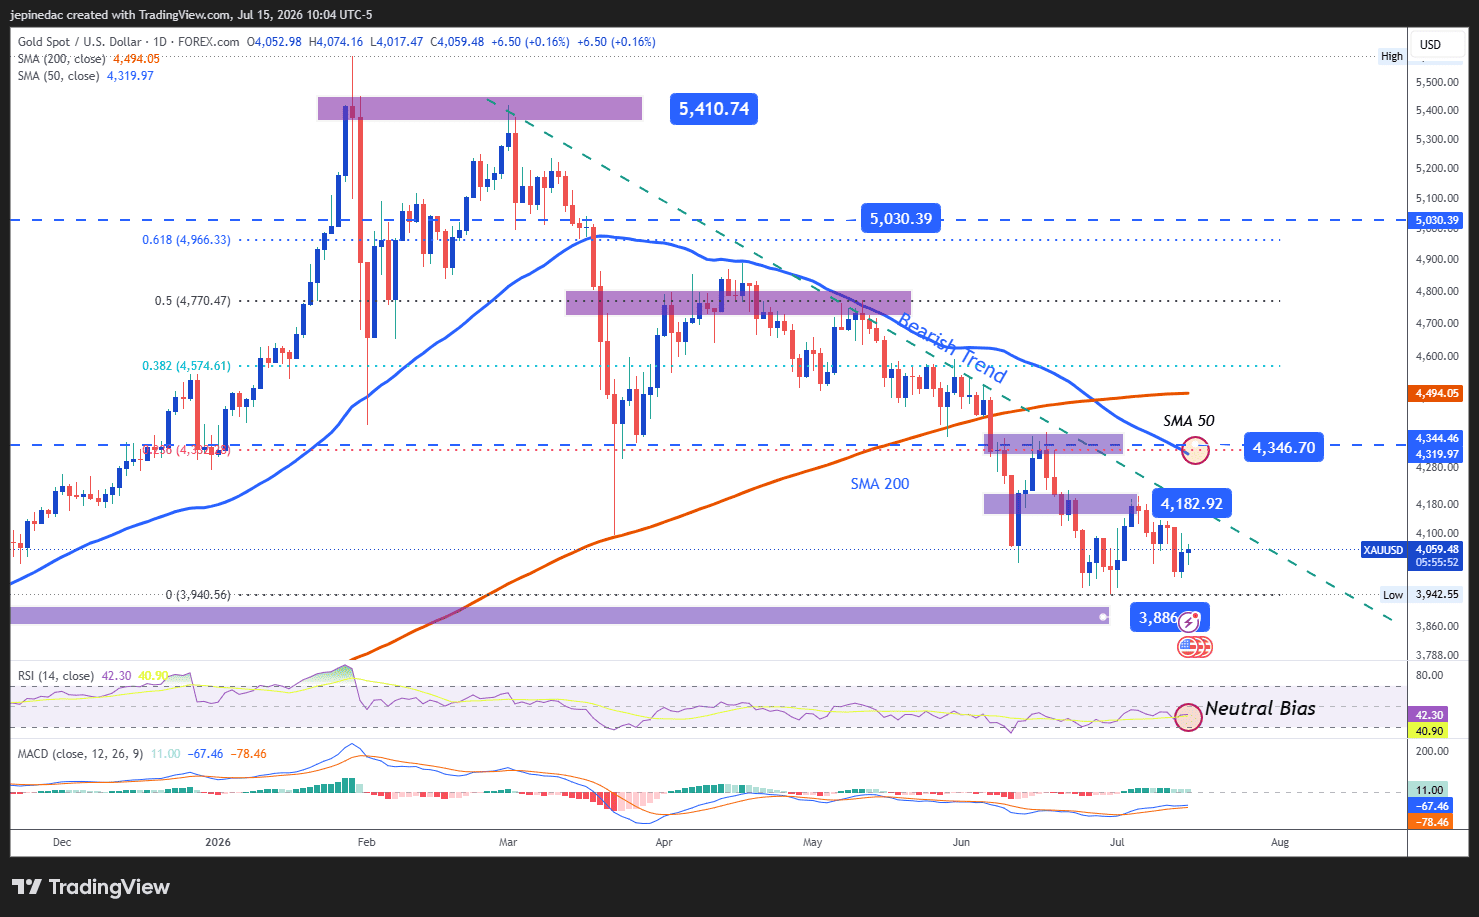
Source: StoneX, Tradingview
- The bearish trend line remains relevant: Despite gold’s recovery attempts in previous sessions, bullish movements still appear insufficient compared to the selling structure that has dominated the daily chart since the first days of March 2026. So far, this trend line remains the most important technical structure to watch. However, if price stops forming new relevant lows, a phase of neutrality could start to put the bearish formation at risk and open room for a possible sideways range over the next few sessions.
- RSI: Now, the RSI line has started to move near the neutral 50 level. This suggests a balance in the average of bullish and bearish impulses over the last 14 sessions. This dynamic reflects a possible indecision bias that has started to become relevant in the chart’s movements and could continue if the indicator maintains this behavior.
- MACD: A similar reading can be seen in the MACD, as the histogram remains near the neutral 0 area. This suggests that the average strength of short-term moving averages is in neutral territory, reinforcing the possibility of a phase of indecision in gold.
Key levels to watch:
- 4,345 USD – Crucial resistance: This level corresponds to relevant highs from recent weeks and aligns with the barrier marked by the 50-period simple moving average and the 23.6% Fibonacci retracement of the most relevant move on the chart. Price movements toward this level could put the large bearish trend line formation at risk and open room for a more dominant buying bias over the coming weeks.
- 4,182 USD – Near-term barrier: This recent neutral zone coincides with important retracements from recent weeks. If price remains too close to this level, a phase of indecision could be reinforced and even open room for a short-term sideways range.
- 3,886 USD – Critical support: This level is associated with relevant lows from October 2025 and is considered the next most important bearish barrier. Moves toward this area could once again highlight a clearer selling bias and extend the bearish trend line as the dominant technical structure over the coming weeks.
Written by Julian Pineda, CFA, CMT – Market Analyst
Follow him on: @julianpineda25
Related tags:
Latest market news




Open an account in minutes
Experience award-winning platforms with fast and secure execution, and enjoy tight spreads from 0.5 pts on FX and 0.3 pts on indices.
Economic calendar
Web Trader platform
Our sophisticated web-based platform is packed with features.
Related articles
Gold outlook: XAU/USD hammered, stretched and vulnerable to a sharp rebound
Gold is getting hammered for solid fundamental reasons, but history suggests extreme four-hourly oversold conditions can produce violent countertrend rallies.
Gold forecast: Rising yields become too hot for gold, but the outlook is far from bearish
Gold and silver prices took a plunge today, with the former down 3% and the latter falling some 5% by mid European session, before bouncing off their lows. The losses come after the metals remained largely supported until last week, despite the big dollar rally and surging bond yields as we have seen in recent weeks. But it simply got too much, and the metals succumbed to pressure today.


Gold Dips Below Three-Month Uptrend, Bitcoin Pulls Back from Nine-Month High
Gold has dipped below its three-month uptrend, while Bitcoin has pulled back from a nine-month high as U.S. bond yields test levels last seen in 2004 and 2007. Risks build as Fed rate-hike expectations remain above 70%, while the Dollar Index holds near yearly highs.

This report is intended for general circulation only. It should not be construed as a recommendation, or an offer (or solicitation of an offer) to buy or sell any financial products. The information provided does not take into account your specific investment objectives, financial situation or particular needs. Before you act on any recommendation that may be contained in this report, independent advice ought to be sought from a financial adviser regarding the suitability of the investment product, taking into account your specific investment objectives, financial situation or particular needs.
StoneX Financial Pte. Ltd., may distribute reports produced by its respective foreign entities or affiliates within the StoneX group of companies or third parties pursuant to an arrangement under Regulation 32C of the Financial Advisers Regulations. Where the report is distributed to a person in Singapore who is not an accredited investor, expert investor or an institutional investor (as defined in the Securities Futures Act), StoneX Financial Pte. Ltd. accepts legal responsibility to such persons for the contents of the report only to the extent required by law. Singapore recipients should contact StoneX Financial Pte. Ltd. at 6826 9988 for matters arising from, or in connection with the report.
In the case of all other recipients of this report, to the extent permitted by applicable laws and regulations neither StoneX Financial Pte. Ltd. nor its associated companies will be responsible or liable for any loss or damage incurred arising out of, or in connection with, any use of the information contained in this report and all such liability is hereby expressly disclaimed. No representation or warranty is made, express or implied, that the content of this report is complete or accurate.
StoneX Financial Pte. Ltd. is not under any obligation to update this report.
Trading CFDs carries a high level of risk that may not be suitable for some investors. Consider your investment objectives, level of experience, financial resources, risk appetite and other relevant circumstances carefully. The possibility exists that you could lose some or all of your investments, including your initial deposits. If in doubt, please seek independent expert advice. Visit www.forex.com/en-sg/terms-and-policies for the complete Risk Disclosure Statement.