



Gold weekly outlook and key levels | February 23, 2026
Gold appears to have benefitted the most from renewed US dollar weakness and lingering trade uncertainty following the Supreme Court ruling on Trump’s tariffs on Friday. Investors worried that the news could put fresh stress on government finances, although stocks managed to bounce into the close. Still, that macro backdrop has kept gold outlook positive, with the metal wrapping up its third consecutive weekly gain on Friday.
Share this:

Gold appears to have benefitted the most from renewed US dollar weakness and lingering trade uncertainty following the Supreme Court ruling on Trump’s tariffs on Friday. Investors worried that the news could put fresh stress on government finances, although stocks managed to bounce into the close. Still, that macro backdrop has kept gold outlook positive, with the metal wrapping up its third consecutive weekly gain on Friday.
Weekly gold chart looks bullish
Gold closed comfortably above the $5,000 mark on Friday. What really stands out to me is the bullish hammer-like candle on the weekly chart. That’s not the kind of structure you see in a market that’s ready to roll over. If anything, it tells me buyers are still in control of price action despite that big drop we saw at the end of January.
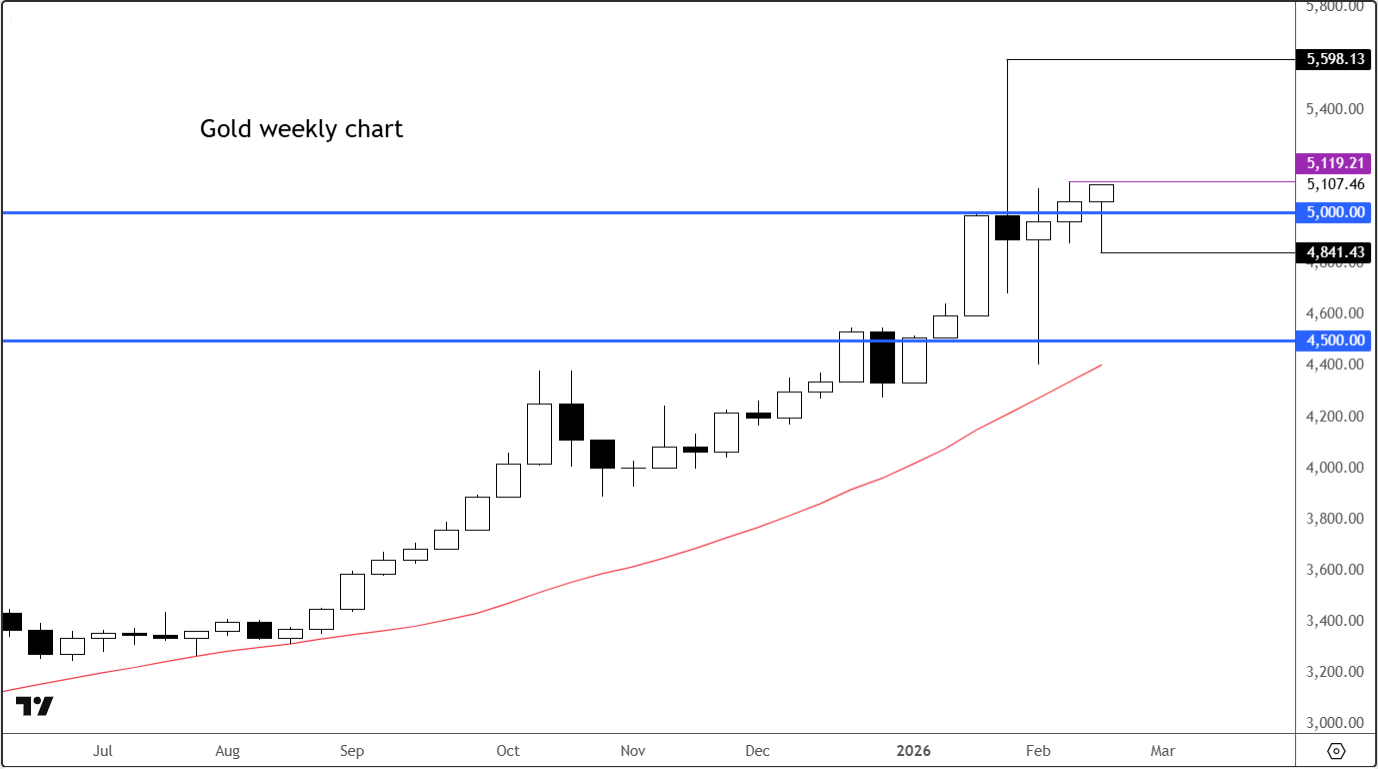
Right now, the path of least resistance looks higher. As long as price continues to hold above $5,000, I’m not interested in fading this move. The short side simply doesn’t make sense unless the charts start to deteriorate — and we’re not there yet.
Key XAU/USD short term levels to watch
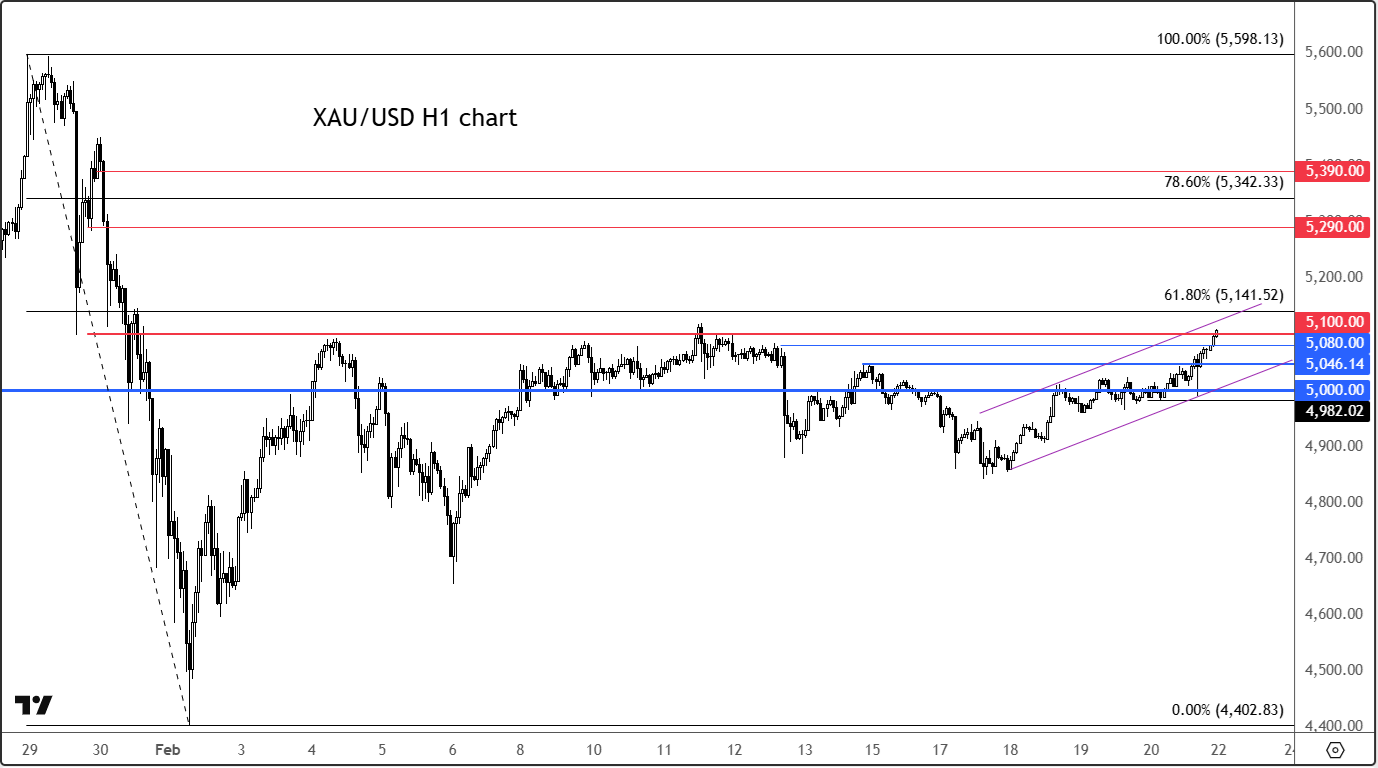
The breakout above $5,100 is also significant. That level capped price back on February 11th, and now we’ve closed a Friday session above it, which is constructive. When prior resistance levels give way and hold into the weekly close, it often signals that momentum is building rather than fading.
From here, the next upside level I’m watching is $5,290 — a former intraday support zone that collapsed during the sharp sell-off at the end of January.
Beyond that, $5,390 comes into focus. That’s another technically interesting area and one that could act as the next major upside magnet if momentum continues.
Meanwhile, it is also worth keeping an eye on the Fibonacci retracement levels from the late-January drop, which also line up nicely with the above levels. The 61.8% retracement sits around $5,141, while the 78.6% level comes in near $5,342.
Downside scenario for gold outlook
Now, let’s talk risk.
The $5,000 level is absolutely critical. It’s psychological, it’s technical, and it’s now the pivot that defines the short-term trend. If we slip back below it, the tone changes quickly. Even more important is Friday’s low at $4,982. That’s my line in the sand. A clean break below that level would likely trigger a deeper pullback and potentially unwind this latest leg higher.
Before we even get there, though, there are a few near-term supports to watch. The $5,046 area — prior resistance — could now flip into support. There’s also support around $5,080, which has attracted buying interest on a shorter-term basis.


In summary
For now, the structure remains constructive for the gold outlook in as far as the near term is concerned. Unless price action proves otherwise, dip buying look the trade that still pays, and momentum still favours the upside heading into the week ahead.
Source for all charts used in this article: TradingView.com
-- Written by Fawad Razaqzada, Market Analyst
Follow Fawad on Twitter @Trader_F_R
How to trade with City Index
You can trade with City Index by following these four easy steps:
- Open an account, or log in if you’re already a customer
• Open an account in the UK
• Open an account in Australia
• Open an account in Singapore
- Search for the company you want to trade in our award-winning platform
- Choose your position and size, and your stop and limit levels
- Place the trade
Related tags:
Latest market news



Open an account in minutes
Experience award-winning platforms with fast and secure execution, and enjoy tight spreads from 0.5 pts on FX and 0.3 pts on indices.
Economic calendar
Web Trader platform
Our sophisticated web-based platform is packed with features.
Related articles
ASX 200 Futures Hold Relatively Firm as Nikkei Plunges After Wall Street Rout
Wall Street's AI-led rout sends Nikkei futures plunging 9%, while ASX 200 futures hold relatively firm despite surging volatility and broader risk aversion.
Canadian Dollar Short-term Outlook: USD/CAD Plunge Stalls at Pivotal Support—Range Break in Focus 11 5 2026
Friday’s U.S. and Canadian employment reports could trigger a decisive USD/CAD move as bulls and bears battle for control at critical support.


US Dollar Technical Outlook: DXY Bulls Fight to Hold Critical Support Ahead of NFP 11 5 2026
DXY bulls are attempting to defend a pivotal technical threshold, with the next reaction likely to determine whether the broader recovery survives.
This report is intended for general circulation only. It should not be construed as a recommendation, or an offer (or solicitation of an offer) to buy or sell any financial products. The information provided does not take into account your specific investment objectives, financial situation or particular needs. Before you act on any recommendation that may be contained in this report, independent advice ought to be sought from a financial adviser regarding the suitability of the investment product, taking into account your specific investment objectives, financial situation or particular needs.
StoneX Financial Pte. Ltd., may distribute reports produced by its respective foreign entities or affiliates within the StoneX group of companies or third parties pursuant to an arrangement under Regulation 32C of the Financial Advisers Regulations. Where the report is distributed to a person in Singapore who is not an accredited investor, expert investor or an institutional investor (as defined in the Securities Futures Act), StoneX Financial Pte. Ltd. accepts legal responsibility to such persons for the contents of the report only to the extent required by law. Singapore recipients should contact StoneX Financial Pte. Ltd. at 6826 9988 for matters arising from, or in connection with the report.
In the case of all other recipients of this report, to the extent permitted by applicable laws and regulations neither StoneX Financial Pte. Ltd. nor its associated companies will be responsible or liable for any loss or damage incurred arising out of, or in connection with, any use of the information contained in this report and all such liability is hereby expressly disclaimed. No representation or warranty is made, express or implied, that the content of this report is complete or accurate.
StoneX Financial Pte. Ltd. is not under any obligation to update this report.
Trading CFDs carries a high level of risk that may not be suitable for some investors. Consider your investment objectives, level of experience, financial resources, risk appetite and other relevant circumstances carefully. The possibility exists that you could lose some or all of your investments, including your initial deposits. If in doubt, please seek independent expert advice. Visit www.forex.com/en-sg/terms-and-policies for the complete Risk Disclosure Statement.