


Japanese Yen Price Action Setups: AUD/JPY, GBP/JPY, USD/JPY
Yen pairs stabilise after sharp declines, with AUD/JPY showing resilience, GBP/JPY eyeing a bounce, and USD/JPY leaning more bearish near key pivots.
Share this:

The Japanese yen remains under close watch as several major pairs pause after recent volatility. While AUD/JPY and GBP/JPY show near-term signs of stabilisation, USD/JPY appears comparatively weaker, threatening a deeper correction. Technical setups across all three pairs suggest short-term bounces may precede another leg lower if resistance levels hold – though USD/JPY shows the potential to break lower first.
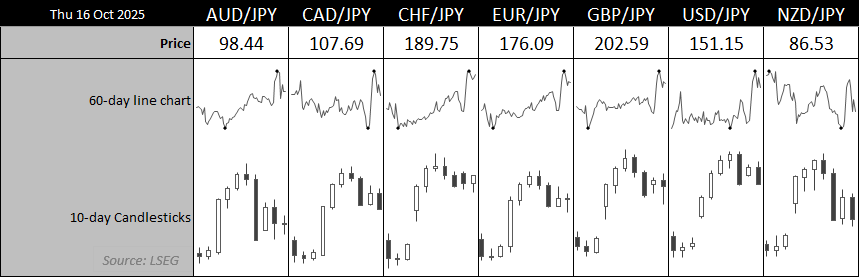
Chart analysis by Matt Simpson - data source: LSEG
View related analysis:
View related analysis:
Yen Pairs Stabilise as AUD/JPY and GBP/JPY Show Rebound Potential
AUD/JPY Technical Analysis: Australian Dollar vs Japanese Yen
The Australian dollar retraced 3.1% against the Japanese yen over a two-day period from its high just below the 101 handle. The fact that AUD/JPY has since held above the 97.85 low could be seen as a sign of near-term strength. Also note the small spinning top doji near the lower bounds of the range, which closed just above the 20-day EMA — suggesting that demand may be gradually returning.
The 1-hour chart shows AUD/JPY has printed its third higher low over the past three sessions, the latest forming as a bullish hammer. The 1-hour RSI(14) has also formed a positive divergence, printing a new cycle high ahead of price action.
The bias is for at least a minor leg higher before AUD/JPY breaks below the 97.85 low. Bears may target the 97 handle near the October low, with a break beneath it bringing the 96.32 low into focus.
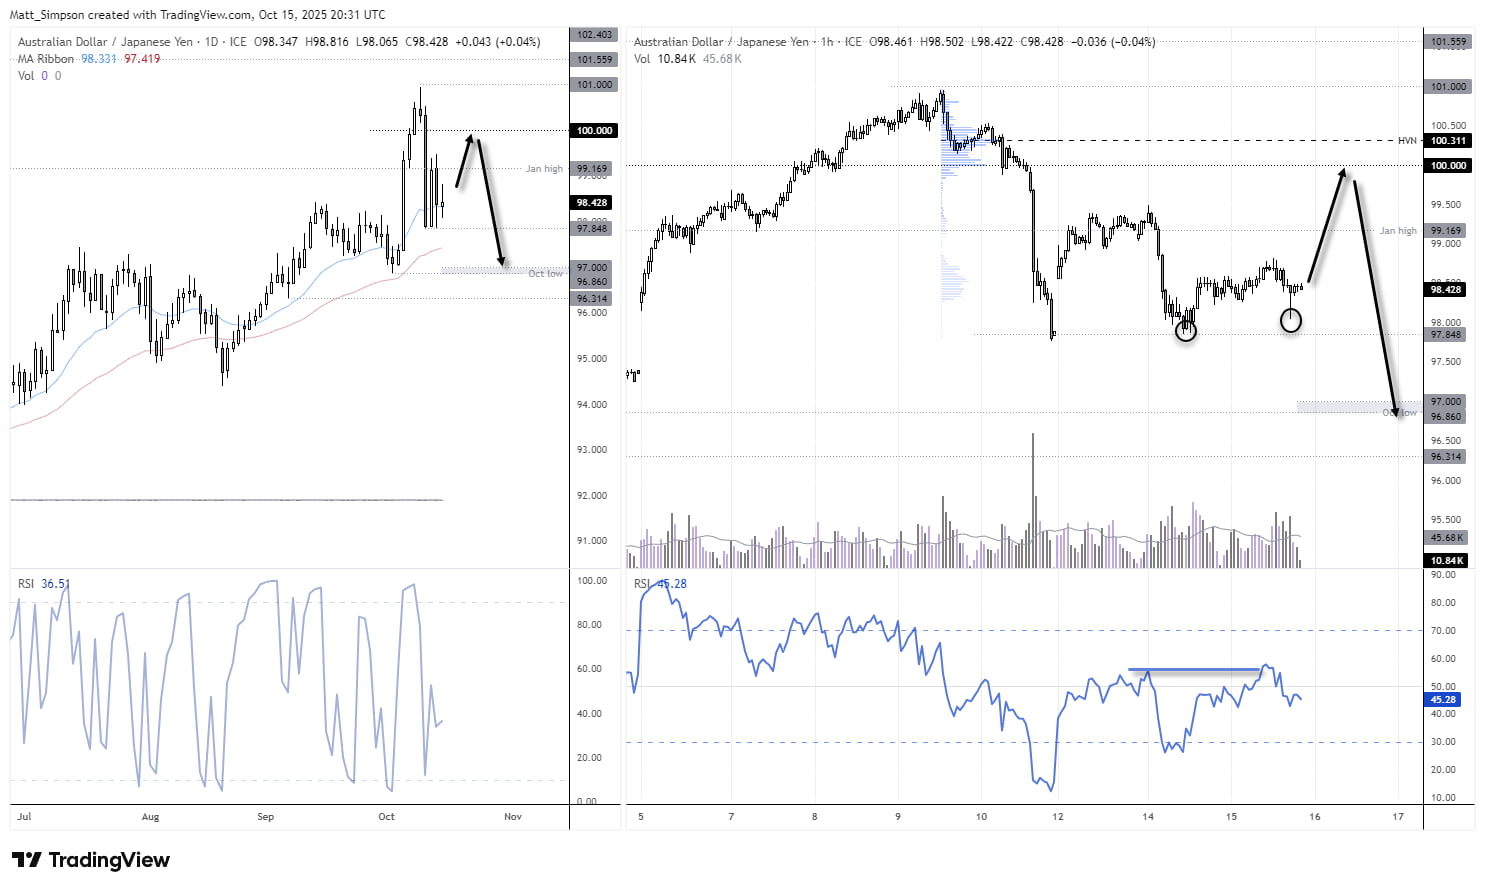
Chart analysis by Matt Simpson - data source: TradingView AUD/JPY


GBP/JPY Technical Analysis: British Pound vs Japanese Yen
The British pound is also showing signs of stability against the Japanese yen over the near-term, though like AUD/JPY, the bias is for GBP/JPY to eventually hit a new low after a bounce.
A bullish inside day formed on Wednesday, after Tuesday’s bearish engulfing (and outside) day held above the September high, 201 handle and 20-day EMA.
The 1-hour chart is effectively trending lower, but in a ‘drifting’ fashion – which leads me to suspect it is preparing for a bounce before momentum truly realigns with the bearish move from the 205 handle. Bulls could seek dips within Wednesday’s range and maintain a near-term bullish bias while GBP/JYP holds above 201. Upside targets include the resistance zone around 203.50 and the high-volume node (HVN) at 204.57 – though without a fresh catalyst, 203.50 seems more achievable.
Should a bounce materialise, I will then be on the lookout for a swing high to form and see prices revert towards the 200 handle and 50-day EMA.
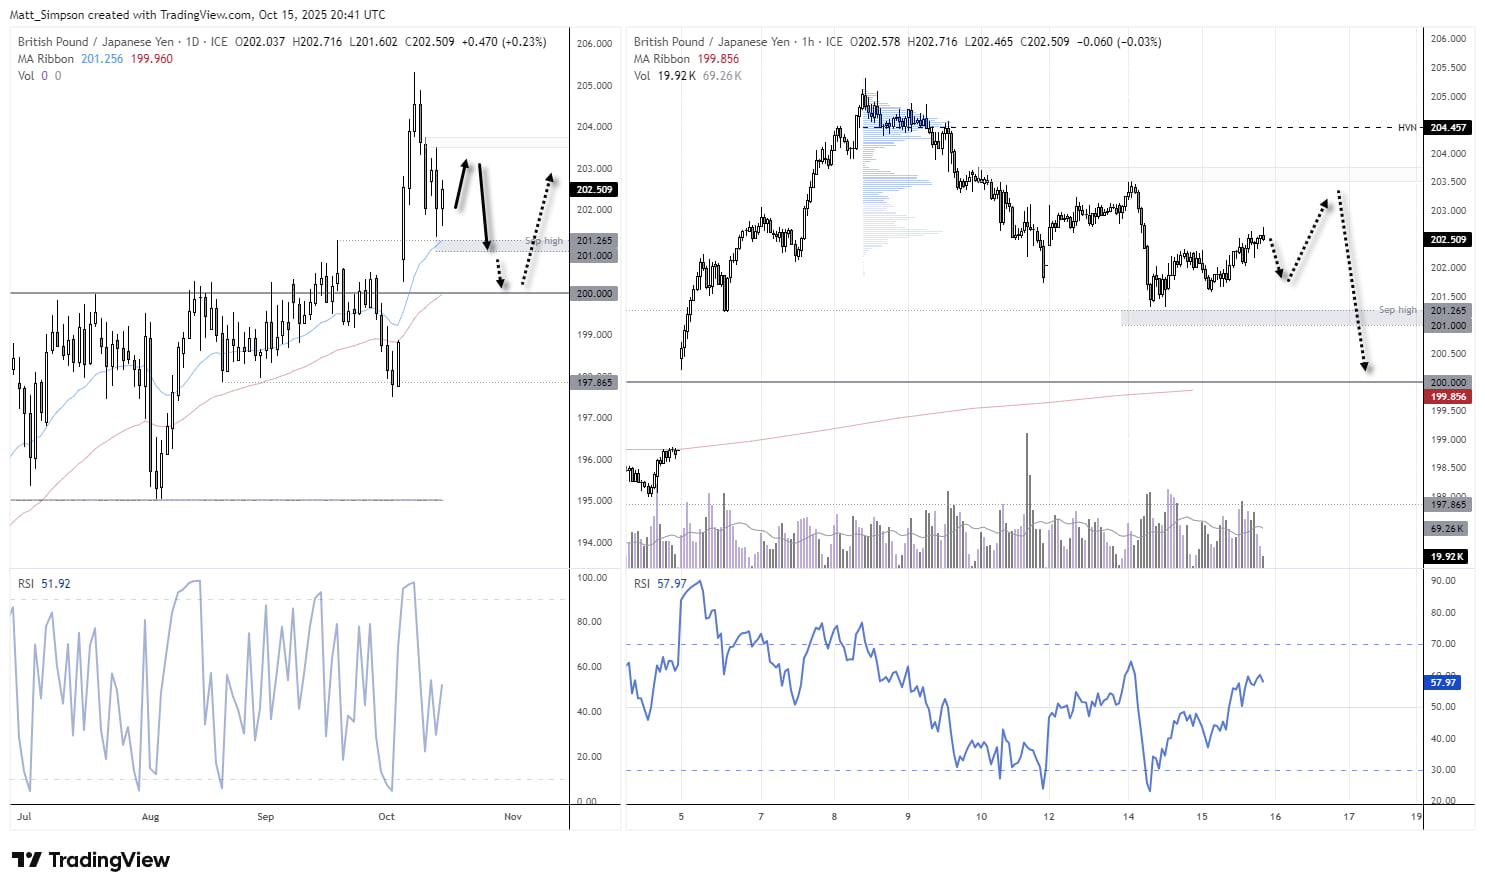
Chart analysis by Matt Simpson - data source: TradingView GBP/JPY
USD/JPY Technical Analysis: US Dollar vs Japanese Yen
Of the three yen pairs covered, price action remains somewhat more bearish on USD/JPY. The US dollar traded lower against the yen on Wednesday, with USD/JPY closing beneath the March high and now threatening a break below the August high.
On the 1-hour chart, a small inverted hammer (bearish pinbar) has formed a lower high. Bears could look to fade minor bounces on the assumption of a break beneath 150.90, with the 150 handle or the 150.33 HVN as near-term downside targets. A break below these levels would bring the 149 handle into focus, near the weekly S1 pivot (149.02).
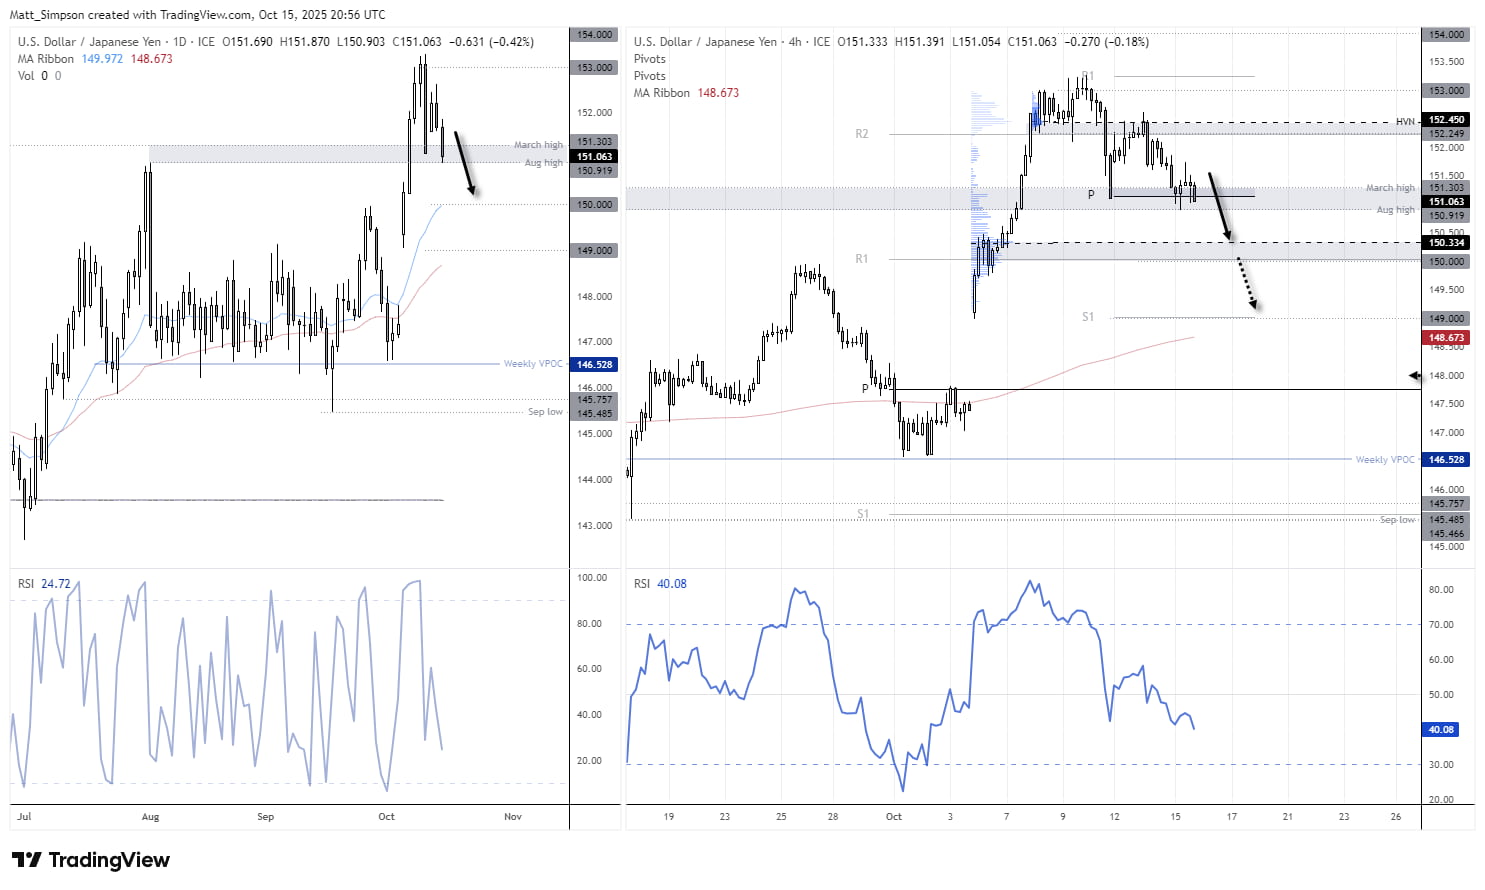
Chart analysis by Matt Simpson - data source: TradingView USD/JPY


Key Economic Events for Traders (AEDT / GMT+11)
08:45 NZD FPI (Sep) (NZD/USD, AUD/NZD, NZD/JPY)
08:50 AUD RBA Assistant Governor Kent Speaks (AUD/USD, AUD/JPY, ASX 200)
10:50 JPY Core Machinery Orders (Aug) (USD/JPY, EUR/JPY, Nikkei 225)
11:30 AUD Employment Report: Employment Change, Full-Time, Unemployment Rate, Participation Rate, Reserve Assets (Sep) (AUD/USD, AUD/JPY, ASX 200)
12:30 JPY BoJ Tamura Speaks (USD/JPY, EUR/JPY, Nikkei 225)
13:00 NZD RBNZ Offshore Holdings (Sep) (NZD/USD, AUD/NZD, NZD/JPY)
15:30 JPY Tertiary Industry Activity Index (Aug) (USD/JPY, EUR/JPY, Nikkei 225)
17:00 GBP GDP, Industrial Production, Manufacturing Production, Trade Balance, Index of Services, Construction Output (Aug) (GBP/USD, EUR/GBP, FTSE 100)
17:00 NOK Industrial Confidence (Q3) (USD/NOK, EUR/NOK, Brent Crude)
18:00 CHF SECO Economic Forecasts (USD/CHF, EUR/CHF, SMI Index)
19:30 GBP BoE Credit Conditions Survey (GBP/USD, EUR/GBP, FTSE 100)
20:00 EUR Trade Balance (Aug) (EUR/USD, EUR/GBP, DAX)
21:00 USD IMF Meetings (S&P 500, Nasdaq 100, USD/JPY)
21:00 EUR German Buba Monthly Report (EUR/USD, EUR/GBP, DAX)
22:00 GBP NIESR Monthly GDP Tracker (GBP/USD, EUR/GBP, FTSE 100)
23:00 USD FOMC Member Barkin Speaks (S&P 500, Nasdaq 100, USD/JPY)
23:15 CAD Housing Starts (Sep) (USD/CAD, EUR/CAD, CAD/JPY)
23:30 USD Philadelphia Fed Manufacturing Report (Oct) (S&P 500, Nasdaq 100, USD/JPY)
23:30 CAD New Motor Vehicle Sales (Aug) (USD/CAD, EUR/CAD, CAD/JPY)
00:00 GBP BoE MPC Member Mann Speaks (GBP/USD, EUR/GBP, FTSE 100)
00:00 USD Fed Vice Chair for Supervision Barr and Fed Waller Speak (S&P 500, Nasdaq 100, USD/JPY)
01:00 USD Business Inventories, NAHB Housing Market Index, Retail Inventories ex Auto (Aug/Oct) (S&P 500, Nasdaq 100, USD/JPY)
01:00 USD FOMC Member Bowman Speaks (S&P 500, Nasdaq 100, USD/JPY)
01:30 USD Natural Gas Storage (WTI Crude, Brent Crude, USD/CAD)
01:45 GBP BoE Deputy Governor Woods and MPC Member Mann Speak (GBP/USD, EUR/GBP, FTSE 100)
View the full economic calendar
View the full economic calendar
-- Written by Matt Simpson
Follow Matt on Twitter @cLeverEdge
How to trade with City Index
You can trade with City Index by following these four easy steps:
- Open an account, or log in if you’re already a customer
• Open an account in the UK
• Open an account in Australia
• Open an account in Singapore
- Search for the market you want to trade in our award-winning platform
- Choose your position and size, and your stop and limit levels
- Place the trade


Open an account in minutes
Experience award-winning platforms with fast and secure execution, and enjoy tight spreads from 0.5 pts on FX and 0.3 pts on indices.
Economic calendar
Web Trader platform
Our sophisticated web-based platform is packed with features.
Related articles

US Dollar Bulls Got Everything They Wanted. Except a Rally.
Bond bears had every excuse to wreak havoc after September's inflation surprise. Instead, buyers returned aggressively, leaving Treasury futures threatening to bottom and the dollar struggling to extend its rally.


AUD/USD and AUD/JPY Tease Swing Highs Heading into Jobs Report
AUD/USD and AUD/JPY show signs of potential swing highs as bearish reversal candles emerge ahead of Australia's employment report.

Canadian Dollar Short-term Outlook: USD/CAD Five-Week Rally Hits a Wall at Major Resistance 10 14 2026
USD/CAD is holding near fresh yearly highs, but bearish divergence and a well-defined October range raise the stakes at major resistance.

This report is intended for general circulation only. It should not be construed as a recommendation, or an offer (or solicitation of an offer) to buy or sell any financial products. The information provided does not take into account your specific investment objectives, financial situation or particular needs. Before you act on any recommendation that may be contained in this report, independent advice ought to be sought from a financial adviser regarding the suitability of the investment product, taking into account your specific investment objectives, financial situation or particular needs.
StoneX Financial Pte. Ltd., may distribute reports produced by its respective foreign entities or affiliates within the StoneX group of companies or third parties pursuant to an arrangement under Regulation 32C of the Financial Advisers Regulations. Where the report is distributed to a person in Singapore who is not an accredited investor, expert investor or an institutional investor (as defined in the Securities Futures Act), StoneX Financial Pte. Ltd. accepts legal responsibility to such persons for the contents of the report only to the extent required by law. Singapore recipients should contact StoneX Financial Pte. Ltd. at 6826 9988 for matters arising from, or in connection with the report.
In the case of all other recipients of this report, to the extent permitted by applicable laws and regulations neither StoneX Financial Pte. Ltd. nor its associated companies will be responsible or liable for any loss or damage incurred arising out of, or in connection with, any use of the information contained in this report and all such liability is hereby expressly disclaimed. No representation or warranty is made, express or implied, that the content of this report is complete or accurate.
StoneX Financial Pte. Ltd. is not under any obligation to update this report.
Trading CFDs carries a high level of risk that may not be suitable for some investors. Consider your investment objectives, level of experience, financial resources, risk appetite and other relevant circumstances carefully. The possibility exists that you could lose some or all of your investments, including your initial deposits. If in doubt, please seek independent expert advice. Visit www.forex.com/en-sg/terms-and-policies for the complete Risk Disclosure Statement.