



Logging into Bitcoin
In early April and after the price of Bitcoin surged by 20% in just one day, we penned an article asking, “Is it back?” https://www.cityindex.com.au/market-analysis/is-it-back/. The bullish Bitcoin view in the article, supported by video chart analysis posted just 24 hours before the rally commenced on the City Index website.
Share this:

In early April and after the price of Bitcoin surged by 20% in just one day, we penned an article asking, “Is it back?”. The bullish Bitcoin view in the article, supported by video chart analysis posted just 24 hours before the rally commenced on the City Index website.
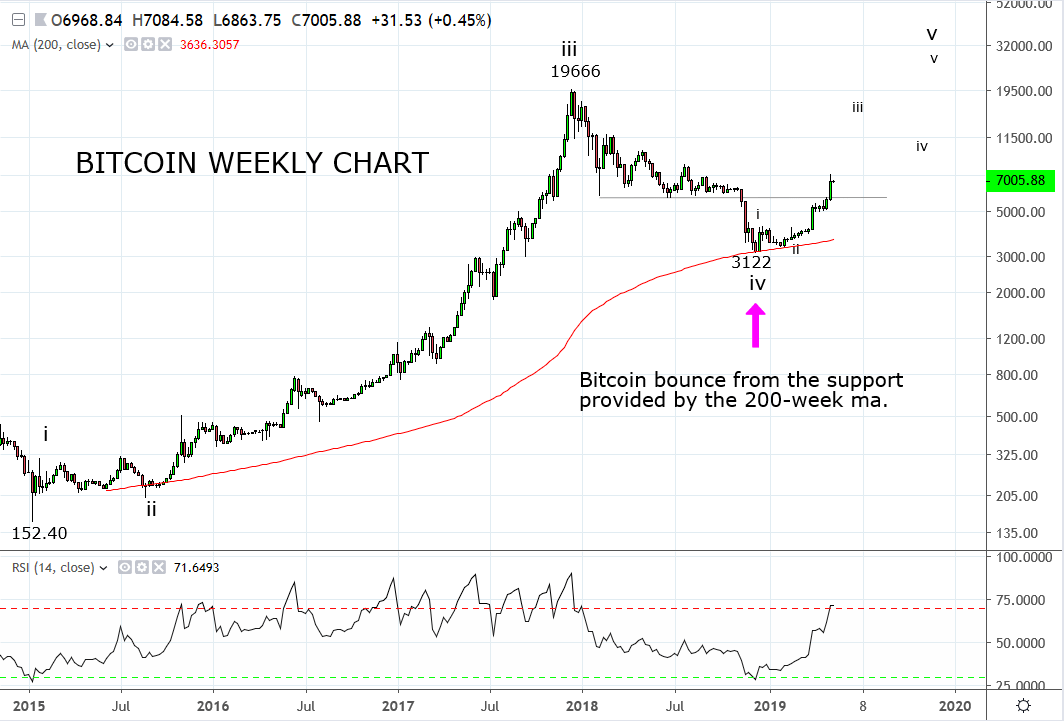
The reasons for the bullish view were predominantly based on technical analysis and included the emergence of a rounded bottom/loss of downside momentum on the daily chart as well as bullish divergence as viewed on the RSI indicator. The weekly chart confirmed that at its lowest traded price of 3122, last December, Bitcoin had held the critical support coming from the 200-week moving average.
Based on this analysis, it was suggested buying Bitcoin near 3925. The first two profit targets were easily achieved. The final part of the plan was to take profit on the remaining one-third portion of the original trade near to 8000, an ambitious, “blue sky” type target.
However, as volatility has increased as witnessed by a further 40% rally in the first two weeks of May and based on the chart below a reassessment is required.
The weekly chart below uses a log scale as opposed to the linear scale most commonly used in trading. With a linear chart, the price on the Y-axis or vertical axis is scaled to be equal, so $2, $4, $6, $8 are all the same distance apart.
In a log chart, price is scaled according to percent changes, so two equal percent changes are going to have the same vertical change/distance. A log scale is very useful when charting securities that have moved by large percentages over a short period, such as Bitcoin.
Based on the strong rally viewed in Bitcoin in recent months and the log chart below, it appears the price of Bitcoin can rally further than originally anticipated. As such, we will stay with our core long position and should a dip back towards 6000 eventuate, it will be watched carefully for a trading opportunity to rebuild Bitcoin longs.
Source Tradingview. The figures stated are as of the 2nd of May 2019. Past performance is not a reliable indicator of future performance. This report does not contain and is not to be taken as containing any financial product advice or financial product recommendation
Disclaimer
TECH-FX TRADING PTY LTD (ACN 617 797 645) is an Authorised Representative (001255203) of JB Alpha Ltd (ABN 76 131 376 415) which holds an Australian Financial Services Licence (AFSL no. 327075)
Trading foreign exchange, futures and CFDs on margin carries a high level of risk and may not be suitable for all investors. The high degree of leverage can work against you as well as for you. Before deciding to invest in foreign exchange, futures or CFDs you should carefully consider your investment objectives, level of experience, and risk appetite. The possibility exists that you could sustain a loss in excess of your deposited funds and therefore you should not invest money that you cannot afford to lose. You should be aware of all the risks associated with foreign exchange, futures and CFD trading, and seek advice from an independent financial advisor if you have any doubts. It is important to note that past performance is not a reliable indicator of future performance.
Any advice provided is general advice only. It is important to note that:
- The advice has been prepared without taking into account the client’s objectives, financial situation or needs.
- The client should therefore consider the appropriateness of the advice, in light of their own objectives, financial situation or needs, before following the advice.
- If the advice relates to the acquisition or possible acquisition of a particular financial product, the client should obtain a copy of, and consider, the PDS for that product before making any decision.
Related tags:
Latest market news




Open an account in minutes
Experience award-winning platforms with fast and secure execution, and enjoy tight spreads from 0.5 pts on FX and 0.3 pts on indices.
Economic calendar
Web Trader platform
Our sophisticated web-based platform is packed with features.
Related articles

Gold Dips Below Three-Month Uptrend, Bitcoin Pulls Back from Nine-Month High
Gold has dipped below its three-month uptrend, while Bitcoin has pulled back from a nine-month high as U.S. bond yields test levels last seen in 2004 and 2007. Risks build as Fed rate-hike expectations remain above 70%, while the Dollar Index holds near yearly highs.


Q4 2026 Bitcoin Outlook: Did the August Rally Mark the Cycle Low?
The outlook for Bitcoin in Q4 is turning cautiously optimistic on the back of renewed ETF purchases, compelling valuations, and an improvement in buy-and-hold behavior among investors - see the full analysis!


Bitcoin Technical Outlook: BTC/USD Major Breakout Signals Crypto Winter May Be Over 9 22 2026
A 50% surge from the yearly low has transformed Bitcoin’s technical backdrop, with bulls now targeting the next major hurdle at the yearly open.

This report is intended for general circulation only. It should not be construed as a recommendation, or an offer (or solicitation of an offer) to buy or sell any financial products. The information provided does not take into account your specific investment objectives, financial situation or particular needs. Before you act on any recommendation that may be contained in this report, independent advice ought to be sought from a financial adviser regarding the suitability of the investment product, taking into account your specific investment objectives, financial situation or particular needs.
StoneX Financial Pte. Ltd., may distribute reports produced by its respective foreign entities or affiliates within the StoneX group of companies or third parties pursuant to an arrangement under Regulation 32C of the Financial Advisers Regulations. Where the report is distributed to a person in Singapore who is not an accredited investor, expert investor or an institutional investor (as defined in the Securities Futures Act), StoneX Financial Pte. Ltd. accepts legal responsibility to such persons for the contents of the report only to the extent required by law. Singapore recipients should contact StoneX Financial Pte. Ltd. at 6826 9988 for matters arising from, or in connection with the report.
In the case of all other recipients of this report, to the extent permitted by applicable laws and regulations neither StoneX Financial Pte. Ltd. nor its associated companies will be responsible or liable for any loss or damage incurred arising out of, or in connection with, any use of the information contained in this report and all such liability is hereby expressly disclaimed. No representation or warranty is made, express or implied, that the content of this report is complete or accurate.
StoneX Financial Pte. Ltd. is not under any obligation to update this report.
Trading CFDs carries a high level of risk that may not be suitable for some investors. Consider your investment objectives, level of experience, financial resources, risk appetite and other relevant circumstances carefully. The possibility exists that you could lose some or all of your investments, including your initial deposits. If in doubt, please seek independent expert advice. Visit www.forex.com/en-sg/terms-and-policies for the complete Risk Disclosure Statement.