



Nasdaq 100 forecast: Alphabet results reignite AI concerns
Disappointing results from a couple of major global technology names have put the AI trade back under scrutiny, with Nasdaq 100 futures falling around 1% after giving up the post-FOMC gains seen overnight. For now, our short-term Nasdaq 100 forecast remains more on the cautious side of things than outright bearish. The index remains close to its record highs and continues to find dip buyers. But could that change soon?
Share this:

Disappointing results from a couple of major global technology names have put the AI trade back under scrutiny, with Nasdaq 100 futures falling around 1% after giving up the post-FOMC gains seen overnight. For now, our short-term Nasdaq 100 forecast remains more on the cautious side of things than outright bearish. The index remains close to its record highs and continues to find dip buyers. But could that change soon?
Alphabet triggers slide in tech
Alphabet was the main catalyst for the renewed AI-related concerns as the company’s shares fell around 10% premarket after disappointing results. The Google parent pointed to signs that its AI search products are starting to weigh on its core advertising business, while both earnings and revenue came in below expectations. That has inevitably revived the debate over whether the trillions of dollars being committed to artificial intelligence can ultimately generate sufficient returns to justify the investment.
The picture is far from uniformly negative, though. Microsoft delivered a much stronger set of numbers, with robust Azure growth, resilient AI demand and an upbeat cloud outlook. Its shares were around 3.5% higher pre-market, providing some offset to the weakness elsewhere in the technology sector.
Tech underperforms
The broader equity picture remains mixed, but technology-heavy indices are clearly underperforming. Alphabet shares were down around 10% pre-market, with the weakness spilling over into other parts of the AI and semiconductor complex.
Samsung Electronics was another example of the increasingly demanding backdrop. Its shares fell around 4% despite a 15-fold year-on-year increase in chip profits, helped by strong demand for AI-related memory. Investors instead focused on the lack of new shareholder-return measures, while the company’s plan to increase FY26 capital expenditure by more than 60% raised further questions about just how much investment is required to keep pace with AI demand.
This is becoming an increasingly important distinction for investors. Strong demand for AI infrastructure is still evident, but markets appear less willing to reward spending simply because it carries an AI label. The focus is shifting towards whether these enormous investments can eventually translate into sustainable earnings and cash flow.
GDP beats as core PCE comes in line
With the initial dovish reaction to Wednesday’s FOMC decision already fading, attention is turning back towards the economic data. Today, US GDP and core PCE inflation were the main highlights.
September core PCE printed a 0.3% month-on-month increase, reinforcing the picture of relatively sticky inflation. Third-quarter GDP, meanwhile, showed annualised growth of 3.4%, better than 3.2% expected.
A combination of firm growth and sticky inflation is making it harder for the Federal Reserve not to hike in December. Even if oil prices ease from current levels, the broader inflation and growth backdrop remains firm enough to keep the Fed on a relatively hawkish path.
Technical Nasdaq 100 forecast and levels to watch
From a technical analysis perspective, Nasdaq 100 forecast remains cagey. The index has fallen back from around the 30,000 level after failing to hold above the 21-day exponential moving average.
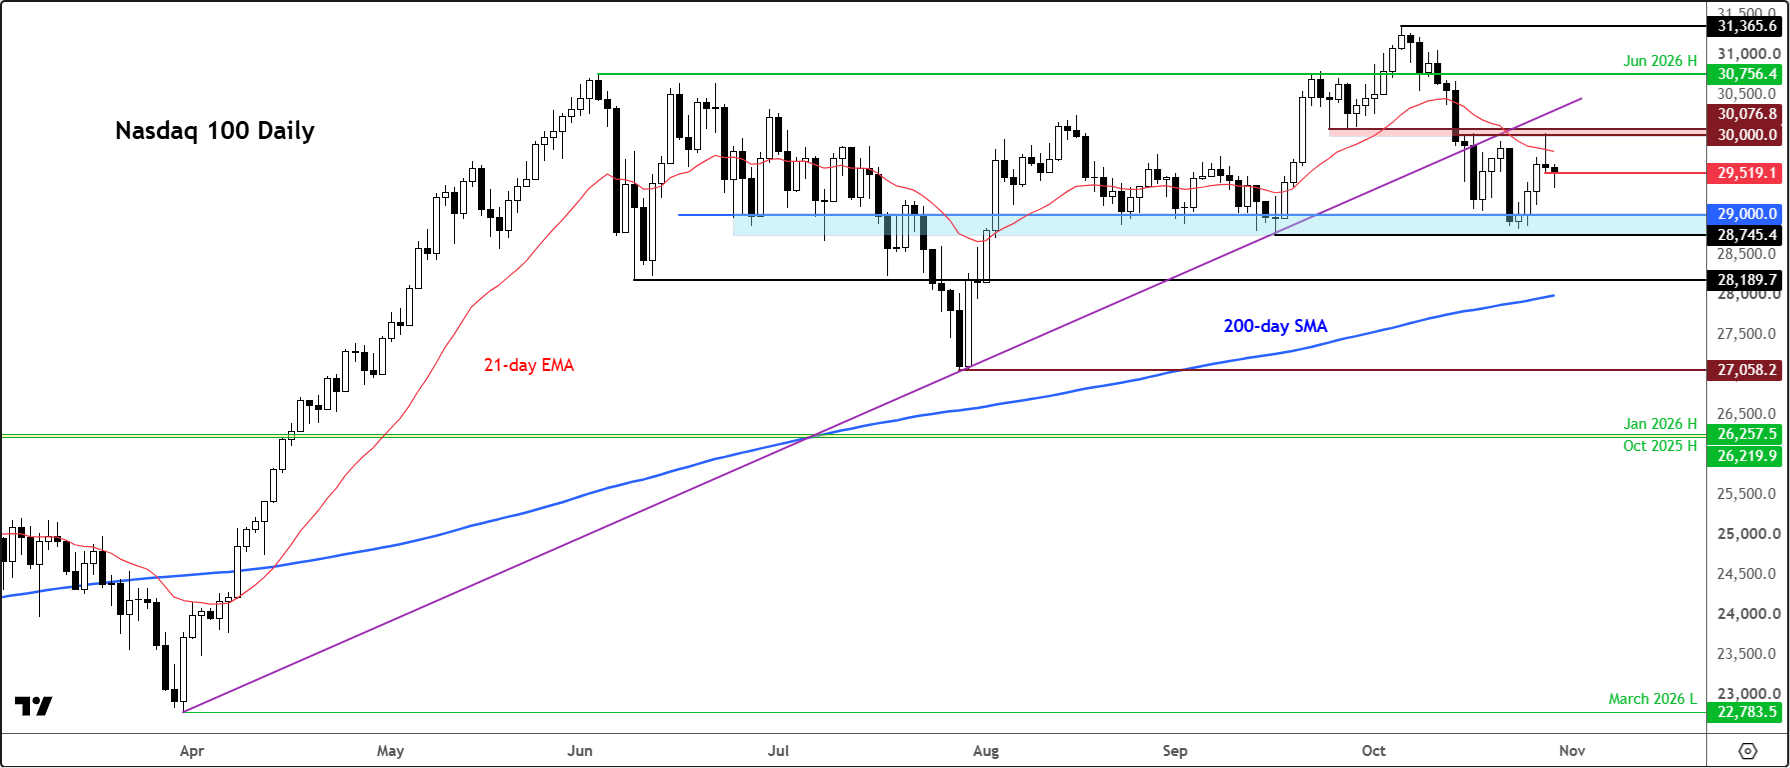
The technical picture has deteriorated since the our US Tech 100 index, which is derived from the Nasdaq 100 futures, broke below its bullish trend line a few weeks ago. Unless that trend line is reclaimed, I think the safer approach is to remain cautious while the market digests the latest earnings and decides whether this is merely another consolidation phase or the beginning of a deeper correction.
For now, consolidation remains the name of the game. It is still very much a level-to-level market.
The most recent significant low, recorded in mid-September, is at 28,745. For me, that remains the key level and the line in the sand. A break below it would establish a clear lower low and strengthen the bearish technical picture.
In the shorter term, support comes in at 29,500, followed by 29,000. On the upside, 30,000 remains the first major psychological hurdle. Above there, the backside of the broken trend line comes in around 30,300.
A sustained move back above that area would start to repair the technical picture and potentially open the door towards the previous highs.
For now, however, the bias remains cautious while the Nasdaq 100 trades below the broken trend line.

Related tags:


Open an account in minutes
Experience award-winning platforms with fast and secure execution, and enjoy tight spreads from 0.5 pts on FX and 0.3 pts on indices.
Economic calendar
Web Trader platform
Our sophisticated web-based platform is packed with features.
Related articles

Nasdaq 100 forecast: Alphabet results reignite AI concerns
Disappointing results from a couple of major global technology names have put the AI trade back under scrutiny, with Nasdaq 100 futures falling around 1% after giving up the post-FOMC gains seen overnight. For now, our short-term Nasdaq 100 forecast remains more on the cautious side of things than outright bearish. The index remains close to its record highs and continues to find dip buyers. But could that change soon?
Bank of Canada Hikes as Inflation Risks Intensify: AUD/CAD In Focus
The BoC hikes rates to 2.5% and upgrades its inflation outlook despite weak employment. Could further tightening put AUD/CAD under pressure?


DAX forecast: AI optimism offers relief ahead of central bank meetings
The DAX is finding some relief from the recent improvement in risk appetite, with investors becoming less concerned about the sustainability of the AI trade
This report is intended for general circulation only. It should not be construed as a recommendation, or an offer (or solicitation of an offer) to buy or sell any financial products. The information provided does not take into account your specific investment objectives, financial situation or particular needs. Before you act on any recommendation that may be contained in this report, independent advice ought to be sought from a financial adviser regarding the suitability of the investment product, taking into account your specific investment objectives, financial situation or particular needs.
StoneX Financial Pte. Ltd., may distribute reports produced by its respective foreign entities or affiliates within the StoneX group of companies or third parties pursuant to an arrangement under Regulation 32C of the Financial Advisers Regulations. Where the report is distributed to a person in Singapore who is not an accredited investor, expert investor or an institutional investor (as defined in the Securities Futures Act), StoneX Financial Pte. Ltd. accepts legal responsibility to such persons for the contents of the report only to the extent required by law. Singapore recipients should contact StoneX Financial Pte. Ltd. at 6826 9988 for matters arising from, or in connection with the report.
In the case of all other recipients of this report, to the extent permitted by applicable laws and regulations neither StoneX Financial Pte. Ltd. nor its associated companies will be responsible or liable for any loss or damage incurred arising out of, or in connection with, any use of the information contained in this report and all such liability is hereby expressly disclaimed. No representation or warranty is made, express or implied, that the content of this report is complete or accurate.
StoneX Financial Pte. Ltd. is not under any obligation to update this report.
Trading CFDs carries a high level of risk that may not be suitable for some investors. Consider your investment objectives, level of experience, financial resources, risk appetite and other relevant circumstances carefully. The possibility exists that you could lose some or all of your investments, including your initial deposits. If in doubt, please seek independent expert advice. Visit www.forex.com/en-sg/terms-and-policies for the complete Risk Disclosure Statement.