



Nasdaq, Russell Outlook: Resistance Levels in Check
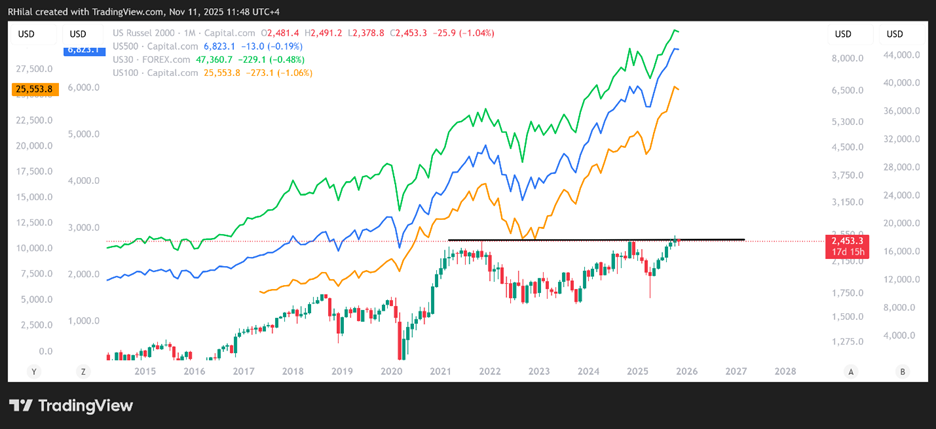
Nasdaq, Russell Outlook: The last time the Russell 2000 struggled near its record highs and the 2,500 resistance level, U.S. indices faced a sharp pullback triggered by tariff concerns. Now, as we approach year-end amid stretched sentiment and valuations, consolidation risks are on the rise.
Share this:

Key Events
- Momentum across U.S. indices slows between holiday periods and ongoing government resolution hopes.
- U.S. CPI, tentatively scheduled for Thursday this week, defines a key volatility catalyst for markets.
- The Russell 2000 continues to struggle below its four-year resistance, while the Nasdaq holds in a neutral zone below 25,700.
Russell 2000 vs SP 500, Dow, and Nasdaq
Source: Tradingview
The Russell 2000, the leader of U.S. small-cap stocks, is once again struggling near its 2,500 record and 4- year resistance. The previous times it reached this level, global indices experienced sharp sell-offs—the most recent being the 2025 tariff-induced correction.
As we approach the end of the year, concerns over stretched AI and tech valuations—with mega caps such as Microsoft and Nvidia surpassing $4 trillion in market capitalization—combined with tariff fatigue, dovish policy expectations, and labor market uncertainty, are weighing on sentiment. Indices appear to be on a neutral hold, with the Dow holding below 48,000, the Nasdaq below 26,300, and the Russell below 2,550.
- Key levels remain in focus to define the sustainability of the current trends:
A clean hold above 2,550 on the Russell, representing the 0.618 Fibonacci extension of the 2020 low, 2021 high, and 2023 low, is expected to support longer-term gains toward new records near 2,800. - However, as long as the index remains capped below resistance, the risk of forming a triple-top structure persists, potentially pressuring the broader market outlook.
Nasdaq, Russell, SP 500 Outlook: Daily Time Frame - Log Scale
Source: Tradingview
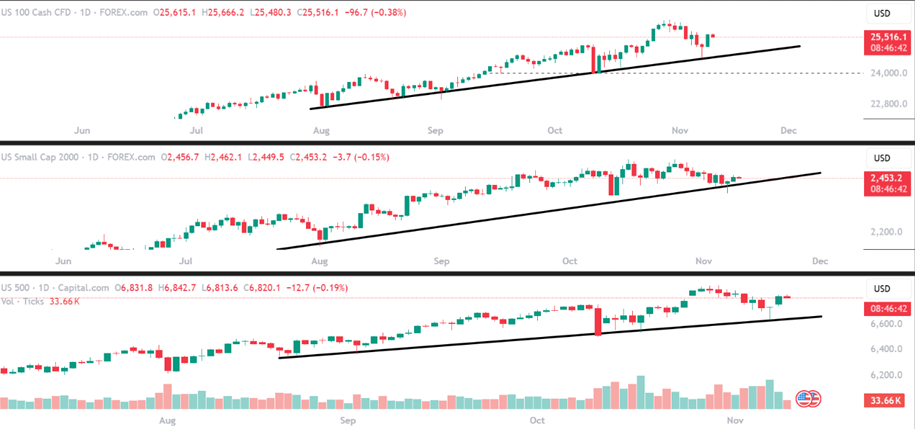
On the daily time frame, U.S. indices continue to respect the uptrend connecting consecutive higher lows since August, maintaining a bullish technical bias—unless a clear structural breakdown occurs.
Market sentiment briefly weakened amid U.S. government shutdown risks, testing key support once again. However, renewed hopes for a government resolution helped lift indices back to neutral territory, trading above critical support levels that separate bullish from bearish bias, and still below record highs.
Nasdaq Outlook: Daily Time Frame – Log Scale
Source: Trading view
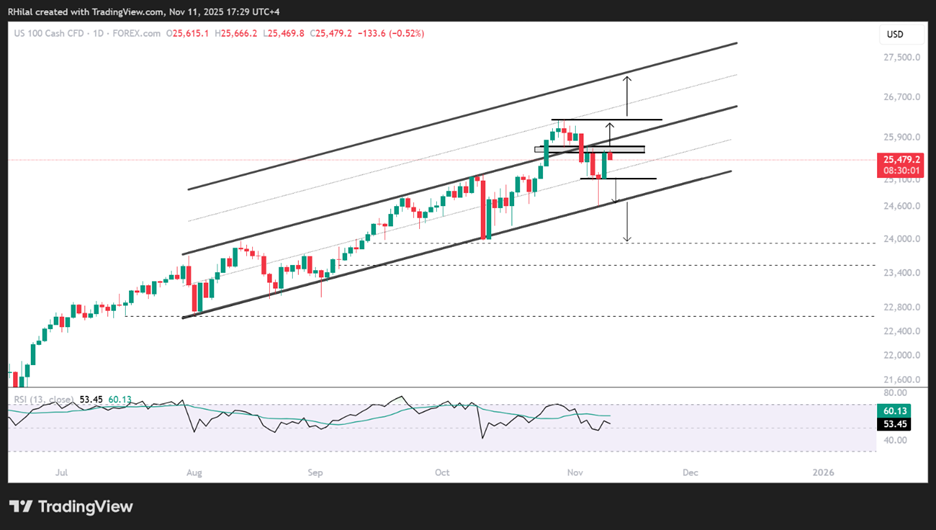
From a daily perspective, the Nasdaq is testing the upper bound of a parallel channel that has been respected since the August 2025. Price action previously broke to the mid-zone of the duplicated channel near 26,300, declined to the lower border of the original pattern near 24,650, and has since rebounded toward the upper edge around 25,700.
The scenarios from here are as follows:
- Bullish case: A confirmed hold above 25,700 could redirect gains toward 26,300, after which another bullish projection targets the upper boundary of the duplicated channel near 26,700–27,000.
- Bearish case: A drop back below 25,200 could pull prices toward 24,650, with further downside potential extending below the August–November support zone toward 23,900, 23,500, and, in extreme cases, 22,700.
Written by Razan Hilal, CMT
Follow on X: @Rh_waves
Related tags:
Latest market news




Open an account in minutes
Experience award-winning platforms with fast and secure execution, and enjoy tight spreads from 0.5 pts on FX and 0.3 pts on indices.
Economic calendar
Web Trader platform
Our sophisticated web-based platform is packed with features.
Related articles
Gold, silver outlook: Sandwiched between bullish bonds and AI angst
XAU/USD and XAG/USD may be approaching a bullish turning point as Treasury futures threaten a breakout. The problem? Both metals have recently been trading more like tech stocks than havens.
US Dollar, GBP/USD, USD/CAD, USD/CHF, Gold Weekly Technical Outlook 11 2 2026
Sr. Technical Strategist Michael Boutros highlights the levels that matter on the USD Majors, commodities, and equity indices charts this week.

US Midterm Forecast: The Key Risks for Traders to Watch Through the US Elections
Prediction markets are pricing in nearly 75% odds of a Democratic sweep in this week’s US midterm elections, a development that would result in a split from the single party Republican rule of the past two years - what will it mean for markets?

This report is intended for general circulation only. It should not be construed as a recommendation, or an offer (or solicitation of an offer) to buy or sell any financial products. The information provided does not take into account your specific investment objectives, financial situation or particular needs. Before you act on any recommendation that may be contained in this report, independent advice ought to be sought from a financial adviser regarding the suitability of the investment product, taking into account your specific investment objectives, financial situation or particular needs.
StoneX Financial Pte. Ltd., may distribute reports produced by its respective foreign entities or affiliates within the StoneX group of companies or third parties pursuant to an arrangement under Regulation 32C of the Financial Advisers Regulations. Where the report is distributed to a person in Singapore who is not an accredited investor, expert investor or an institutional investor (as defined in the Securities Futures Act), StoneX Financial Pte. Ltd. accepts legal responsibility to such persons for the contents of the report only to the extent required by law. Singapore recipients should contact StoneX Financial Pte. Ltd. at 6826 9988 for matters arising from, or in connection with the report.
In the case of all other recipients of this report, to the extent permitted by applicable laws and regulations neither StoneX Financial Pte. Ltd. nor its associated companies will be responsible or liable for any loss or damage incurred arising out of, or in connection with, any use of the information contained in this report and all such liability is hereby expressly disclaimed. No representation or warranty is made, express or implied, that the content of this report is complete or accurate.
StoneX Financial Pte. Ltd. is not under any obligation to update this report.
Trading CFDs carries a high level of risk that may not be suitable for some investors. Consider your investment objectives, level of experience, financial resources, risk appetite and other relevant circumstances carefully. The possibility exists that you could lose some or all of your investments, including your initial deposits. If in doubt, please seek independent expert advice. Visit www.forex.com/en-sg/terms-and-policies for the complete Risk Disclosure Statement.