







Nikkei 225, China A50 Analysis: Long China, Short Japan?
Nikkei futures are on track for their most volatile day since August, which will please the large speculators that ramped up their short bets three weeks ago. Bur for a less bearish atmosphere in APAC, the China A50 has caught my eye for a potential long.
Share this:

View related analysis:
- Nasdaq 100, S&P 500 Forecast: Bring Your Quarter to the Slaughter?
- EUR/USD, GBP/USD Diverge, Wall Street Whacked on Trump Tariffs
- AUD/USD, USD/CAD Price Action Clues Could Bode Well for AUD/CAD Bears
View related analysis:
- Nasdaq 100, S&P 500 Forecast: Bring Your Quarter to the Slaughter?
- EUR/USD, GBP/USD Diverge, Wall Street Whacked on Trump Tariffs
- AUD/USD, USD/CAD Price Action Clues Could Bode Well for AUD/CAD Bears
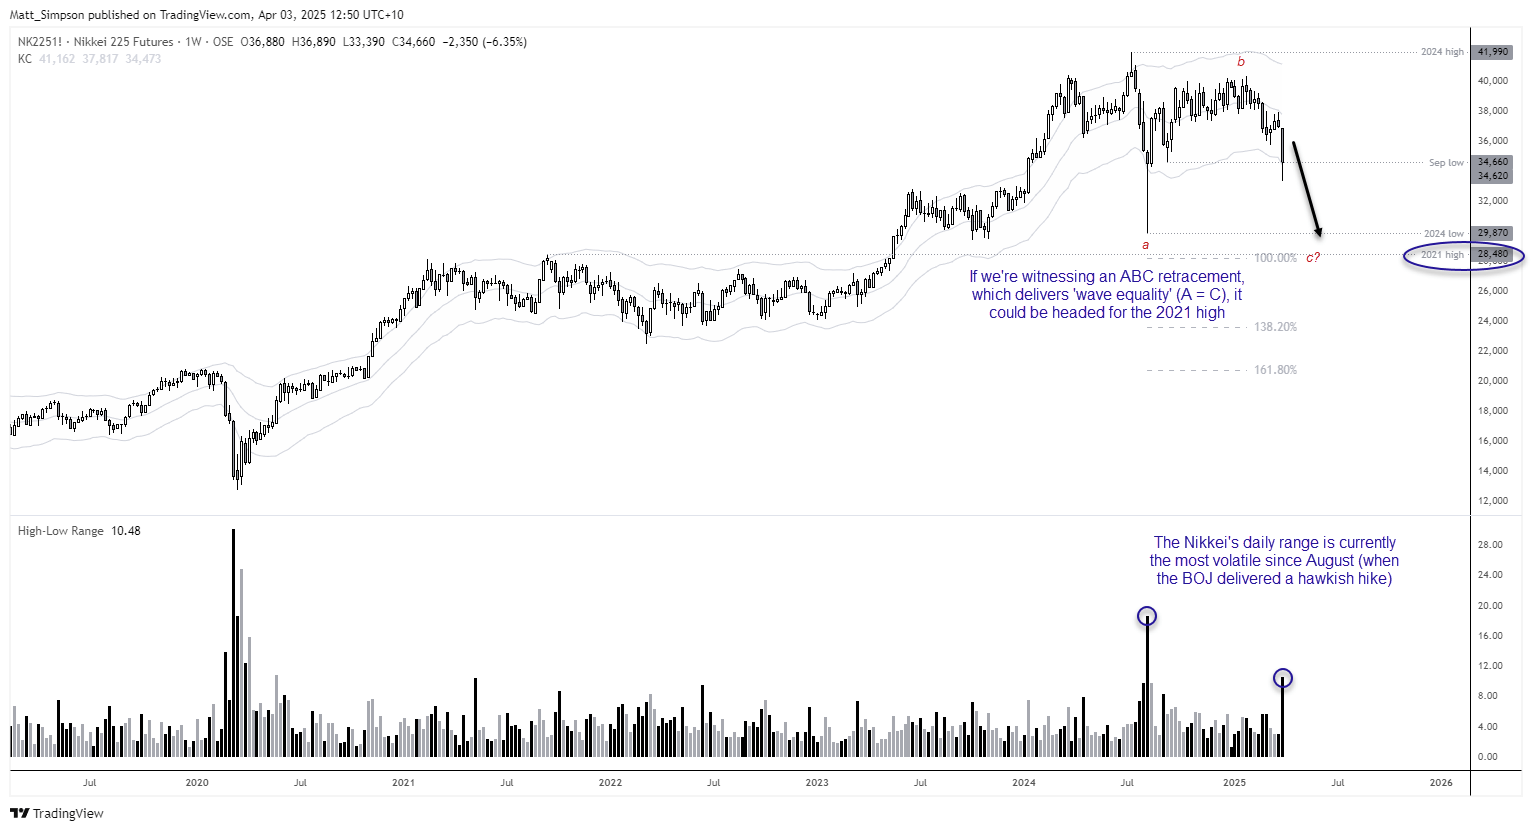
Nikkei futures currently have a day’s high-to-low range of -9%, which puts it on track for its most volatile day since 5th of August 2024. That date is no coincidence, given concerns of a US recession coupled with a carry-trade unwind was coupled with a hawkish hike form the Bank of Japan. And that resulted in the most volatile day for the Nikkei since the 1987 crash.
It’s also fair to say we now face similar circumstances in light of Trump’s tariffs seeing the light of day, weighing on Wall Street futures and dragging the Nikkei along with it.
The daily chart shows that momentum is turning lower on the Nikkei once more, even if today’s near 10% decline is just half that seen in August. But if we’re witnessing an ABB move lower and it delivers ‘wave equality (where wave A = wave C) then we could be looking at a move down to the 2021 high. But whether it falls that far could come down to asset managers.
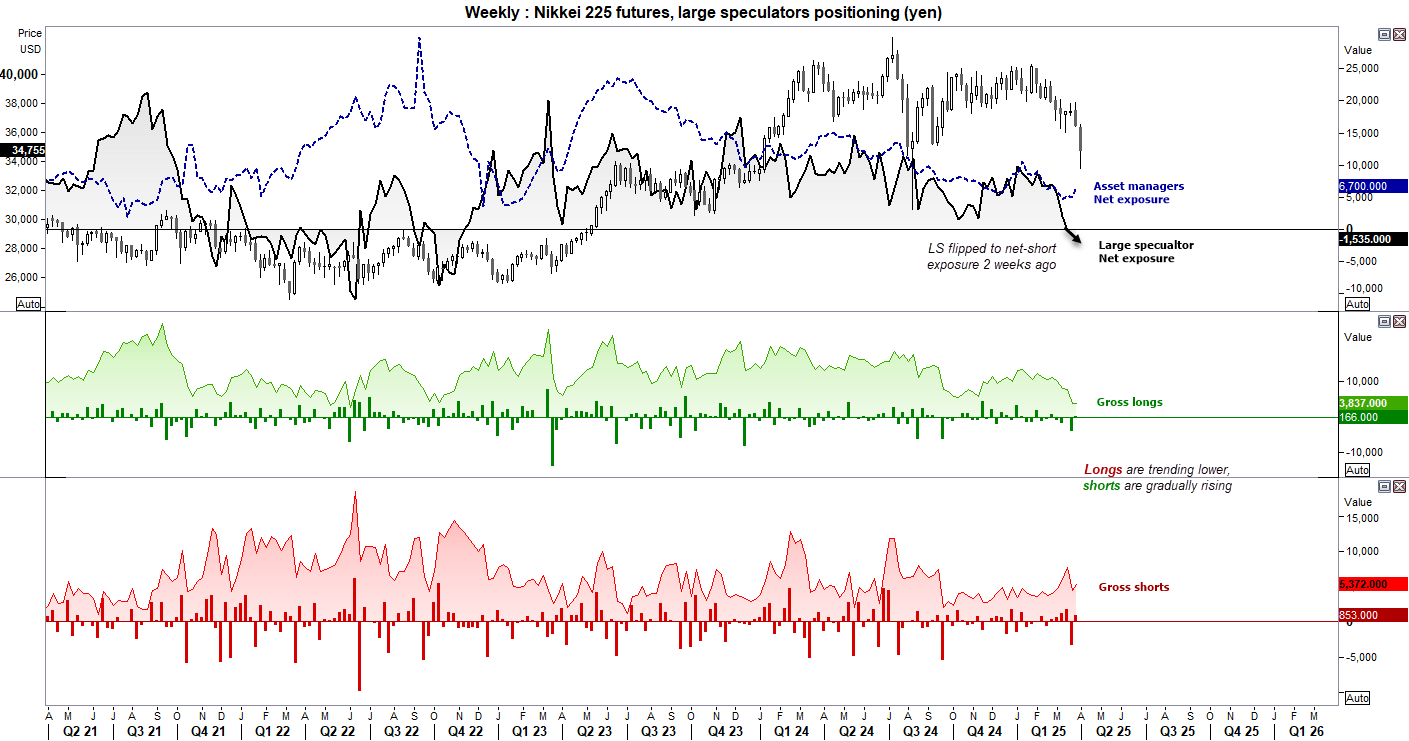
Nikkei Futures Positioning (in Japanese yen) – COT Report
Large speculators flipped to net-short exposure on Nikkei futures three weeks ago. That appears to have paid off, given Nikkei futures are now around 12% lower. This week’s losses could also force the asset managers who increased their net-long exposure last week to reconsider their positions.
To expect a large move lower on the Nikkei, we likely need to see asset managers continue to reduce their net-long exposure or even flip to net-short over the coming weeks. This is a key metric to watch to decipher the depth of any Nikkei sell-off. Of course, we also need to factor in the Japanese yen. Should appetite for risk remain on the ropes, demand for the yen could rise, and the Nikkei might feel the pinch of a stronger yen and lower Nasdaq 100.
Gold FY
China A50 Technical Analysis
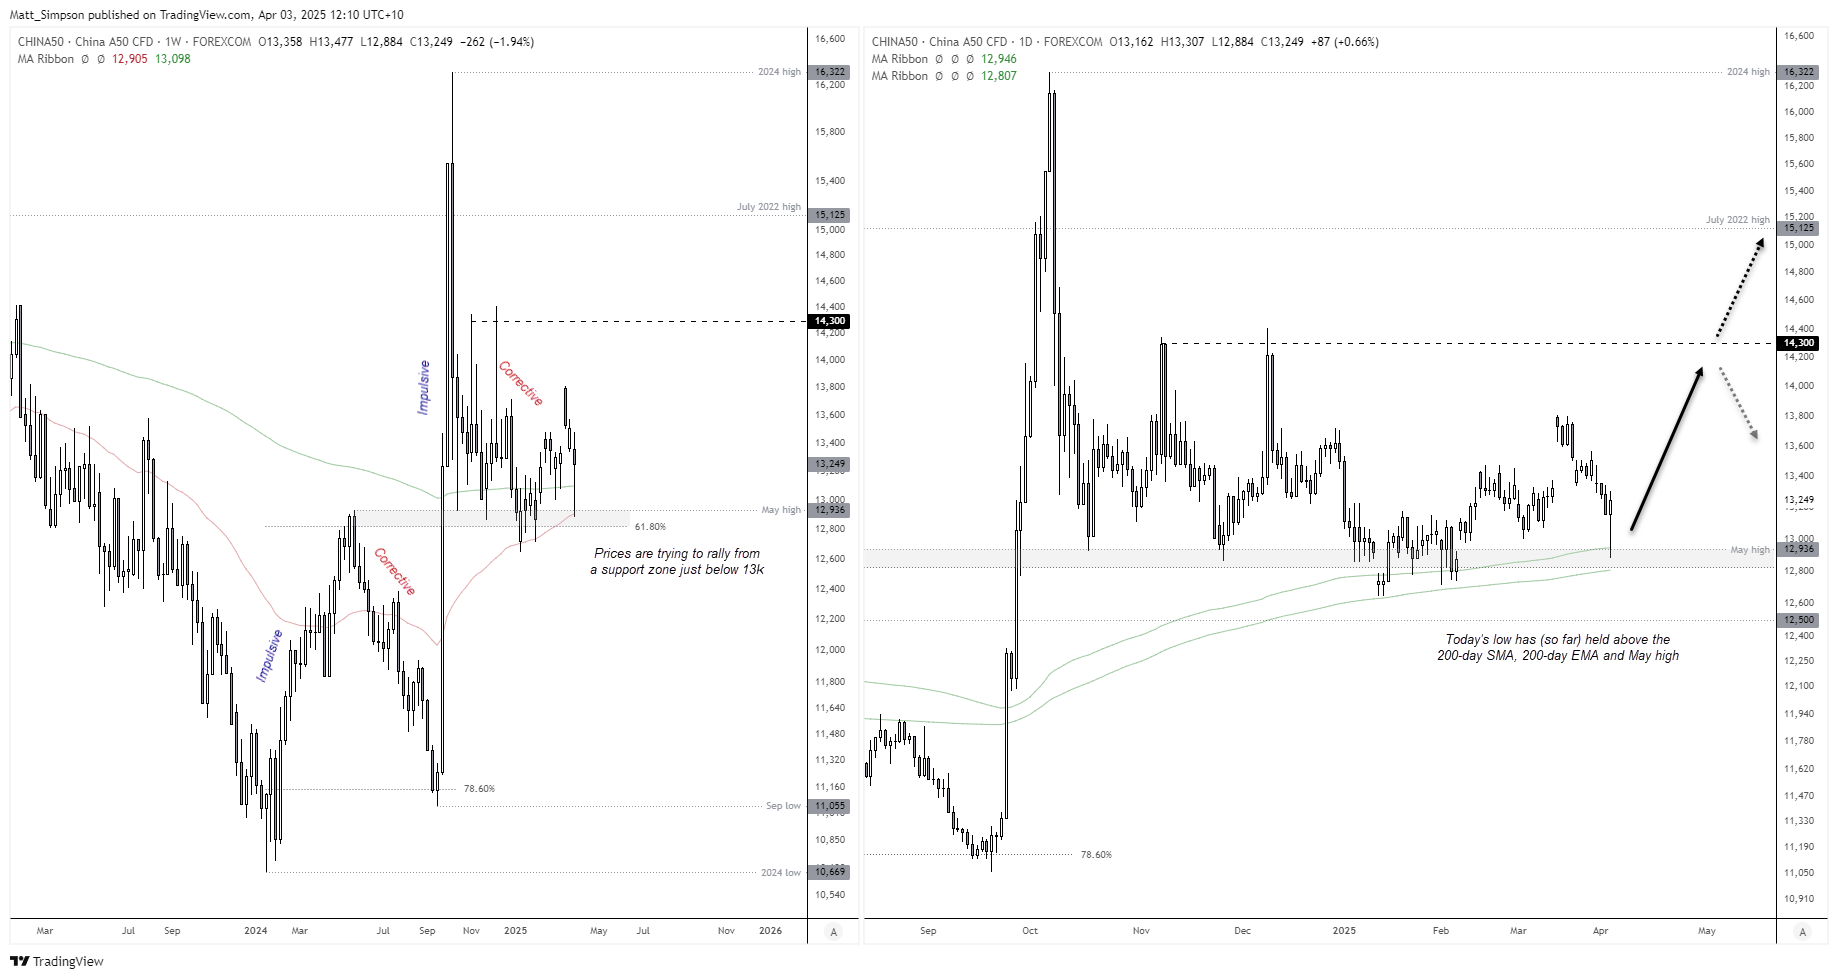
The China A50 stumped up a 53% rally from the 2024 low to high, although a significant chunk of that arrived over three weeks in October. It may not have lasted long above the 16,000 handle, but it has mostly held onto above the May high since. The weekly timeframe has since provided choppy action, but a bullish picture seems to be once again emerging.
This week’s low has seen the China A50 remain above a long-term 61.8% Fibonacci ratio, bounce from the 50-weem EMA and May high. It could also be on track to close above the 200-day EMA.
The daily chart shows that today’s low (so far, at least) has held above the 200-day SMA and 200-day EMA. Given the significance of the moving average on the weekly and daily timeframe prices are holding above, the bias is for a move to thew double top ~14,300
-- Written by Matt Simpson
Follow Matt on Twitter @cLeverEdge
How to trade with City Index
You can trade with City Index by following these four easy steps:
- Open an account, or log in if you’re already a customer
• Open an account in the UK
• Open an account in Australia
• Open an account in Singapore
- Search for the market you want to trade in our award-winning platform
- Choose your position and size, and your stop and limit levels
- Place the trade
Related tags:
Latest market news




Open an account in minutes
Experience award-winning platforms with fast and secure execution, and enjoy tight spreads from 0.5 pts on FX and 0.3 pts on indices.
Economic calendar
Web Trader platform
Our sophisticated web-based platform is packed with features.
Related articles
Silver's bullish breakout case builds as bond yields retreat
The Democratic blue wave has sent crude and Treasury yields sharply lower, improving the outlook for precious metals. With gold already breaking higher, could silver be next?
Gold Reclaims $4,000, Bulls Eye Reversal with Seasonality Tailwind
Gold futures rebound above $4,000 as falling US yields, improving sentiment and bullish seasonality raise hopes of a significant reversal.
Swiss Franc Short-term Outlook: USD/CHF Selloff Nears Critical Support Ahead of NFP 11 4 2026
USD/CHF bears are closing in on critical trend support, with the next reaction likely to determine whether the October decline has further to run.

This report is intended for general circulation only. It should not be construed as a recommendation, or an offer (or solicitation of an offer) to buy or sell any financial products. The information provided does not take into account your specific investment objectives, financial situation or particular needs. Before you act on any recommendation that may be contained in this report, independent advice ought to be sought from a financial adviser regarding the suitability of the investment product, taking into account your specific investment objectives, financial situation or particular needs.
StoneX Financial Pte. Ltd., may distribute reports produced by its respective foreign entities or affiliates within the StoneX group of companies or third parties pursuant to an arrangement under Regulation 32C of the Financial Advisers Regulations. Where the report is distributed to a person in Singapore who is not an accredited investor, expert investor or an institutional investor (as defined in the Securities Futures Act), StoneX Financial Pte. Ltd. accepts legal responsibility to such persons for the contents of the report only to the extent required by law. Singapore recipients should contact StoneX Financial Pte. Ltd. at 6826 9988 for matters arising from, or in connection with the report.
In the case of all other recipients of this report, to the extent permitted by applicable laws and regulations neither StoneX Financial Pte. Ltd. nor its associated companies will be responsible or liable for any loss or damage incurred arising out of, or in connection with, any use of the information contained in this report and all such liability is hereby expressly disclaimed. No representation or warranty is made, express or implied, that the content of this report is complete or accurate.
StoneX Financial Pte. Ltd. is not under any obligation to update this report.
Trading CFDs carries a high level of risk that may not be suitable for some investors. Consider your investment objectives, level of experience, financial resources, risk appetite and other relevant circumstances carefully. The possibility exists that you could lose some or all of your investments, including your initial deposits. If in doubt, please seek independent expert advice. Visit www.forex.com/en-sg/terms-and-policies for the complete Risk Disclosure Statement.