









Nasdaq 100, S&P 500 Forecast: Bring Your Quarter to the Slaughter?
The Nasdaq 100 and S&P 500 just suffered their worst quarter in three years. Given it occurred just after record high, it begs the question as to whether bulls are in for another rough quarter.
Share this:

View related analysis:
- If Consumers Don’t Consume, a Recession Could be Presumed
- EUR/USD, Dollar Index, VIX Analysis: COT report
- AUD/USD weekly outlook: RBA, ISMs and NFP in Focus
- Nasdaq 100, S&P 500 Feel the Force of Trump’s Tariffs, ASX to Open Lower
View related analysis:
- If Consumers Don’t Consume, a Recession Could be Presumed
- EUR/USD, Dollar Index, VIX Analysis: COT report
- AUD/USD weekly outlook: RBA, ISMs and NFP in Focus
- Nasdaq 100, S&P 500 Feel the Force of Trump’s Tariffs, ASX to Open Lower
S&P 500, Nasdaq quarterly charts
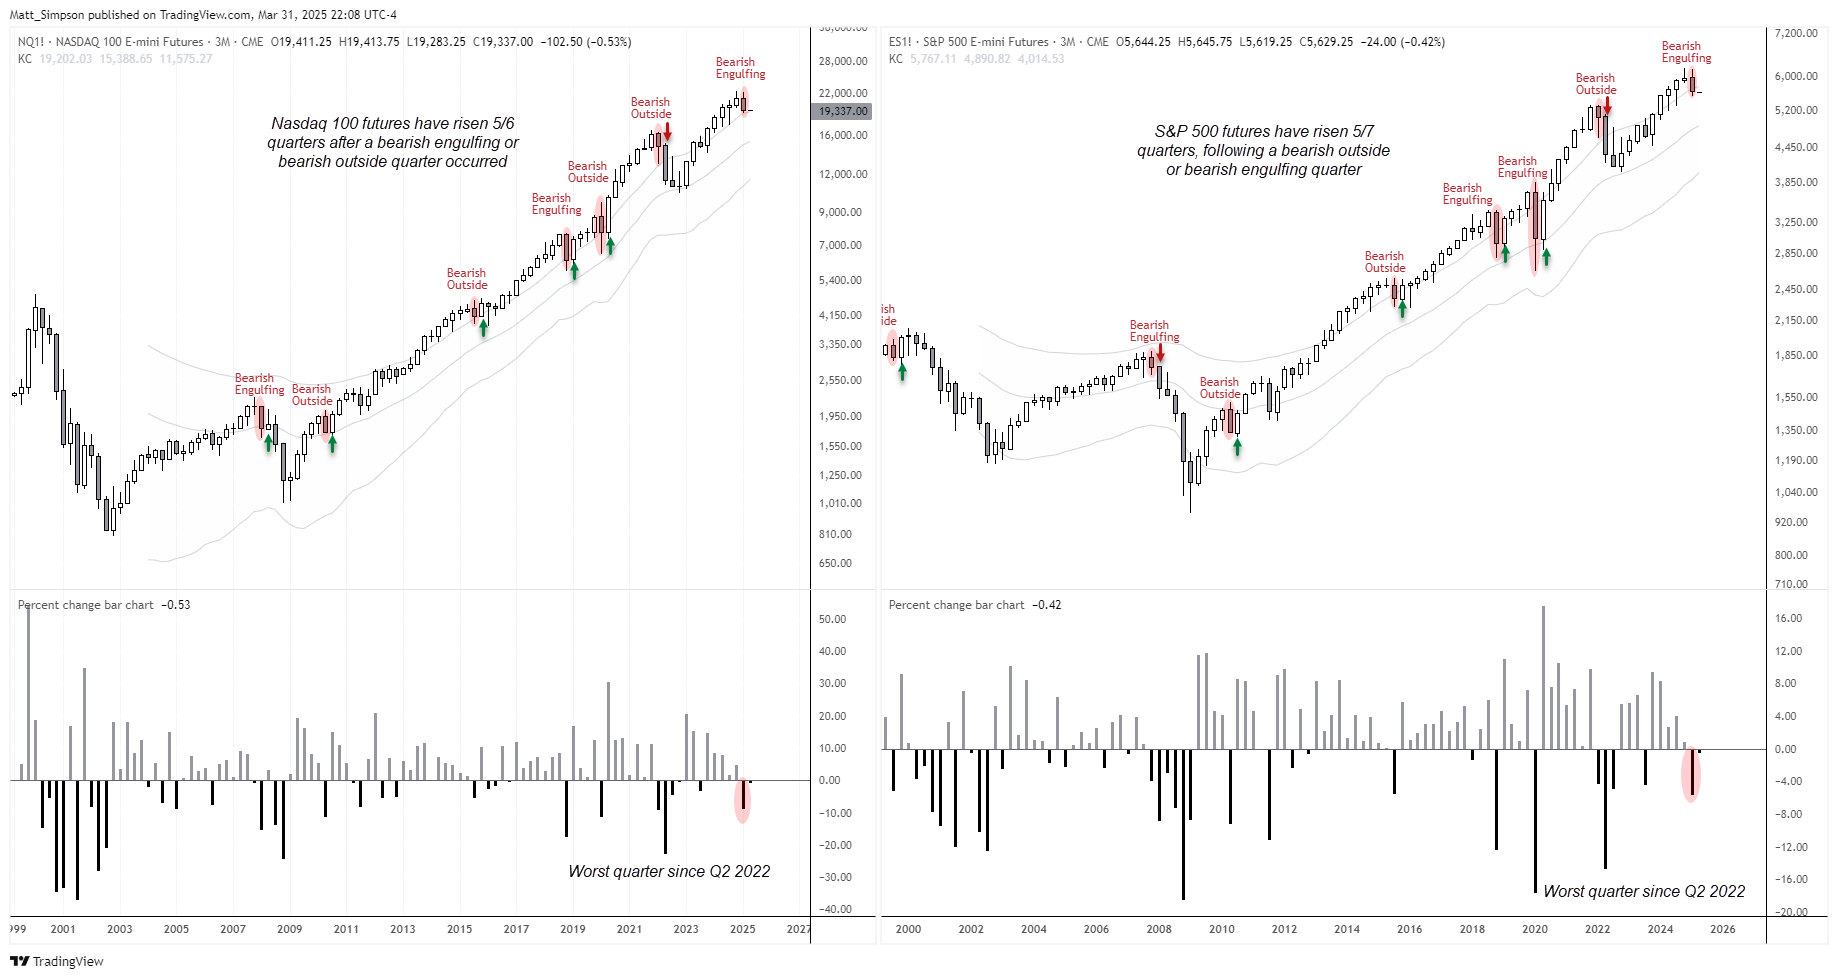
To be exact, we just witnessed the worst quarter for the S&P 500 and Nasdaq 100 futures in 11 quarters. Their Q1 bearish candle not only snapped a 5-quarter winning streak for both indices but also formed bearish engulfing candles. Given this happened the month following a record high, I was intrigued to see how reliable this pattern could be on this timeframe.
Having looked through futures data for the Nasdaq 100 and S&P 500, I have manually marked either a bullish engulfing or bearish outside quarter.
- There are only six prior occurrences on the Nasdaq 100, and seven on the S&P 500
- Nasdaq 100 futures have risen 6/7 quarters, after a bearish engulfing or outside quarter has occurred
- S&P 500 futures have risen 5/7 quarters, following a bearish outside or engulfing quarter
- Or put another way, the Nasdaq has only declined for a second consecutive quarter on one occasion following a bearish outside or engulfing quarter, whereas the S&P 500 has fallen twice
From this metric alone, the odds do not appear great enough to assume another consecutive bearish quarter.
But if we factor in Trump’s tariffs, weaker consumer sentiment and rising inflation expectations, I don’t feel inclined to simply bet on a bullish Q2 either from these stats. Each data point has a story behind it, and context can matter.
Nasdaq 100 Technical Analysis
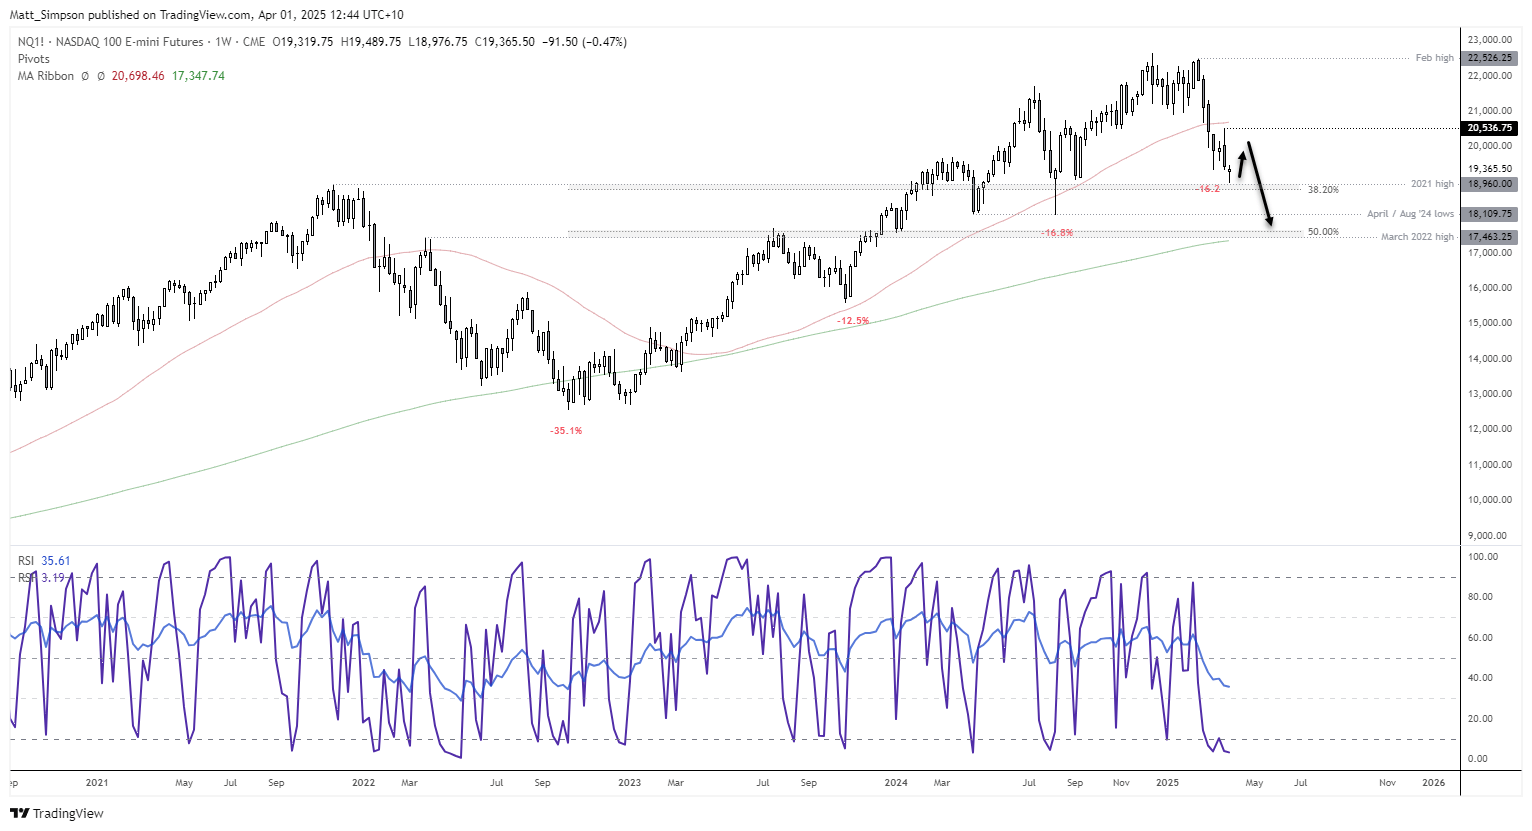
The weekly chart shows prices are holding just above the 2021 high, near a 38.2% Fibonacci level. The RSI (2) oversold, though no bullish divergence has formed, while the RSI (14) is confirming the bearish price action and not yet oversold. This suggests further lows, even if we need to allow for a few corrective bounces along the way.
Last week’s prominent bearish engulfing candle and 50-week SMA suggest resistance arounds 20,536 – 20,700, assuming any corrective bounce can make it that far. The core bias is for a move down towards the 200-week SMA, with the March 2022 high (17,436), 50% retracement level and swing lows ~18,100 potentially providing interim support levels along the way.
S&P 500 technical analysis
While I also have a bearish bias for the S&P 500, it is not as bearish as the Nasdaq 100. While both indices fell in Q1, the losses on the S&P just under half seen on the Nasdaq. Furthermore, asset managers are actively betting against the Nasdaq and have been stepping away from longs for much longer period, compared with the S&P 500 (more on that below).
Last week’s bearish engulfing high met resistance at the 50-week SMA and November low. A small bullish divergence has formed on the RSI (2) in the oversold zone, so perhaps this could be the better bet for Wall Street bulls over the near term. But like the Nasdaq, I will also been seeking evidence of a swing high beneath its respective bearish engulfing high in anticipation of further losses.
Downside targets for bears could include the 2021 high, or 5400 handle just above it. A break beneath which brings a potential support zone ~5200 into view, and the 200-week SMA or 2023 high, just above thew 5,000 handle.
S&P 500 (ES), Nasdaq 100 (NQ) futures market positioning – COT report
- Asset managers increased net-long exposure to S&P 500 and Nasdaq futures for the first week in five last week
- S&P 500 gross longs rose 49.7k contracts (fastest pace in 17 weeks) and shorts decreased by -202.5k contracts (fastest pace in 32 weeks)
- But the fact that prices accelerated lower last week strongly suggest a reversal of these traders, so I suspect we’ll see net-long exposure fall in the next report
- Looking at the bigger picture, net-long exposure to Nasdaq futures topped in February 2024, and short bets against it have been trending higher this year
- While shot bets against the S&P 500 remain relatively low, net-long exposure topped in December
-- Written by Matt Simpson
Follow Matt on Twitter @cLeverEdge
How to trade with City Index
You can trade with City Index by following these four easy steps:
- Open an account, or log in if you’re already a customer
• Open an account in the UK
• Open an account in Australia
• Open an account in Singapore
- Search for the market you want to trade in our award-winning platform
- Choose your position and size, and your stop and limit levels
- Place the trade
Related tags:




Open an account in minutes
Experience award-winning platforms with fast and secure execution, and enjoy tight spreads from 0.5 pts on FX and 0.3 pts on indices.
Economic calendar
Web Trader platform
Our sophisticated web-based platform is packed with features.
Related articles
S&P 500, Nasdaq, Dow Forecast: Nasdaq Selloff Deepens as Dow Rally Stalls 10 24 2026
A failed S&P breakout and looming Nasdaq support test raise the stakes for next week’s Fed decision and October’s monthly close.

Silver forecast: metals liquidation drags XAG/USD into $50-55 support
Silver has broken its July low and slipped into a long-term support zone as the selling in precious metals deepens. The chart shows where the metal could bottom, and next week's Fed decision may decide whether it does.


Nasdaq 100 Forecast: NDX Falls as the tech rout continues and oil prices soar
U.S. stocks are pointing to a modestly lower open after a sharp AI sell-off yesterday, as telecom stocks slide. Brent rises towards $115 adding to inflation pressures ahead of the FOMC rate decision.

This report is intended for general circulation only. It should not be construed as a recommendation, or an offer (or solicitation of an offer) to buy or sell any financial products. The information provided does not take into account your specific investment objectives, financial situation or particular needs. Before you act on any recommendation that may be contained in this report, independent advice ought to be sought from a financial adviser regarding the suitability of the investment product, taking into account your specific investment objectives, financial situation or particular needs.
StoneX Financial Pte. Ltd., may distribute reports produced by its respective foreign entities or affiliates within the StoneX group of companies or third parties pursuant to an arrangement under Regulation 32C of the Financial Advisers Regulations. Where the report is distributed to a person in Singapore who is not an accredited investor, expert investor or an institutional investor (as defined in the Securities Futures Act), StoneX Financial Pte. Ltd. accepts legal responsibility to such persons for the contents of the report only to the extent required by law. Singapore recipients should contact StoneX Financial Pte. Ltd. at 6826 9988 for matters arising from, or in connection with the report.
In the case of all other recipients of this report, to the extent permitted by applicable laws and regulations neither StoneX Financial Pte. Ltd. nor its associated companies will be responsible or liable for any loss or damage incurred arising out of, or in connection with, any use of the information contained in this report and all such liability is hereby expressly disclaimed. No representation or warranty is made, express or implied, that the content of this report is complete or accurate.
StoneX Financial Pte. Ltd. is not under any obligation to update this report.
Trading CFDs carries a high level of risk that may not be suitable for some investors. Consider your investment objectives, level of experience, financial resources, risk appetite and other relevant circumstances carefully. The possibility exists that you could lose some or all of your investments, including your initial deposits. If in doubt, please seek independent expert advice. Visit www.forex.com/en-sg/terms-and-policies for the complete Risk Disclosure Statement.