




NVDA Earnings Preview: Nasdaq 100 Vulnerable Ahead of AI Darling Nvidia’s Results
Options traders expect a +/- 11% move in response to Nvidia’s earnings report, a truly staggering move in a $1.8T stock. See what we're watching!
Share this:

NVDA, Nasdaq 100 Key Points
- NVDA has “beat” analyst estimates in seven of the last eight earnings reports, with the stock rising an average of more than 7%.
- Options traders expect a +/- 11% move in response to Nvidia’s earnings report, a truly staggering move in a $1.8T stock.
- NVDA is seeing its biggest drop of the year so far to trade below its short-term 8-day EMA for the first time in seven weeks
When are Nvidia’s Earnings?
Nvidia reports its Q4 earnings on Wednesday, February 21st after the market close.
What are Nvidia’s Earnings Expectations
Analysts expect Nvidia to report $4.58 in EPS on $20.6B in revenue.
Nvidia Earnings Preview
One definition of a market darling is “a stock that is often discussed at dinner parties and rarely questioned as a good investment.” By that definition, Nvidia (NVDA) is the quintessential market darling in the current environment.
Positioned at the epicenter of the AI revolution, Nvidia’s stock has quintupled since the start of 2023 as demand for its semiconductors as gone parabolic. Just last week alone, the company saw its market capitalization rise to $1.8T, eclipsing Amazon and Alphabet/Google to become the third most valuable US stock. Now that the rest of the “Magnificent Seven” stocks have reported mostly strong earnings, the big question on traders’ minds is whether Nvidia can continue to deliver exceptional results.
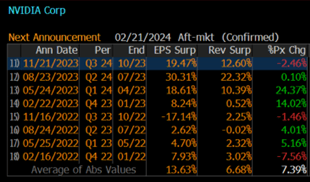
As the graphic below shows, NVDA has “beat” analyst estimates for both earnings (by an average of 14%) and revenues (by an average of 7%) in seven of the last eight earnings reports, with the stock rising an average of more than 7% in response to those results:
Source: Bloomberg
Heading into the week’s release, traders are expecting an even bigger-than-average move, with the implied volatility on options suggesting that we could see a +/- 11% move in response to Nvidia’s earnings report, a truly staggering move in a $1.8T stock.
Beyond the company’s raw results, investors will be particularly keen to see how Nvidia’s CEO Jensen Huang sees demand developing across the rest of the year. Any signs that the AI boom may be slowing could lead to a big bearish reversal in the stock, so traders are justifiably on tenterhooks ahead of the release.
Nvidia Technical Analysis – NVDA Daily Chart
Source: TradingView, StoneX
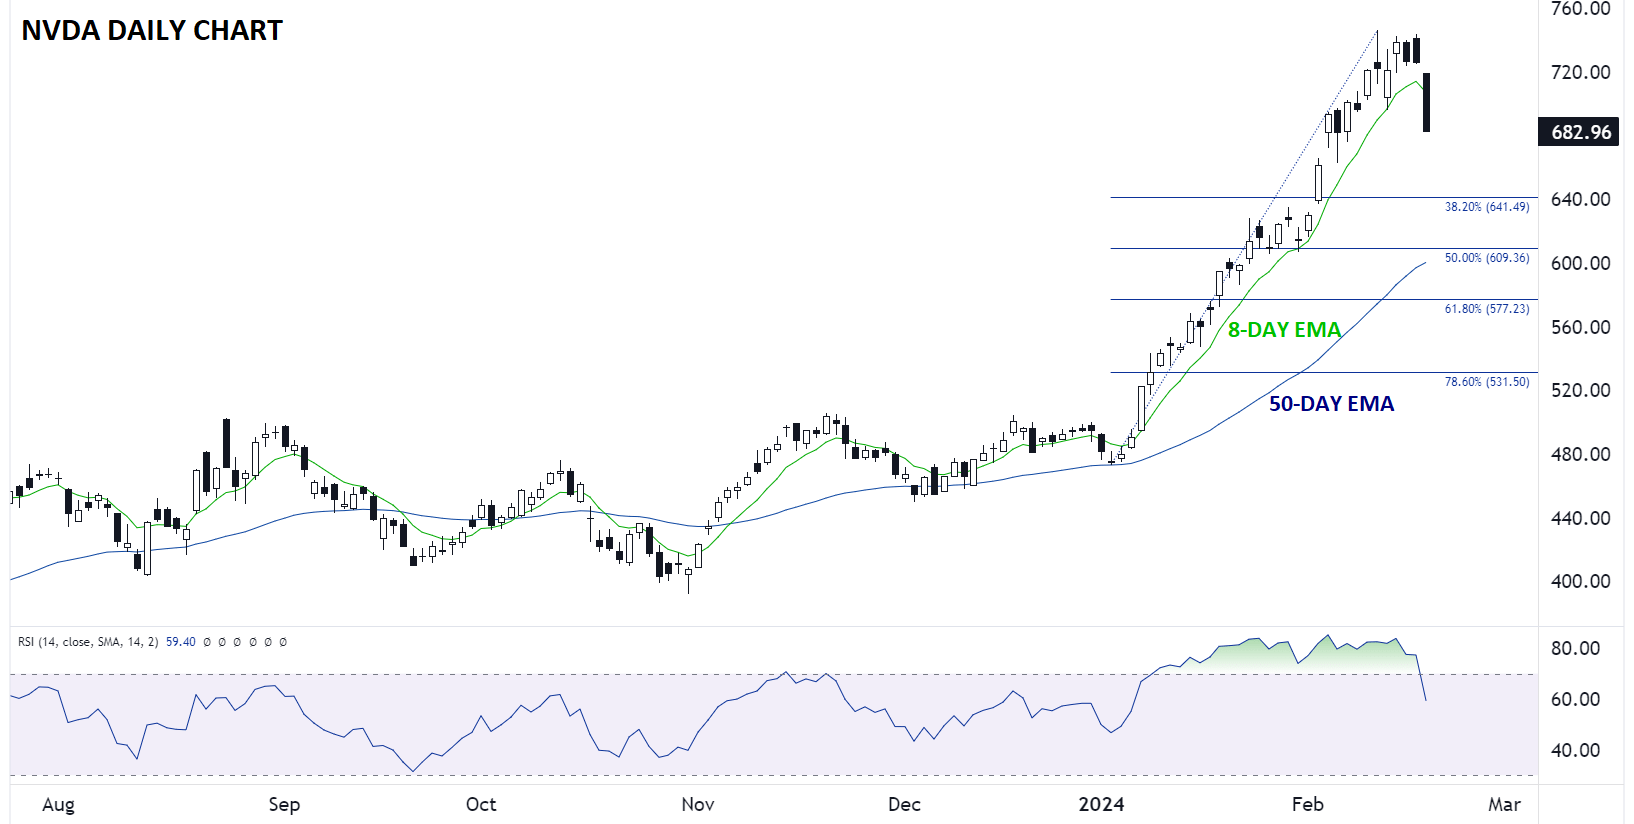
Technically speaking, NVDA has had an insane start to the year, surging from below $500 on New Year’s Day to an intraday high near $750 last week. As of writing Wednesday morning, NVDA is seeing its biggest drop of the year so far to trade below its short-term 8-day EMA for the first time in seven weeks.
It’s not surprising that some traders may want to take profits ahead of the big earnings report, but the current selling could also be an ominous sign if the results don’t quite meet the high hurdle expected by traders…or if earnings and revenues technically “beat” expectations slightly but the stock fails to see a meaningful rally. After such an impressive rally, even a shallow 38.2% or 50% Fibonacci retracement could take the stock back toward $640 or $610.
Nasdaq 100 Technical Analysis – NDX Daily Chart
Source: TradingView, StoneX
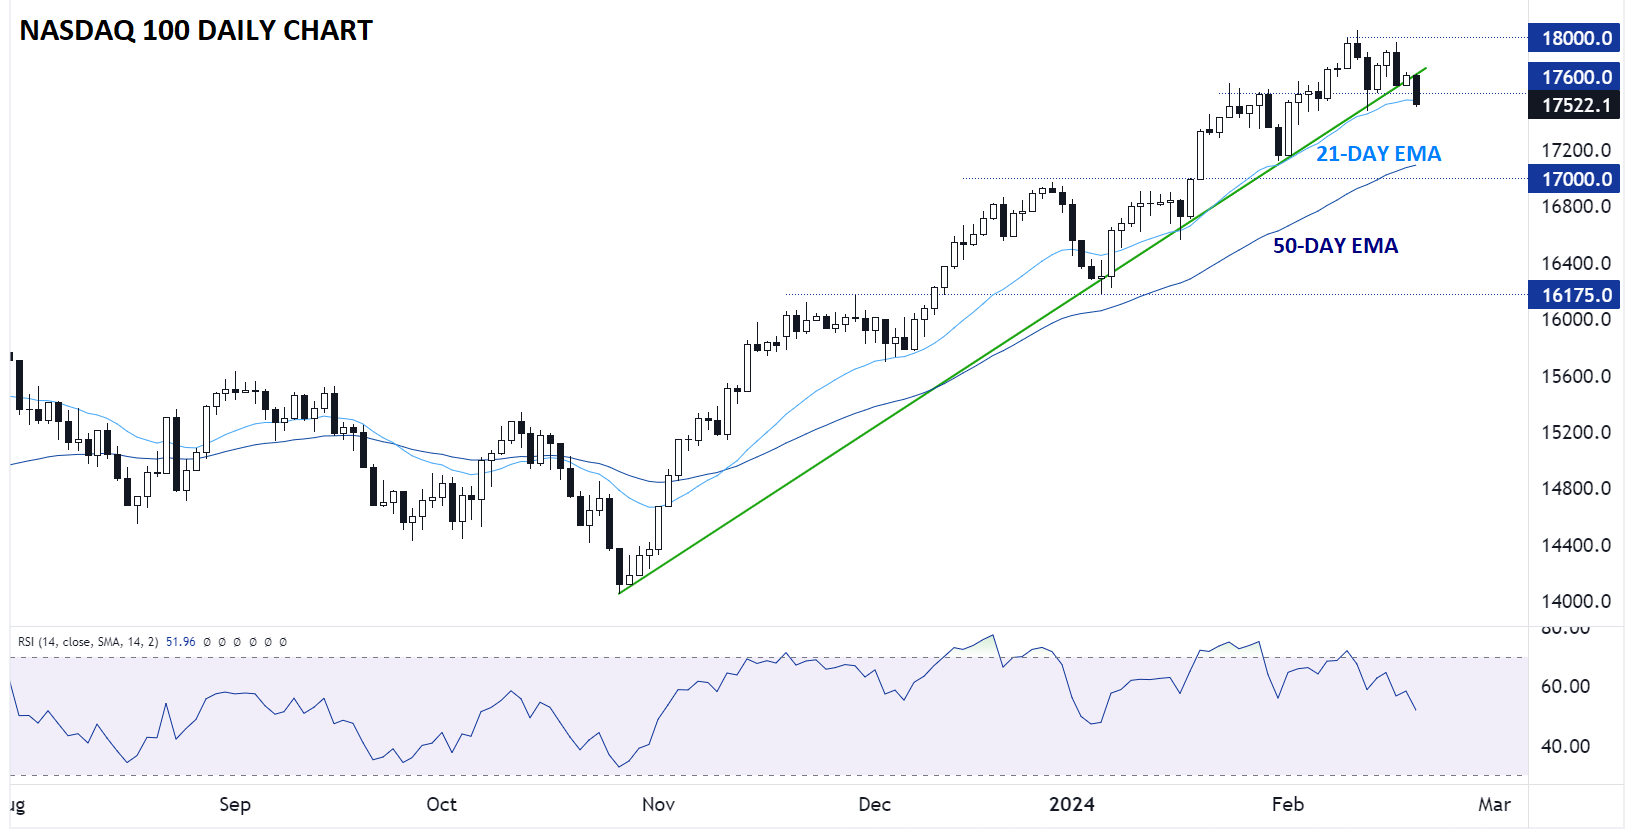
With an elevated 5%+ allocation to NVDA (not to mention the downstream effects of NVDA’s earnings on other semiconductor- and AI-focused names), the Nasdaq 100 may also see a dramatic move in response to this week’s earnings.
Looking at the chart, the Nasdaq 100 is on track to break the bullish trend line off its late-October lows in early trade today, potentially opening the door for a deeper retracement toward the 50-day EMA in the $17K area. At this point, it may take blowout earnings figure from Nvidia to reinvigorate the Nasdaq 100’s fading bullish momentum.
-- Written by Matt Weller, Global Head of Research
Follow Matt on Twitter: @MWellerFX
Related tags:
Latest market news




Open an account in minutes
Experience award-winning platforms with fast and secure execution, and enjoy tight spreads from 0.5 pts on FX and 0.3 pts on indices.
Economic calendar
Web Trader platform
Our sophisticated web-based platform is packed with features.
Related articles
Euro Technical Forecast: EUR/USD Five-Week Range Puts Yearly Lows on the Line 11 7 2026
Euro support has held, but the bulls have struggled to gain ground as next week's U.S. CPI sets the stage for a potentially decisive EUR/USD breakout.
Australian Dollar Short-term Outlook: AUD/USD 3% Plunge Puts Multi-Month Range at Risk 11 6 2026
A sharp equity-led selloff has driven AUD/USD toward critical June-low support, with strong NFP data adding pressure ahead of next week’s U.S. CPI.

Nasdaq 100 forecast: Tech stocks rebound but AI concerns linger
The Nasdaq 100 rebound has run into former support as fears over AI regulation and spending linger. Fawad Razaqzada explains why he maintains a cautious forecast and where the key levels sit.

This report is intended for general circulation only. It should not be construed as a recommendation, or an offer (or solicitation of an offer) to buy or sell any financial products. The information provided does not take into account your specific investment objectives, financial situation or particular needs. Before you act on any recommendation that may be contained in this report, independent advice ought to be sought from a financial adviser regarding the suitability of the investment product, taking into account your specific investment objectives, financial situation or particular needs.
StoneX Financial Pte. Ltd., may distribute reports produced by its respective foreign entities or affiliates within the StoneX group of companies or third parties pursuant to an arrangement under Regulation 32C of the Financial Advisers Regulations. Where the report is distributed to a person in Singapore who is not an accredited investor, expert investor or an institutional investor (as defined in the Securities Futures Act), StoneX Financial Pte. Ltd. accepts legal responsibility to such persons for the contents of the report only to the extent required by law. Singapore recipients should contact StoneX Financial Pte. Ltd. at 6826 9988 for matters arising from, or in connection with the report.
In the case of all other recipients of this report, to the extent permitted by applicable laws and regulations neither StoneX Financial Pte. Ltd. nor its associated companies will be responsible or liable for any loss or damage incurred arising out of, or in connection with, any use of the information contained in this report and all such liability is hereby expressly disclaimed. No representation or warranty is made, express or implied, that the content of this report is complete or accurate.
StoneX Financial Pte. Ltd. is not under any obligation to update this report.
Trading CFDs carries a high level of risk that may not be suitable for some investors. Consider your investment objectives, level of experience, financial resources, risk appetite and other relevant circumstances carefully. The possibility exists that you could lose some or all of your investments, including your initial deposits. If in doubt, please seek independent expert advice. Visit www.forex.com/en-sg/terms-and-policies for the complete Risk Disclosure Statement.