



Nvidia Earnings Preview: Nasdaq 100 Coiling Uptrend Ahead of NVDA Earnings
With NVDA options traders pricing in “only” a +/- 6% move on the release, a big earnings surprise could catch traders off-guard given the technical setup
Share this:

When are Nvidia’s Earnings?
Nvidia reports earnings on Wednesday, August 27 after the market close.
What are Nvidia’s Earnings Expectations
Analysts expect Nvidia to report $1.01 in EPS on $46B in revenue.
Nvidia Earnings Preview
Nvidia (NVDA) is set to release its fiscal second-quarter results after the bell on Wednesday, marking two years since the AI boom reshaped the company’s trajectory. Since OpenAI’s ChatGPT ignited demand for generative AI, Nvidia’s revenue has more than tripled and profits have quadrupled, propelling the stock 12X higher since late 2022. To much fanfare, the company recently became the world’s first to hit a $4 trillion market capitalization, underscoring its central role in the AI economy.
Wall Street expects Nvidia to report earnings per share of $1.01 on revenue of roughly $46 billion, reflecting a 53% year-over-year sales increase. While still impressive, growth has slowed from the triple-digit surges seen in 2023–24. Data center revenue, driven by hyperscalers such as Microsoft, Google, Amazon, and Meta, remains the cornerstone of Nvidia’s business, accounting for nearly 90% of sales last quarter. In fact, analysts estimate about half of all AI capital expenditures ultimately flow to Nvidia, highlighting both its dominance and its reliance on a concentrated customer base.
For this quarter’s earnings report, the spotlight will be on Nvidia’s Blackwell GPU line, which generated $27 billion in sales last quarter and now represents 70% of data center revenue. From previous earnings reports, we can infer that there was relatively strong demand, though much of that will be priced in after a +20% rally since the start of the quarter. As always, forward guidance will be closely scrutinized; Wall Street consensus is calling for Q3 revenue of about $53 billion, but analysts caution Nvidia may guide conservatively by excluding potential H20 chip sales to China (a key geopolitical flashpoint) amid regulatory uncertainty.
Ultimately, the playbook for this quarter may be similar to previous earnings reports: A “beat and raise” quarter could reignite AI enthusiasm, while a softer outlook may raise fears that AI infrastructure spending could (finally) be slowing. Either way, CEO Jensen Huang’s commentary on demand, supply, and geopolitics will be pivotal for both Nvidia’s stock and the broader AI trade.
Nvidia Technical Analysis: NVDA Daily Chart
Source: StoneX, TradingView
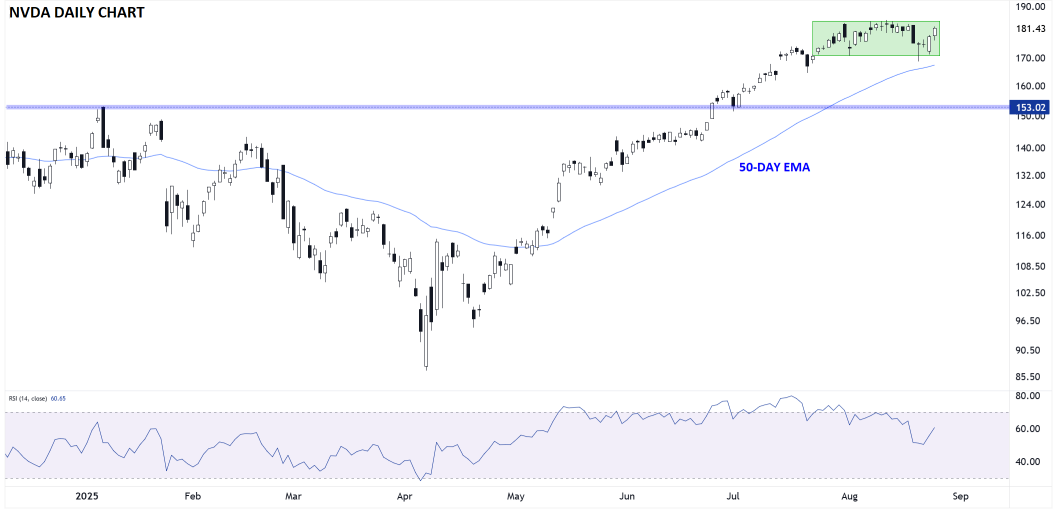
From a technical perspective, Nvidia (NVDA) itself remains in a well-defined uptrend, putting in consistent higher highs and higher lows above its rising 50-day EMA. The stock has spent the last month consolidating in the $170-$185 range, perhaps in anticipation of this week’s earnings report.
The relatively tight consolidation range could set the stage for a higher-volatility breakout in one direction or another. With options traders pricing in “only” a +/- 6% move on the release, a big surprise could catch traders off-guard given the technical setup. As long as the stock remains above its 50-day EMA (current nearly $167), the path of least resistance will remain to the topside.
Nasdaq 100 Technical Analysis: NDX Daily Chart
Source: StoneX, TradingView
After the impressive rally we’ve seen in the last few years, Nvidia now represents nearly 10% of the Nasdaq 100’s weighting, in addition to its significance as a market leader and trendsetter for the broader AI theme that continues to support the tech-focused index.
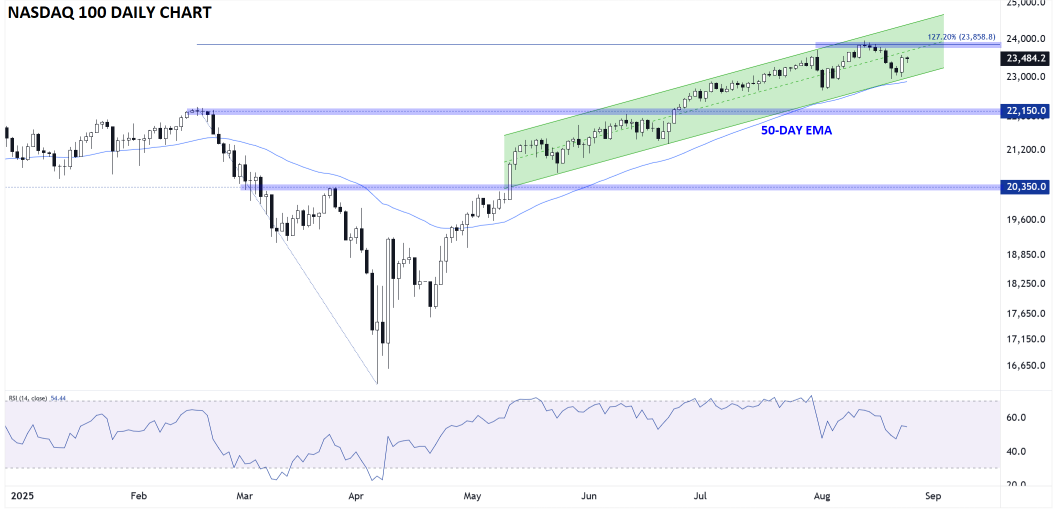
Not surprisingly, the Nasdaq 100 is in a strong uptrend of its own, holding within a rising bullish channel above its 50-day EMA. Looking ahead, the August high just below the 24,000 level is the key resistance level to watch, with a potential break above confirming the uptrend and opening the door for more gains from here. Meanwhile, previous-resistance-turned-support near 22,150 would be a logical support zone to watch if the uptrend breaks.
-- Written by Matt Weller, Global Head of Research
Check out Matt’s Daily Market Update videos on YouTube and be sure to follow Matt on Twitter: @MWellerFX
Latest market news




Open an account in minutes
Experience award-winning platforms with fast and secure execution, and enjoy tight spreads from 0.5 pts on FX and 0.3 pts on indices.
Economic calendar
Web Trader platform
Our sophisticated web-based platform is packed with features.
Related articles

Blue wave adds to Nikkei’s AI troubles
The Nikkei 225 has taken another beating as a Democratic sweep adds to concerns about AI investment returns. But after the scale of the earlier declines, how much bad news is already priced in?
S&P 500 Analysis: Earnings Uncertainty Continues to Weigh on the SPX
The trading week is coming to an end, and a phase of weakness remains evident across the S&P 500 in the short term. Recent price action reflects this dynamic, with SPX losing more than 2.00% over the last two trading sessions, bringing selling pressure back into focus.


Nasdaq 100, S&P 500 Smashed as AI Bubble Fears Run Risk Aversion
It’s been a rocky few weeks for stocks starting with a bearish engulf in NVDA a few weeks ago and then the same formation in the S&P 500 two weeks ago. Sellers have since chewed through supports and fear is starting to spread, but is this the beginning of the end for the AI rally?

This report is intended for general circulation only. It should not be construed as a recommendation, or an offer (or solicitation of an offer) to buy or sell any financial products. The information provided does not take into account your specific investment objectives, financial situation or particular needs. Before you act on any recommendation that may be contained in this report, independent advice ought to be sought from a financial adviser regarding the suitability of the investment product, taking into account your specific investment objectives, financial situation or particular needs.
StoneX Financial Pte. Ltd., may distribute reports produced by its respective foreign entities or affiliates within the StoneX group of companies or third parties pursuant to an arrangement under Regulation 32C of the Financial Advisers Regulations. Where the report is distributed to a person in Singapore who is not an accredited investor, expert investor or an institutional investor (as defined in the Securities Futures Act), StoneX Financial Pte. Ltd. accepts legal responsibility to such persons for the contents of the report only to the extent required by law. Singapore recipients should contact StoneX Financial Pte. Ltd. at 6826 9988 for matters arising from, or in connection with the report.
In the case of all other recipients of this report, to the extent permitted by applicable laws and regulations neither StoneX Financial Pte. Ltd. nor its associated companies will be responsible or liable for any loss or damage incurred arising out of, or in connection with, any use of the information contained in this report and all such liability is hereby expressly disclaimed. No representation or warranty is made, express or implied, that the content of this report is complete or accurate.
StoneX Financial Pte. Ltd. is not under any obligation to update this report.
Trading CFDs carries a high level of risk that may not be suitable for some investors. Consider your investment objectives, level of experience, financial resources, risk appetite and other relevant circumstances carefully. The possibility exists that you could lose some or all of your investments, including your initial deposits. If in doubt, please seek independent expert advice. Visit www.forex.com/en-sg/terms-and-policies for the complete Risk Disclosure Statement.