


Russell 2000 breaks 200-day average as CPI risk looms
US small caps have lost nearly 9% since August, with surging Treasury yields overwhelming a historically favourable midterm trading period. Now the Russell 2000 is threatening to break a major support zone ahead of US CPI.
Share this:

- Russell 2000 nears correction territory
- Treasury yield correlations among most negative readings since 2003
- Higher yields disrupt historically strong pre-midterm seasonality
- Break below 200-day average puts Liberation Day uptrend in focus
US small-cap equities have struggled since hitting record highs in August, partially reversing the strong rally seen earlier in the year.
With Treasury yields surging as high energy prices feed through to inflation, hitting consumers through higher gasoline and diesel prices, it's not difficult to see why from a fundamental perspective. The pressure has led to the Federal Reserve lifting interest rates for the first time in more than three years, with the prospect of at least another three hikes priced in by the end of next year.
For a cyclical index whose constituents are often reliant on the kindness of capital markets for funding, it comes as no surprise that the Russell 2000 is struggling, disrupting what has often been a strong seasonal period ahead of US midterm elections.
With the index now trading beneath its 200-day moving average, there is a growing risk that the unwind may have further to run, particularly if we see a hot US core inflation report later Wednesday.
Treasury yields increasingly influential
Source: LSEG
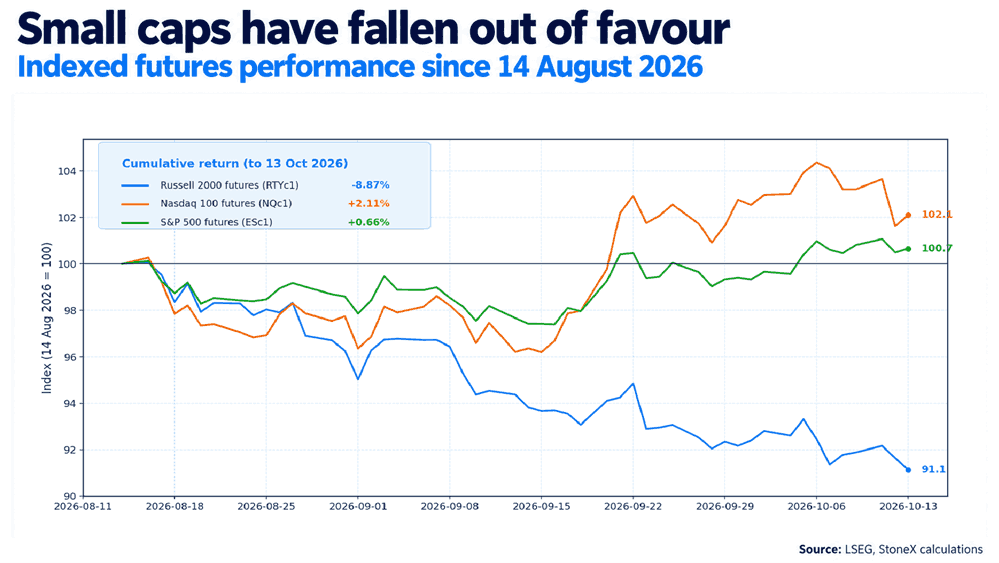
The underperformance of small caps is demonstrated in the graphic above, with Russell 2000 futures losing nearly 9% since mid-August, while Nasdaq 100 and S&P 500 futures have eked out small gains over the same period.
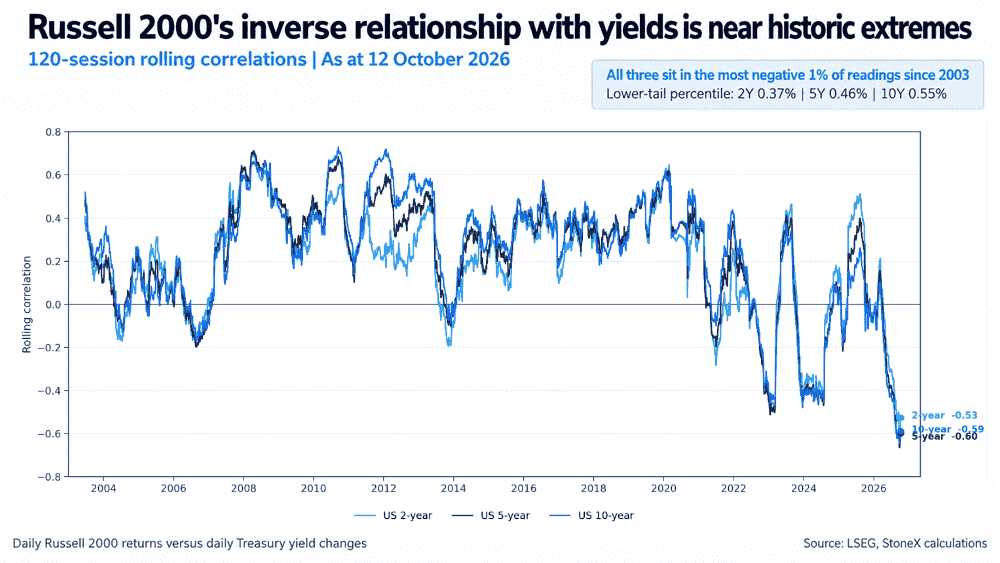
It's not the only explanation, but the continued rise in US Treasury yields has likely contributed to the underperformance. Analysis of daily market movements shows that the Russell 2000's relationship with US Treasury yields has become extremely negative by historical standards.
Over the past 120 sessions, or essentially half a year, the correlation between the index and daily changes in two-year Treasury yields stands at -0.53, with five-year and 10-year correlations at -0.60 and -0.59 respectively. While not extremely strong, all three sit among the most negative 1% of observations dating back to 2003.
Source: LSEG
Historically, rising yields have often been a sign of improving economic activity, but in this instance, it's not just firm nominal growth expectations due to the ongoing influence of AI on productivity and investment, but also the influence of high energy prices and increasing term premia associated with ongoing, unaddressed concerns about the US fiscal trajectory.
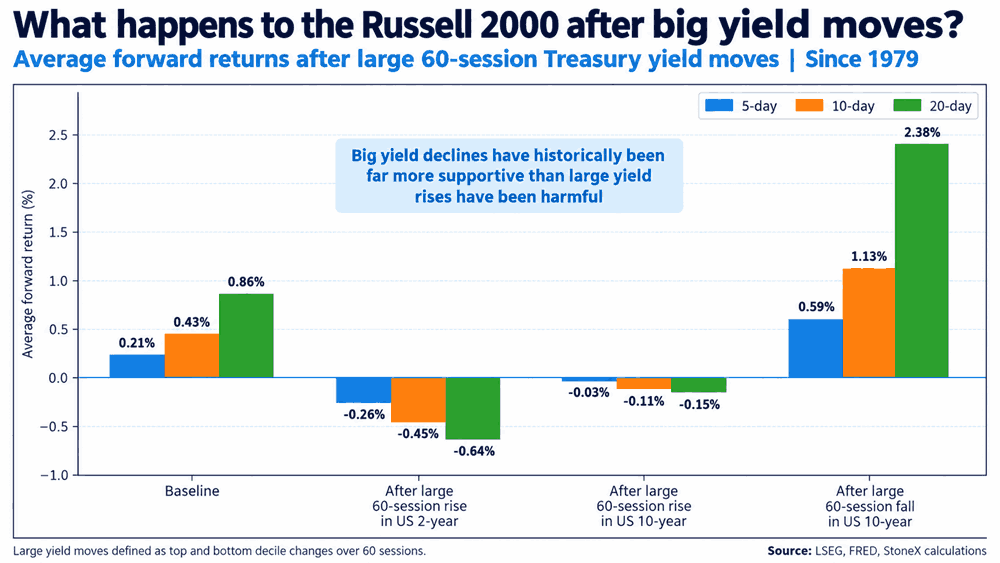
As the next graphic shows, large increases in Treasury yields have also coincided with small-cap underperformance in the past, particularly when the rise has been concentrated at the front end of the curve, as we saw in September.
Source: LSEG
By contrast, large declines in yields have tended to be followed by substantially stronger returns, making that a point of interest given the pullback in yields over recent weeks.
US midterms: Where's the usual pre-election rally?
The macro headwinds generated by substantially higher US borrowing costs have disrupted what has often been a strong historical seasonal pattern for small-cap equities before US midterm elections.
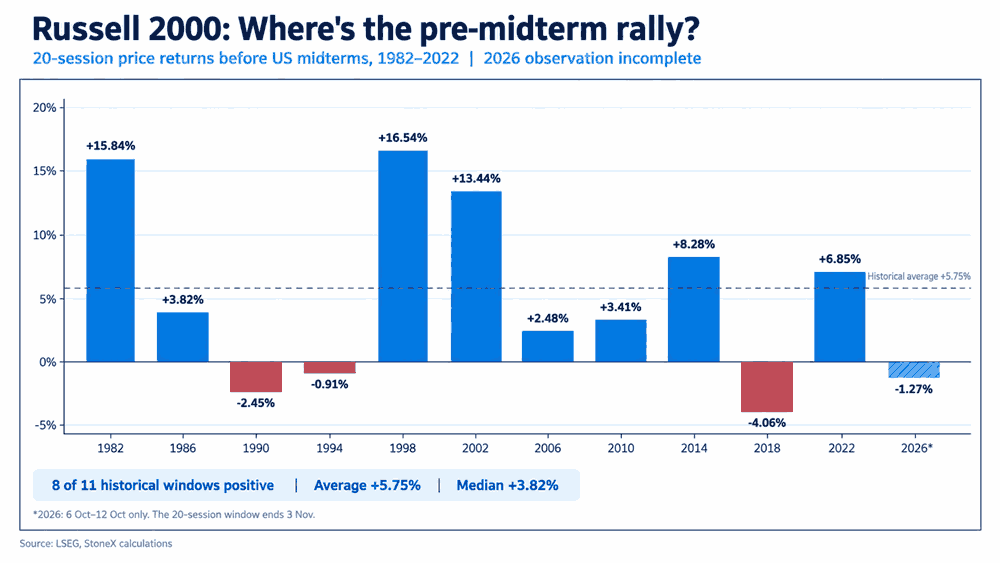
Looking back at US midterm elections since 1982, the Russell 2000 has risen by an average of 5.75% over the 20 trading sessions leading into polling day, with positive returns in eight of 11 periods. As the accompanying graphic shows, the pre-election rally has often been quite substantial.
Source: LSEG
That's a very different picture from what we're seeing in 2026, at least so far.
Adding to the uncertainty is the prospect of a change in congressional control, with recent polling raising the possibility of Democrats taking the House, potentially resulting in a divided Congress, or even gaining control of both chambers. While the historical sample is limited, previous changes in congressional control have produced mixed outcomes for small-cap equities.
The historical pattern has generally remained positive after polling day, with the Russell averaging gains of 6.20% over the subsequent 60 sessions, rising in eight of 11 instances. But there have been exceptions, including 1994 and 2018, when monetary policy tightening and concerns about the economic outlook weighed on equities.
As such, with the Fed in tightening mode and energy-driven inflation still filtering through the economy, there's no guarantee the historical bullish tendency will be seen this year.
200-day moving average gives way
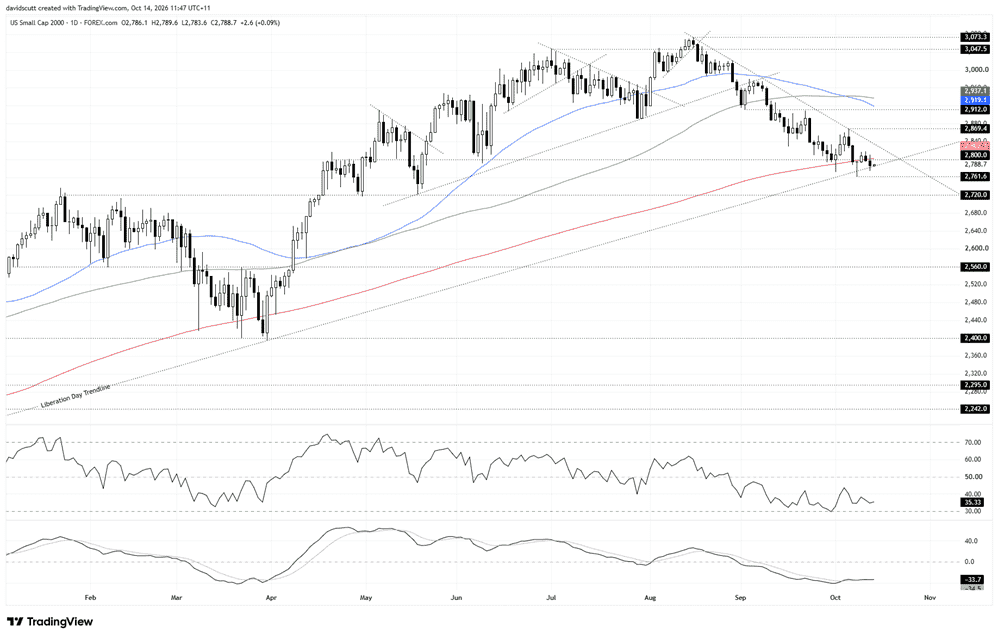
Source: TradingView
Technically, the Russell 2000 contract finds itself in a short-term downtrend from its August highs, with the trendline now acting as resistance. At the same time, you've got a support zone comprising a long-running uptrend extending from the April 2025 lows, the 200-day simple moving average and horizontal support at 2,800.
Right now, the index is clinging to the bottom end of that support zone, having closed beneath the 200-day moving average on Tuesday. That leaves it teetering on the uptrend running from the April 2025 lows.
Looking at RSI (14), while it remains below the neutral 50 level, we've recently seen a string of higher lows, suggesting downside pressure is gradually starting to ease. That's been confirmed by MACD, which has crossed above its signal line from below, albeit it remains in negative territory and is flatlining at this stage.
Even though the momentum picture provides a cautious message to the bears, it still favours them overall.
If we were to see a breakdown through the support zone, it would put 2,761.6 in focus, the intraday low hit on October 7. If that were to be surpassed, bears would start looking for a retest of 2,720, a support level that's also acted as resistance during periods this year. Beneath that, there's not really a lot to speak of until 2,560, another level that has flipped between support and resistance on multiple occasions.
However, if the bulls were to step in and defend the support zone, that would bring levels overhead into focus, starting with 2,840, where downtrend resistance is currently located. Above that, 2,869.4, the October 6 high, would be the next level to watch, followed by 2,912 and the 50-day and 100-day moving averages around 2,924–2,938.
Given the unusually strong inverse relationship between the Russell 2000 and Treasury yields, today's US CPI report could have a significant bearing on which of these technical scenarios plays out. Movements in crude oil will also be important, having contributed to the uplift in Treasury yields, especially at the long end of the curve. A hotter-than-expected core inflation reading, accompanied by persistently elevated energy prices, could place additional pressure on the Russell, whereas the opposite scenario could provide fundamental support.


Open an account in minutes
Experience award-winning platforms with fast and secure execution, and enjoy tight spreads from 0.5 pts on FX and 0.3 pts on indices.
Economic calendar
Web Trader platform
Our sophisticated web-based platform is packed with features.
Related articles
Russell 2000 breaks 200-day average as CPI risk looms
US small caps have lost nearly 9% since August, with surging Treasury yields overwhelming a historically favourable midterm trading period. Now the Russell 2000 is threatening to break a major support zone ahead of US CPI.

AUD/USD coils ahead of US CPI as breakout risk builds
The Aussie is coiling beneath 0.7000 ahead of US CPI, with its relationship with US front-end yields strengthening sharply just as markets question whether the Fed will need to hike again this month.

US CPI Preview: Follow the Fed and Look Past the Hot Headline
A 0.6% m/m reading in headline CPI, while scary at first glance, is already expected and presumably discounted into the current market prices. Instead, the “core” reading will be more impactful for the Fed and markets - see what it means for the US dollar!

This report is intended for general circulation only. It should not be construed as a recommendation, or an offer (or solicitation of an offer) to buy or sell any financial products. The information provided does not take into account your specific investment objectives, financial situation or particular needs. Before you act on any recommendation that may be contained in this report, independent advice ought to be sought from a financial adviser regarding the suitability of the investment product, taking into account your specific investment objectives, financial situation or particular needs.
StoneX Financial Pte. Ltd., may distribute reports produced by its respective foreign entities or affiliates within the StoneX group of companies or third parties pursuant to an arrangement under Regulation 32C of the Financial Advisers Regulations. Where the report is distributed to a person in Singapore who is not an accredited investor, expert investor or an institutional investor (as defined in the Securities Futures Act), StoneX Financial Pte. Ltd. accepts legal responsibility to such persons for the contents of the report only to the extent required by law. Singapore recipients should contact StoneX Financial Pte. Ltd. at 6826 9988 for matters arising from, or in connection with the report.
In the case of all other recipients of this report, to the extent permitted by applicable laws and regulations neither StoneX Financial Pte. Ltd. nor its associated companies will be responsible or liable for any loss or damage incurred arising out of, or in connection with, any use of the information contained in this report and all such liability is hereby expressly disclaimed. No representation or warranty is made, express or implied, that the content of this report is complete or accurate.
StoneX Financial Pte. Ltd. is not under any obligation to update this report.
Trading CFDs carries a high level of risk that may not be suitable for some investors. Consider your investment objectives, level of experience, financial resources, risk appetite and other relevant circumstances carefully. The possibility exists that you could lose some or all of your investments, including your initial deposits. If in doubt, please seek independent expert advice. Visit www.forex.com/en-sg/terms-and-policies for the complete Risk Disclosure Statement.