



S&P 500 outlook: Stocks approach new highs
In this mostly technically focused S&P 500 outlook article, we are highlighting the upside potential of the US benchmark index, where we think hitting a new all time high might be just a matter of time, with a potential for an extension to the next big level of 7,000 – barring a major setback in US-China trade talks.
Share this:

US markets pushed higher after the open, tracking a firmer risk tone observed elsewhere across financial markets with European stocks, cryptocurrencies and copper all pushing higher. In this mostly technically focused S&P 500 outlook article, we are highlighting the upside potential of the US benchmark index, where we think hitting a new all time high might be just a matter of time, with a potential for an extension to the next big level of 7,000 – barring a major setback in US-China trade talks.
Analysis: What factors are helping the S&P 500 outlook?
The major indices hovered just below record highs, shrugging off a mixed set of US and European earnings today in what has otherwise been a rather good earnings season for the S&P 500 companies thus far. The real headline, however, came from the oil market, as crude prices surged to a two-week high following fresh US sanctions on Russia’s largest producers. The jump in oil prices lifted energy names like BP and Shell, helping to nudge the FTSE 100 to a new record high. Will we see new records on Wall Street? For now, hopes for interest rate cuts continue to underpin the S&P 500 outlook, even as renewed uncertainty around US-China trade relations keeps a lid on broader enthusiasm. Washington’s latest suggestion that it might restrict software exports to China threatens to reignite tensions, but upbeat comments from Trump this week have helped temper those fears. Traders are now watching Friday’s delayed US inflation print closely for fresh clues on the Federal Reserve’s next move. So far, expectations of two more cuts this year has helped to provide support for stocks.

Crude oil steals the spotlight
Oil prices dominated overnight headlines, extending gains after President Trump announced sanctions against major Russian oil companies. The move propelled WTI crude more than $5 higher from last week’s multi-month low near $60 a barrel. Interestingly, this sharp jump has yet to dent overall risk appetite. US equity indices remain buoyant, and even cryptocurrencies have joined the rebound.
Whether these sanctions meaningfully disrupt Russian supply — and thus justify such a swift repricing — remains to be seen. For now, the reaction appears largely contained to the energy market, without spilling over into broader financial sentiment. Still, with energy costs feeding into inflation expectations, traders will be watching closely to see whether this adds a new wrinkle to the S&P 500 outlook in the coming days.
Technical picture: Key S&P 500 levels to watch
From a technical perspective, the S&P 500 outlook remains firmly bullish. After a 2.5% pullback in early October, the index briefly slipped below several short-term moving averages and key support zones, luring in short sellers. But last week’s swift rebound served as a reminder of one of the market’s timeless truths — the trend is still your friend.
Despite some choppy sessions this week, the S&P 500 continues to trade above reclaimed moving averages and previous support areas, keeping the broader uptrend intact. The index, along with other major global benchmarks, continues to form higher highs and higher lows — a classic sign of sustained bullish momentum.
A genuine trend reversal would require a decisive break below critical supports and a confirmed topping formation, neither of which has emerged yet. As it stands, dip-buying remains the strategy of choice among traders betting on further strength in the S&P 500 outlook.
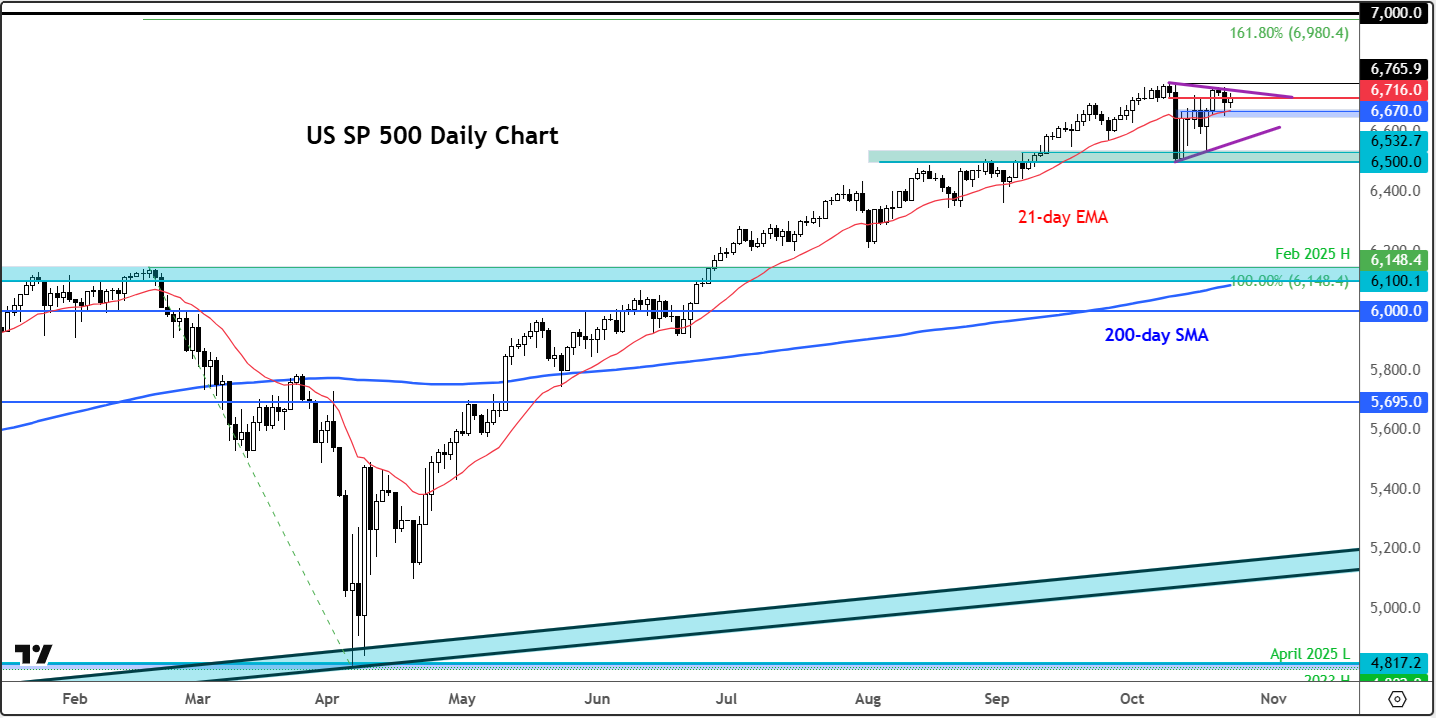
Immediate support sits around 6670-80 area on our US SP 500 chart, which is derived from the underlying S&P 500 futures — a zone reinforced by last week’s daily highs and the 21-day exponential moving average. Below that 6,600 is another key zone, while the month’s low at 6,500 marks a crucial line in the sand where many stop orders are likely clustered.
On the upside, resistance is seen around 6,716-6723 area, which had acted as both prior support and marks Tuesday’s low. A clear move above that zone would open the path towards the all-time high at 6766, followed by the next round handles of 6,800 and 6,900, and then the psychologically important 7,000 level beyond that.
-- Written by Fawad Razaqzada, Market Analyst
Follow Fawad on Twitter @Trader_F_R
Related tags:



Open an account in minutes
Experience award-winning platforms with fast and secure execution, and enjoy tight spreads from 0.5 pts on FX and 0.3 pts on indices.
Economic calendar
Web Trader platform
Our sophisticated web-based platform is packed with features.
Related articles
USD/CAD shooting star puts September surge on notice
USD/CAD has printed a clear bearish reversal pattern after an extraordinary September surge, but confirmation may depend heavily on how US Treasury yields react to Friday’s payrolls report.

USD/CHF Reverses as Swiss Franc Surges amid Bond Carnage
USD/CHF reverses from channel resistance as bond volatility surges and broad Swiss franc strength points to a possible carry-trade unwind.


US Dollar Technical Outlook: DXY Bulls Meet Resistance at Yearly Highs 10 1 2026
The U.S. Dollar has held firm despite fading Fed hike bets, but Friday’s payrolls could test the rally’s staying power.

This report is intended for general circulation only. It should not be construed as a recommendation, or an offer (or solicitation of an offer) to buy or sell any financial products. The information provided does not take into account your specific investment objectives, financial situation or particular needs. Before you act on any recommendation that may be contained in this report, independent advice ought to be sought from a financial adviser regarding the suitability of the investment product, taking into account your specific investment objectives, financial situation or particular needs.
StoneX Financial Pte. Ltd., may distribute reports produced by its respective foreign entities or affiliates within the StoneX group of companies or third parties pursuant to an arrangement under Regulation 32C of the Financial Advisers Regulations. Where the report is distributed to a person in Singapore who is not an accredited investor, expert investor or an institutional investor (as defined in the Securities Futures Act), StoneX Financial Pte. Ltd. accepts legal responsibility to such persons for the contents of the report only to the extent required by law. Singapore recipients should contact StoneX Financial Pte. Ltd. at 6826 9988 for matters arising from, or in connection with the report.
In the case of all other recipients of this report, to the extent permitted by applicable laws and regulations neither StoneX Financial Pte. Ltd. nor its associated companies will be responsible or liable for any loss or damage incurred arising out of, or in connection with, any use of the information contained in this report and all such liability is hereby expressly disclaimed. No representation or warranty is made, express or implied, that the content of this report is complete or accurate.
StoneX Financial Pte. Ltd. is not under any obligation to update this report.
Trading CFDs carries a high level of risk that may not be suitable for some investors. Consider your investment objectives, level of experience, financial resources, risk appetite and other relevant circumstances carefully. The possibility exists that you could lose some or all of your investments, including your initial deposits. If in doubt, please seek independent expert advice. Visit www.forex.com/en-sg/terms-and-policies for the complete Risk Disclosure Statement.