



S&P 500, Nasdaq Forecast for the Week Ahead
Have stocks bottomed? That’s the big question and the answer is likely related to a still fluid and uncontrollable factor in the Middle East. Longer-term charts remain of interest here.
Share this:


Stocks put in a stunning sell-off leading into the last week. And interestingly this bears resemblance to last year’s Q2, when ‘Liberation Day tariffs’ were driving risk aversion and equity indices in the US opened the second quarter in free fall. It didn’t take long for President Trump to shift his tone on tariff implementation and timing and in short order stocks found a low and started to rally in a historic manner, with fresh all-time-high showing just a couple of months later.
For this year’s iteration, the driver isn’t as controllable as it’s tension in the Middle East pushing higher oil prices, driving inflation expectations higher and rate cut expectations lower; but, similarly, President Trump has considerable sway on the matter and he’s used regular media engagements to push markets in one direction or the other.
As I write this, there’s hope on the horizon that we may be closer to the end of the scenario than the beginning. And if we look at equity prices, that hope has shown visibly as stock indices are working on their first green week since the whole conflict began. But, this should be taken with an asterisk as we could simply be seeing short cover ahead of a holiday weekend after President Trump showed a softened stance around the conflict.
And the reality is, as long as the Strait of Hormuz remains a problem area, global oil supplies and, in turn, energy prices, remain at risk. And that’s certainly something that can negatively impact stocks.
As looked at in the Tuesday webinar last year’s pullback brought along a unique item via RSI on the weekly chart, as the indicator went into oversold territory for only the third time since the Financial Collapse. Each has so far been followed by a strong response from buyers, and as we went into last week’s close it seemed as though a fourth instance could soon show. That hasn’t played out, at this point, but if we do see sellers back at it around next week’s open that’s definitely an item to keep watch of.
At this point, from the daily chart, we can see buyers trying to re-claim the 6500 level which remains a big battleground on the cash SPX chart. But, with a Fibonacci retracement applied to the most recent sell-off this remains a corrective item, as, so far, resistance has held at the 38.2% marker of the pullback, with the corresponding pullback from that finding support at the 23.6% marker.
SPX Daily Price Chart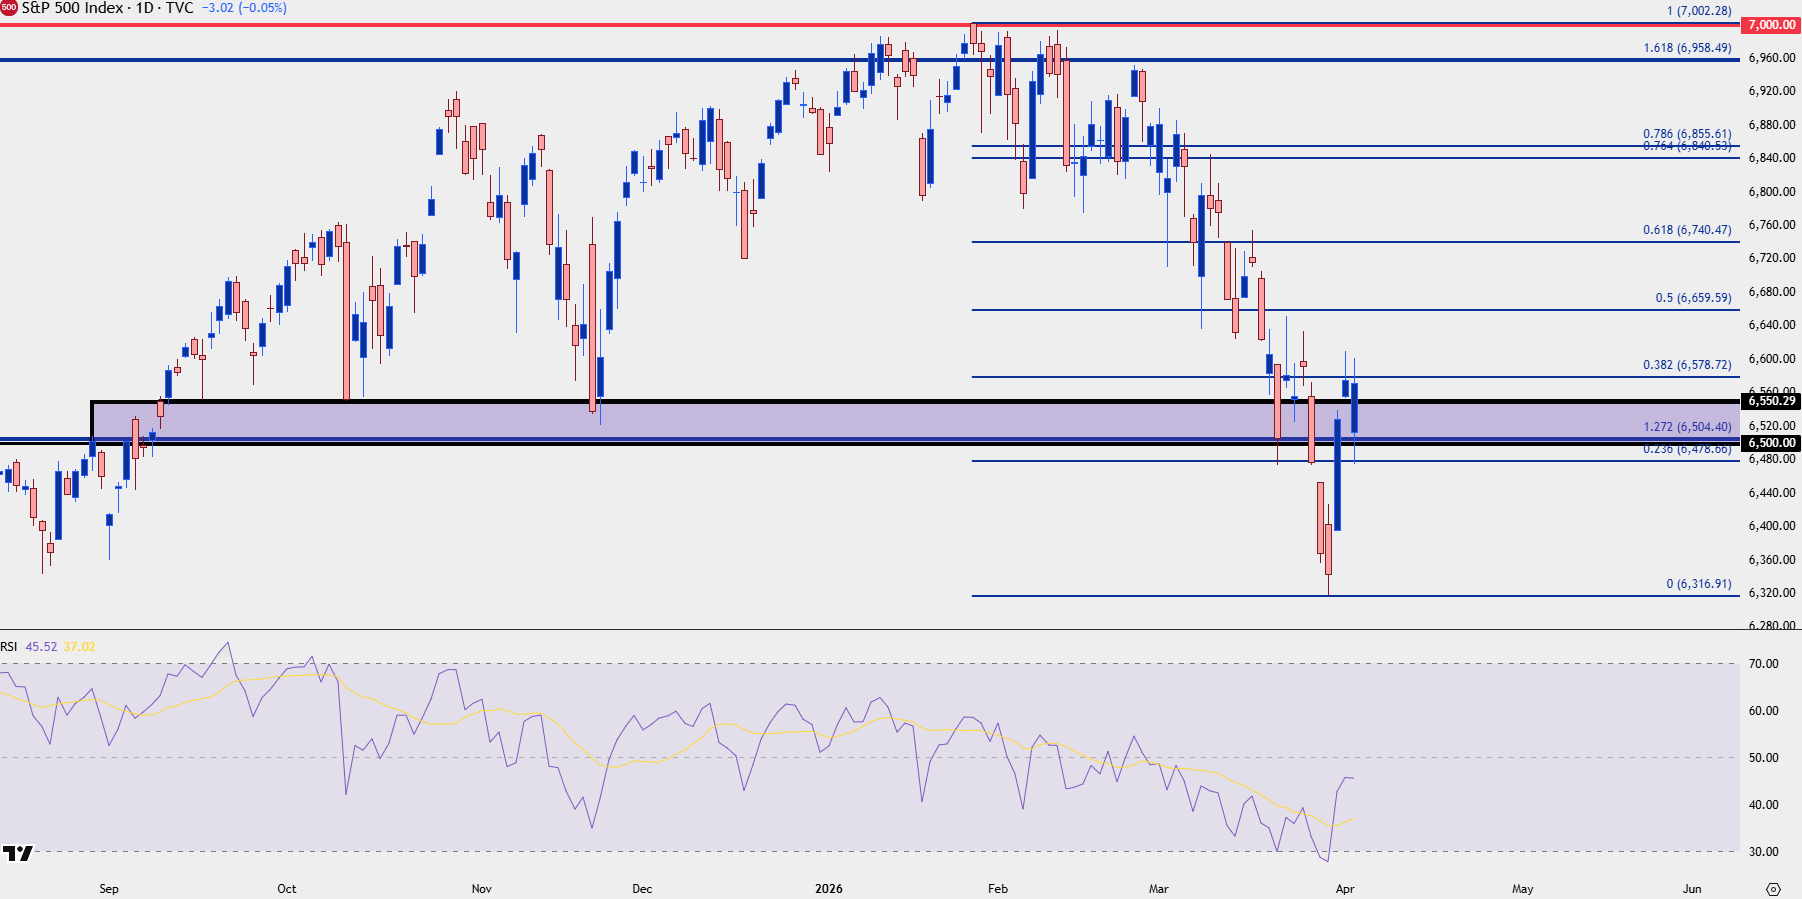
Chart prepared by James Stanley; data derived from Tradingview
SPX Weekly
From the longer-term chart it’s the zone from around 6145-6200 that stands out for deeper bearish scenarios. This is around last year’s swing-highs in February before the Liberation Day selling took over, and despite showing as resistance twice, it hasn’t yet shown much for support.
SPX Weekly Chart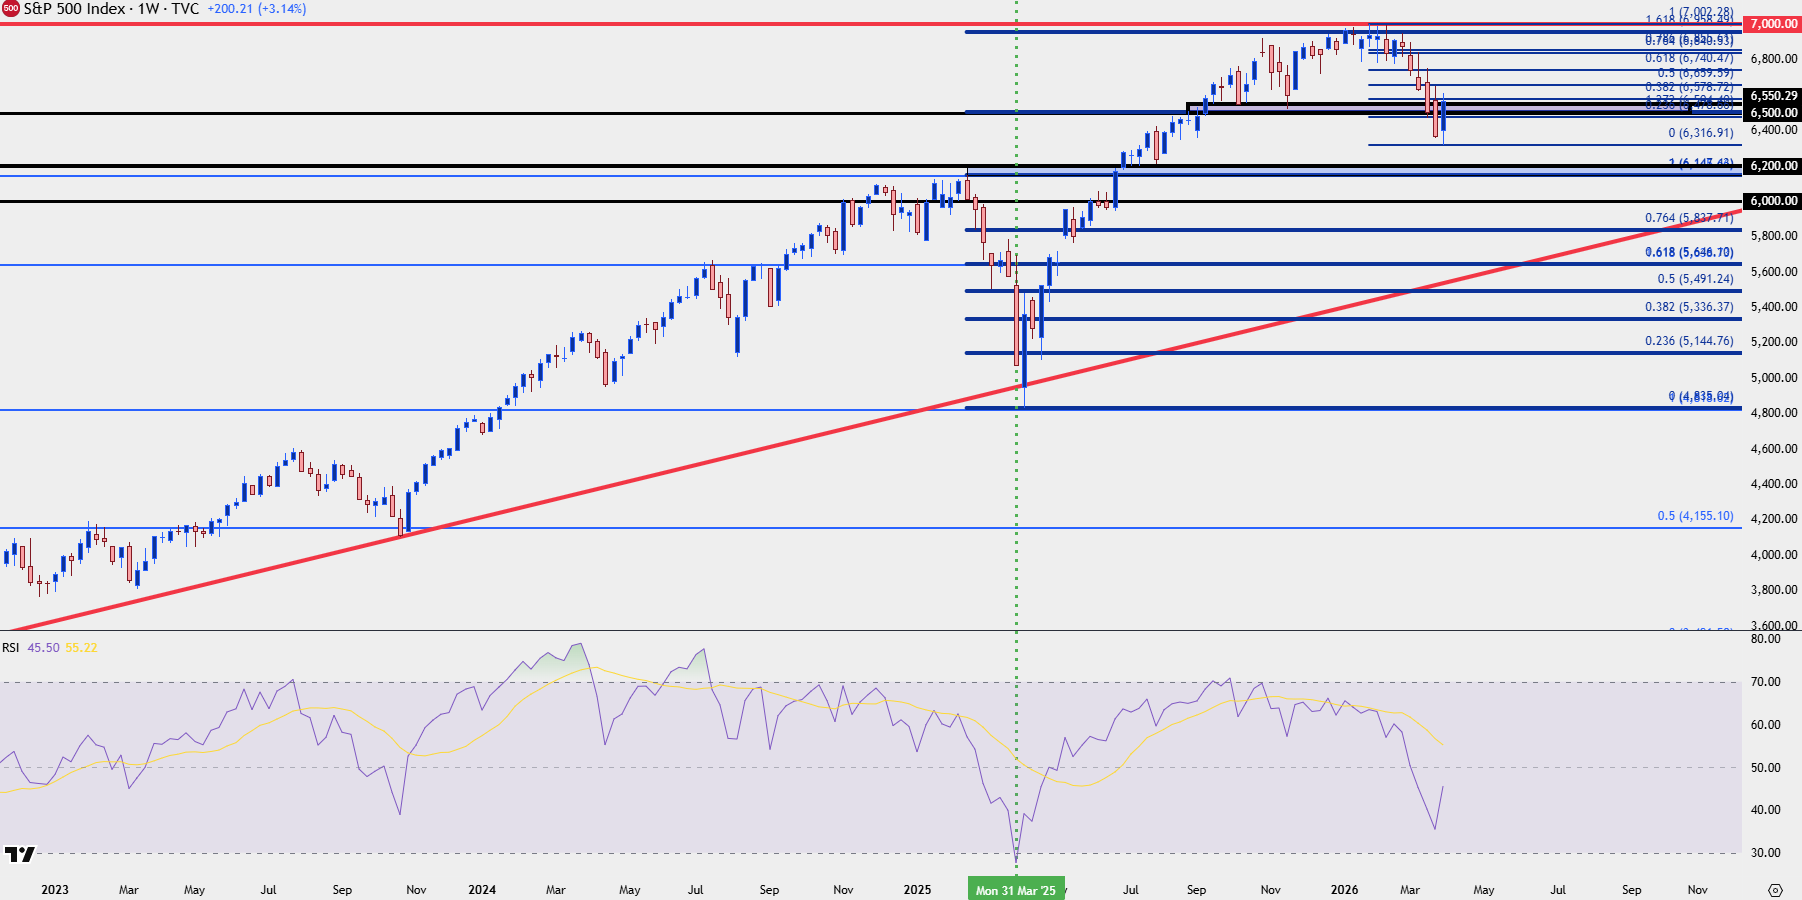
Chart prepared by James Stanley; data derived from Tradingview
Nasdaq
Similarly, the Nasdaq put in an oversold reading on the weekly chart last year during the Liberation Day sell-off, and that’s something that hasn’t quite happened again this year. The bounce in tech stocks is a bit more powerful, however, as buyers have held on to the 23k level to drive price back above resistance from prior support at the 24k level.
This seems a bit anticipatory, however, as buyers have pushed back into tech stocks like NVDA that were crowded during much of the three-year rally from the 2022 lows. If we do get another wave of selling, that keeps the Nasdaq as an attractive venue to look for a bounce given the prospect of these fast-moving names, like the FANG stocks, trading at less exuberant valuations.
Nasdaq 100 Futures Weekly Chart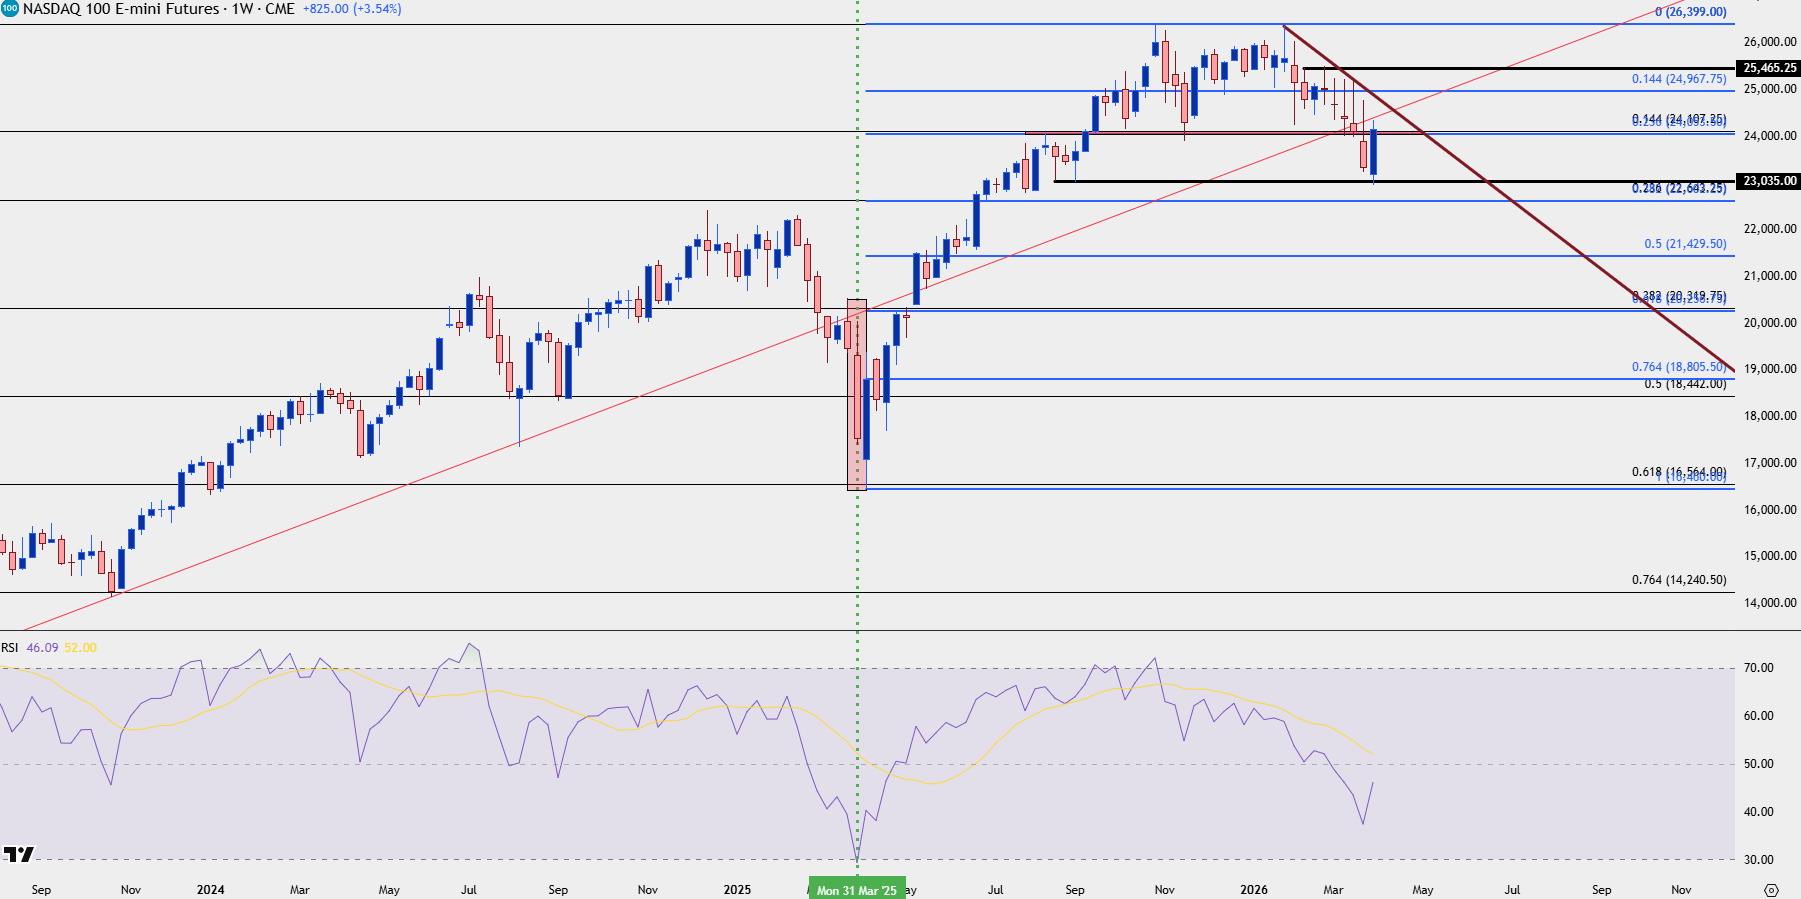
Chart prepared by James Stanley; data derived from Tradingview
--- written by James Stanley, Senior Market Analyst, Global Macro
Related tags:



Open an account in minutes
Experience award-winning platforms with fast and secure execution, and enjoy tight spreads from 0.5 pts on FX and 0.3 pts on indices.
Economic calendar
Web Trader platform
Our sophisticated web-based platform is packed with features.
Related articles

Nasdaq 100 Forecast: NDX slips as Treasury yields keep rising
U.S. stocks are falling at the start of Q4, as gains in software stocks offset concerns over soaring Treasury yields. U.S. Treasury yields continue to rise, with the 10-year yield up 2 basis points at 5.31% and the 30-year at 5.66%, multi-decade highs.


S&P 500 Forecast: SPX Continues to Drift Away from Record Highs
Recent trading sessions have done little to restore confidence in the equity market. Over the last four sessions, the S&P 500 has declined by nearly 1.00%, a move that highlights growing short-term weakness and keeps the index moving further away from its record-high territory.


Gold Price Outlook: XAU/USD Resistance at $4200 Sets Up for NFP
It was a strong sell-off to start the week in gold and despite a Tuesday bounce, sellers are continuing to push following a resistance hit at the $4200 level.
This report is intended for general circulation only. It should not be construed as a recommendation, or an offer (or solicitation of an offer) to buy or sell any financial products. The information provided does not take into account your specific investment objectives, financial situation or particular needs. Before you act on any recommendation that may be contained in this report, independent advice ought to be sought from a financial adviser regarding the suitability of the investment product, taking into account your specific investment objectives, financial situation or particular needs.
StoneX Financial Pte. Ltd., may distribute reports produced by its respective foreign entities or affiliates within the StoneX group of companies or third parties pursuant to an arrangement under Regulation 32C of the Financial Advisers Regulations. Where the report is distributed to a person in Singapore who is not an accredited investor, expert investor or an institutional investor (as defined in the Securities Futures Act), StoneX Financial Pte. Ltd. accepts legal responsibility to such persons for the contents of the report only to the extent required by law. Singapore recipients should contact StoneX Financial Pte. Ltd. at 6826 9988 for matters arising from, or in connection with the report.
In the case of all other recipients of this report, to the extent permitted by applicable laws and regulations neither StoneX Financial Pte. Ltd. nor its associated companies will be responsible or liable for any loss or damage incurred arising out of, or in connection with, any use of the information contained in this report and all such liability is hereby expressly disclaimed. No representation or warranty is made, express or implied, that the content of this report is complete or accurate.
StoneX Financial Pte. Ltd. is not under any obligation to update this report.
Trading CFDs carries a high level of risk that may not be suitable for some investors. Consider your investment objectives, level of experience, financial resources, risk appetite and other relevant circumstances carefully. The possibility exists that you could lose some or all of your investments, including your initial deposits. If in doubt, please seek independent expert advice. Visit www.forex.com/en-sg/terms-and-policies for the complete Risk Disclosure Statement.