



Softer US data sends US Dollar lower
If the data continues to come out weak for the US, it could mean a move dovish Fed than expected.
Share this:

When trying to determine what the Fed will do at its next meeting, there are many variables that come into play. Retail Sales inflation data and manufacturing data are a few of the most important factors. December Retail Sales showed that shoppers spent less in December as the MoM print was -1.1% vs an expectation of -0.8% and a November reading of -1.0% (revised from -0.6%). In addition, Retails Sales (ex-Autos) was also -1.1% MoM vs an expectation of -0.4% MoM and a November reading of -0.6% MoM (revised from -0.2% MoM).
US PPI was also weaker than expected. Headline PPI fell to 6.2% YoY vs an expectation of 6.8% YoY and a prior reading of 7.3% YoY (revised from 7.4% YoY). This is the lowest PPI reading since March 2021.
Adding fuel to the fire are Industrial Production and Manufacturing Production for December. Both prints were weaker than expected, suggesting that the soft-landing scenario the Fed has painted may not be so cut and dry. Industrial Production was -0.7% MoM vs an expectation of -0.1% MoM and a November reading of -0.6% MoM (revised of -0.2%). This was the biggest decline since September 2021. Manufacturing Production was also weaker at -1.3% MoM vs an expectation of -0.3% MoM and a November reading of -1.1% MoM (revised from -0.6%). This was the largest decrease in the data series since February 2021.
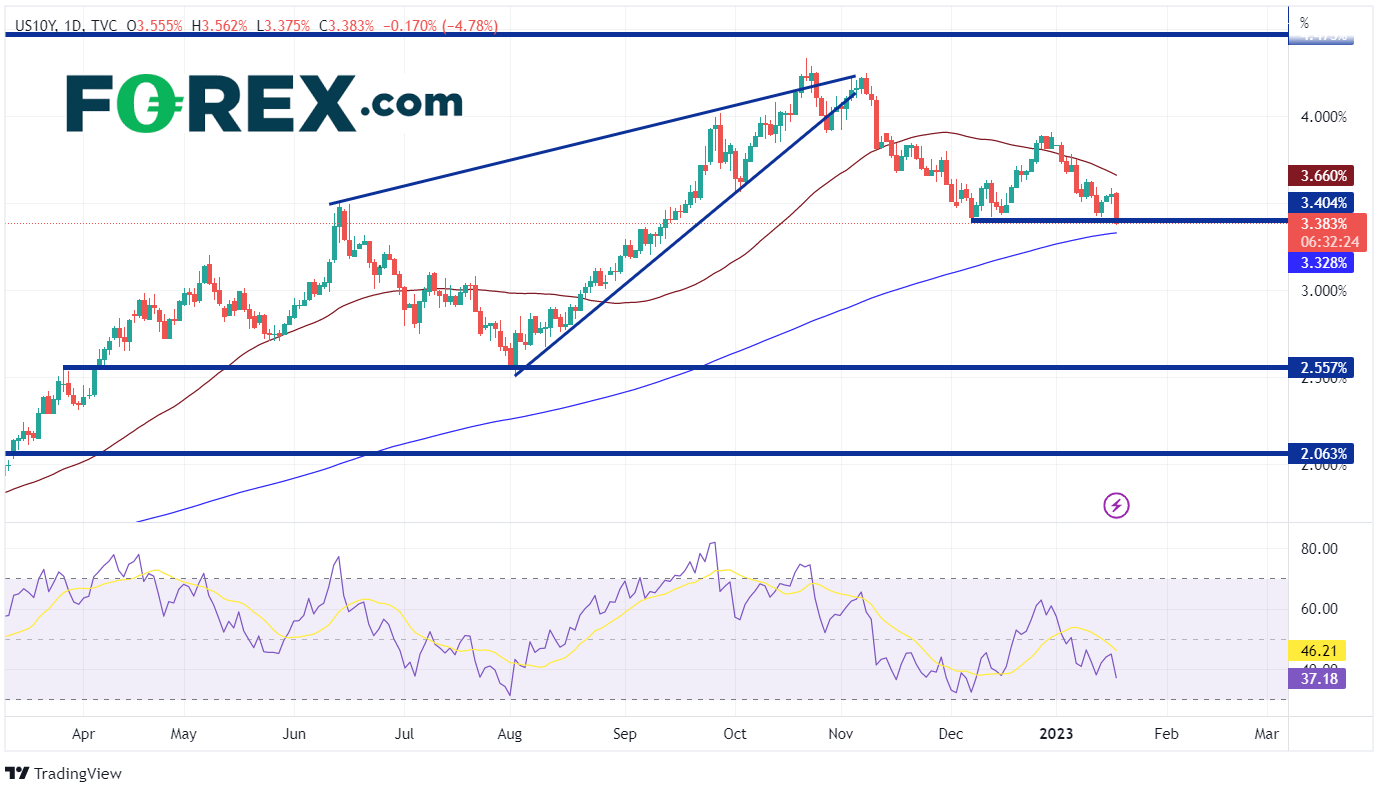
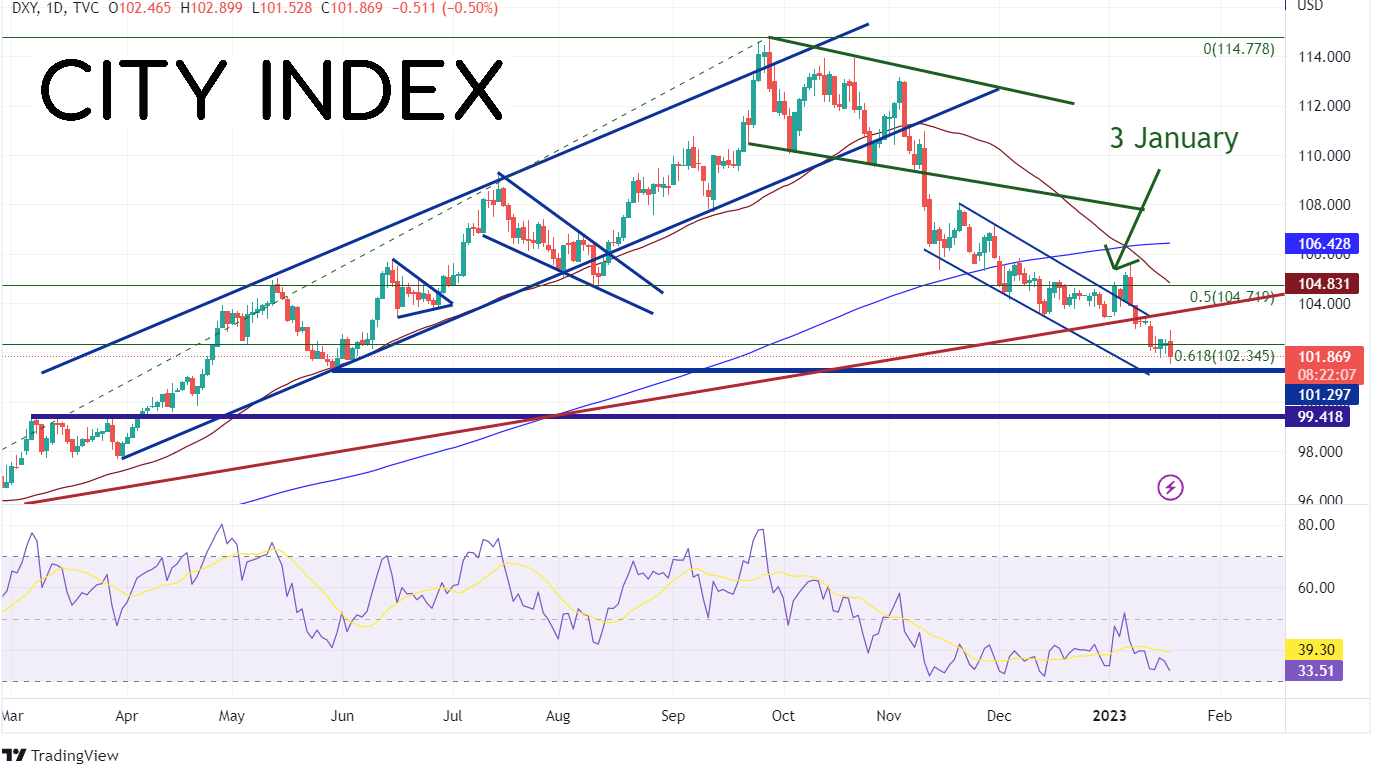
Weaker retail sales, inflation, and manufacturing data point to a more dovish Fed when it meets on February 1st. This is pushing interest rates and the US Dollar lower. US 10-year yields fell to their lowest level since mid-September 2022 at 3.375% while the DXY is closing on May 30th, 2022 support at 101.30.
US 10 Year Daily
Source: Tradingview, Stone X
DXY Daily

Source: Tradingview, Stone X
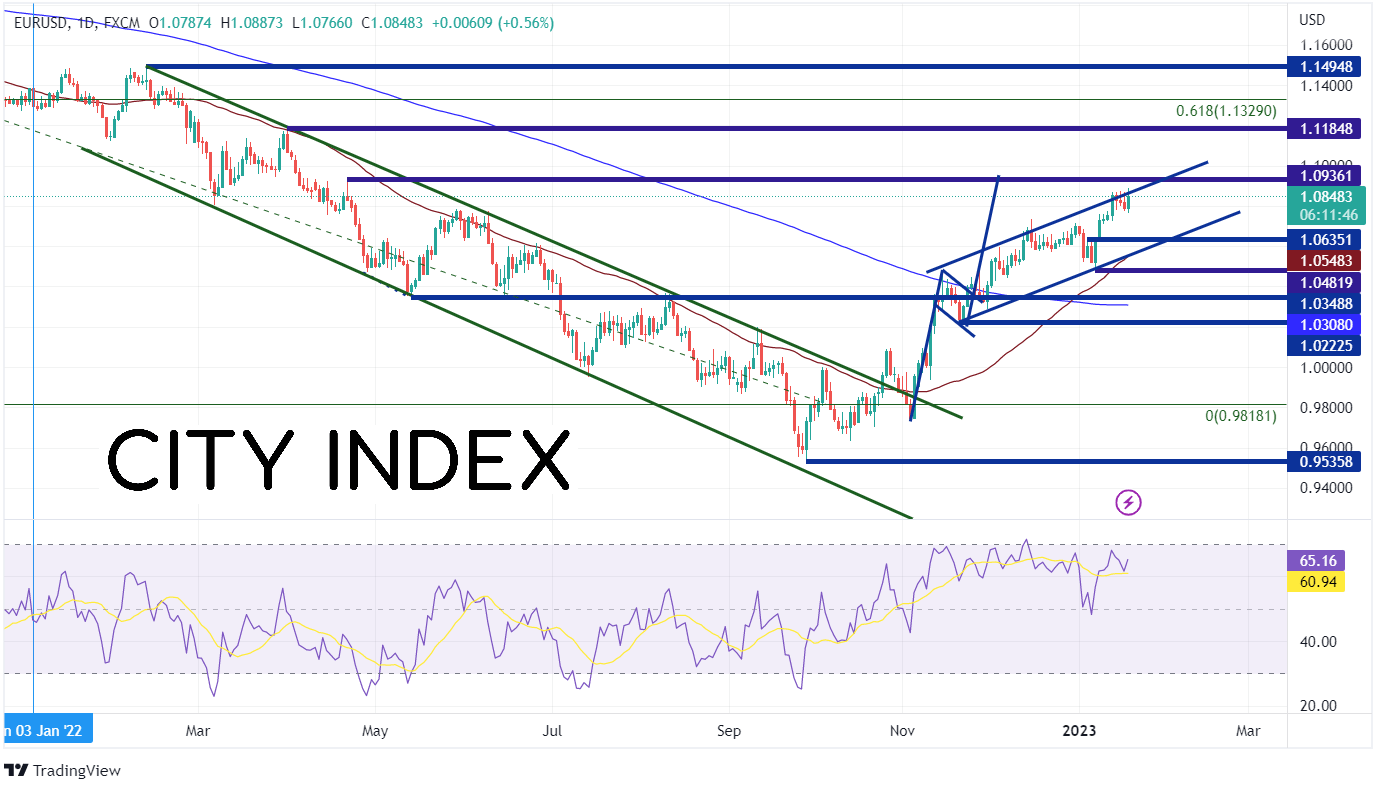
With the BOJ and UK inflation earlier today, it's best to take a look at EUR/USD, as the Eurozone didn’t have much skin in the game today. On a daily timeframe, EUR/USD reached its highest level since April 21st, 2022 as US Dollar weakness helped push the pair higher. Price is currently testing the top trendline of the channel, which began in November 2022, near 1.0865. If the US Dollar continues to weaken, the pair should remain bid. First resistance is at the highs of April 21st at 1.0936. Above there, EUR/USD can move to the highs of March 31st, 2022 at 1.1185, then the 61.8% Fibonacci retracement level from the highs of May 2021 to the lows of September 2022, at 1.1329. However, if EUR/USD pulls back, the first support is at the highs from January 4th at 1.0635. Below there, price can test a confluence of support at the 50 Day Moving Average and the bottom trendline of the channel near 1.0548. Next support is the lows of January 6th at 1.0482.

Source: Tradingview, Stone X
If the data continues to come out weak for the US, it could mean a move dovish Fed than expected on the back of weaker inflation and the possibility of a hard landing. On Thursday and Friday, the US releases housing data and the Philadelphia Fed Manufacturing Index. Manage risk accordingly.
When trying to determine what the Fed will do at its next meeting, there are many variables that come into play. Retail Sales inflation data and manufacturing data are a few of the most important factors. December Retail Sales showed that shoppers spent less in December as the MoM print was -1.1% vs an expectation of -0.8% and a November reading of -1.0% (revised from -0.6%). In addition, Retails Sales (ex-Autos) was also -1.1% MoM vs an expectation of -0.4% MoM and a November reading of -0.6% MoM (revised from -0.2% MoM).
US PPI was also weaker than expected. Headline PPI fell to 6.2% YoY vs an expectation of 6.8% YoY and a prior reading of 7.3% YoY (revised from 7.4% YoY). This is the lowest PPI reading since March 2021.
Adding fuel to the fire are Industrial Production and Manufacturing Production for December. Both prints were weaker than expected, suggesting that the soft-landing scenario the Fed has painted may not be so cut and dry. Industrial Production was -0.7% MoM vs an expectation of -0.1% MoM and a November reading of -0.6% MoM (revised of -0.2%). This was the biggest decline since September 2021. Manufacturing Production was also weaker at -1.3% MoM vs an expectation of -0.3% MoM and a November reading of -1.1% MoM (revised from -0.6%). This was the largest decrease in the data series since February 2021.
Weaker retail sales, inflation, and manufacturing data point to a more dovish Fed when it meets on February 1st. This is pushing interest rates and the US Dollar lower. US 10-year yields fell to their lowest level since mid-September 2022 at 3.375% while the DXY is closing on May 30th, 2022 support at 101.30.
US 10 Year Daily

Source: Tradingview, Stone X
DXY Daily
Source: Tradingview, Stone X
Trade the DXY now: Login or Open a new account!
• Open an account in the UK
• Open an account in Australia
• Open an account in Singapore
With the BOJ and UK inflation earlier today, it's best to take a look at EUR/USD, as the Eurozone didn’t have much skin in the game today. On a daily timeframe, EUR/USD reached its highest level since April 21st, 2022 as US Dollar weakness helped push the pair higher. Price is currently testing the top trendline of the channel, which began in November 2022, near 1.0865. If the US Dollar continues to weaken, the pair should remain bid. First resistance is at the highs of April 21st at 1.0936. Above there, EUR/USD can move to the highs of March 31st, 2022 at 1.1185, then the 61.8% Fibonacci retracement level from the highs of May 2021 to the lows of September 2022, at 1.1329. However, if EUR/USD pulls back, the first support is at the highs from January 4th at 1.0635. Below there, price can test a confluence of support at the 50 Day Moving Average and the bottom trendline of the channel near 1.0548. Next support is the lows of January 6th at 1.0482.
Source: Tradingview, Stone X
Trade EUR/USD now: Login or Open a new account!
• Open an account in the UK
• Open an account in Australia
• Open an account in Singapore
If the data continues to come out weak for the US, it could mean a move dovish Fed than expected on the back of weaker inflation and the possibility of a hard landing. On Thursday and Friday, the US releases housing data and the Philadelphia Fed Manufacturing Index. Manage risk accordingly.
Learn more about forex trading opportunities.
Related tags:


Open an account in minutes
Experience award-winning platforms with fast and secure execution, and enjoy tight spreads from 0.5 pts on FX and 0.3 pts on indices.
Economic calendar
Web Trader platform
Our sophisticated web-based platform is packed with features.
Related articles
Nasdaq 100 forecast: Stocks rebound ahead of more earnings
European indices recovered from a weaker start to turn positive by mid-morning trade, although US futures were still nursing small losses. Global indices were looking to add to their gains from the day before. Investors are weighing up encouraging earnings from SpaceX and Super Micro against elevated oil prices, which are limiting the upside for risk assets. We have more tech earnings coming up today which could shape the near-term Nasdaq 100 forecast.

Crude Oil Rally Faces Resistance as WTI and Brent Lose Momentum
WTI and Brent crude oil have rallied sharply, but high-volume dojis, RSI divergence and cautious positioning warn of pullback risk.


New Zealand inflation report puts spotlight on hawkish RBNZ pricing
New Zealand's recovery is barely underway, yet markets have priced a series of RBNZ rate hikes. Thursday's inflation report will put that hawkish recalibration under the microscope.

This report is intended for general circulation only. It should not be construed as a recommendation, or an offer (or solicitation of an offer) to buy or sell any financial products. The information provided does not take into account your specific investment objectives, financial situation or particular needs. Before you act on any recommendation that may be contained in this report, independent advice ought to be sought from a financial adviser regarding the suitability of the investment product, taking into account your specific investment objectives, financial situation or particular needs.
StoneX Financial Pte. Ltd., may distribute reports produced by its respective foreign entities or affiliates within the StoneX group of companies or third parties pursuant to an arrangement under Regulation 32C of the Financial Advisers Regulations. Where the report is distributed to a person in Singapore who is not an accredited investor, expert investor or an institutional investor (as defined in the Securities Futures Act), StoneX Financial Pte. Ltd. accepts legal responsibility to such persons for the contents of the report only to the extent required by law. Singapore recipients should contact StoneX Financial Pte. Ltd. at 6826 9988 for matters arising from, or in connection with the report.
In the case of all other recipients of this report, to the extent permitted by applicable laws and regulations neither StoneX Financial Pte. Ltd. nor its associated companies will be responsible or liable for any loss or damage incurred arising out of, or in connection with, any use of the information contained in this report and all such liability is hereby expressly disclaimed. No representation or warranty is made, express or implied, that the content of this report is complete or accurate.
StoneX Financial Pte. Ltd. is not under any obligation to update this report.
Trading CFDs carries a high level of risk that may not be suitable for some investors. Consider your investment objectives, level of experience, financial resources, risk appetite and other relevant circumstances carefully. The possibility exists that you could lose some or all of your investments, including your initial deposits. If in doubt, please seek independent expert advice. Visit www.forex.com/en-sg/terms-and-policies for the complete Risk Disclosure Statement.