



New Zealand inflation report puts spotlight on hawkish RBNZ pricing
New Zealand's recovery is barely underway, yet markets have priced a series of RBNZ rate hikes. Thursday's inflation report will put that hawkish recalibration under the microscope.
Share this:

- New Zealand quarterly inflation expected at 0.8%
- Imported energy costs raise broader inflation spillover risks
- RBNZ cash rate pricing tops 4% by end-2027
- NZD/USD and AUD/NZD face different underlying market drivers
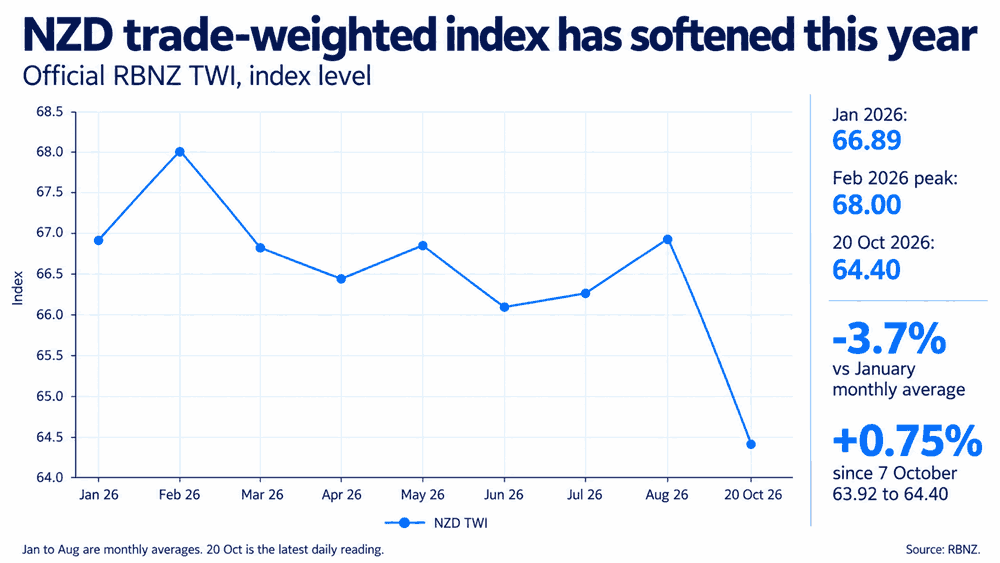
New Zealand's economic recovery is only in its infancy, yet markets are now pricing an aggressive tightening cycle from the Reserve Bank of New Zealand (RBNZ) over the next year, reflecting the combination of persistent weakness in the New Zealand dollar and the country's standing as a major energy importer, helping to fuel inflationary pressures across the economy.
Thursday's September quarter consumer price inflation report will provide a snapshot of just how intense those inflationary pressures have become, creating a key domestic risk event that could influence both the outlook for the RBNZ cash rate and the Kiwi dollar.
While the RBNZ cash rate outlook will be an important consideration for the Kiwi's performance against the crosses, broader macro factors are likely to overwhelm that signal against the US dollar. Right now, sentiment towards the US AI build-out has become the dominant force behind broader FX movements, with traders seemingly using it to assess the outlook for the US economy, Fed interest rates and longer-term Treasury yields.
Energy shock raises inflation risks
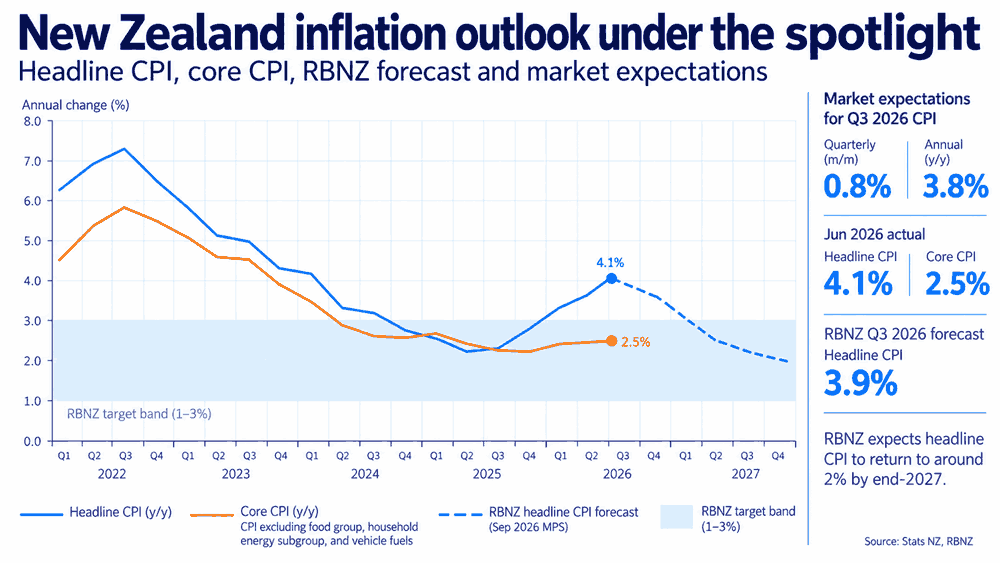
Thursday's September quarter inflation report is expected to show consumer prices rising 0.8% over the quarter, leaving the annual rate at 3.8%, down from 4.1% in June. Back in September, the RBNZ forecast the same quarterly increase but a slightly higher annual rate of 3.9%.
Source: RBNZ, StatsNZ
While the difference between market expectations and the RBNZ forecast is negligible, the underlying detail may provide clues as to whether the combination of a softer New Zealand dollar and higher energy prices is beginning to fuel inflationary pressures across the broader New Zealand economy.
Source: RBNZ
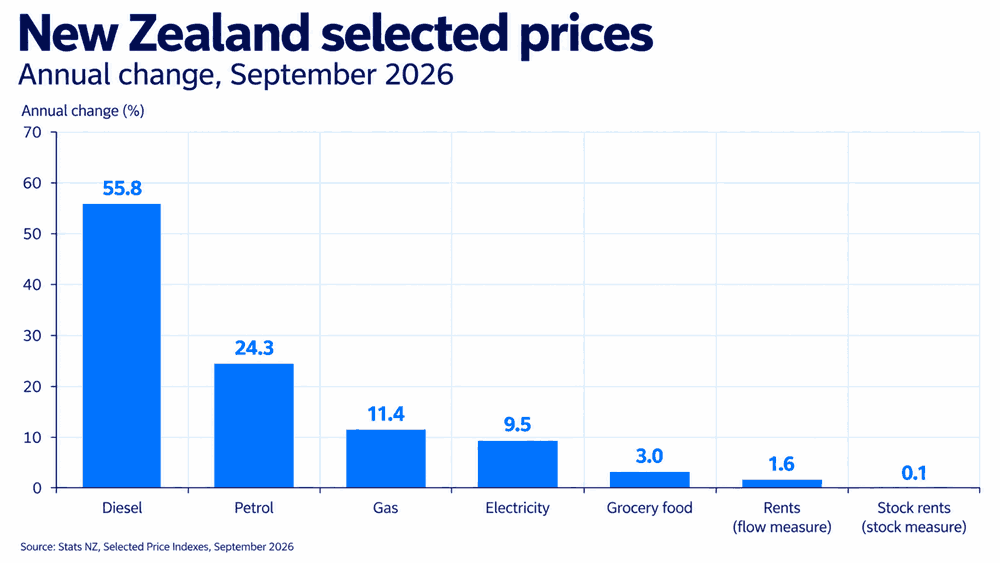
The September Selected Price Indexes report, released earlier this month, showed diesel prices rising 55.8% over the year, with petrol up 24.3%, and gas and electricity increasing 11.4% and 9.5%, respectively. For now, grocery food prices remain relatively anchored, increasing just 3%, while the stock measure of rents rose just 0.1%.
Source: StatsNZ
While there's significant dispersion between individual categories for now, markets appear to be anticipating that the longer the wars in Iran and Ukraine persist, keeping energy prices elevated, the greater the probability of spillover effects becoming evident not only in realised inflation across other categories, but also in inflation expectations.
As things currently stand, the RBNZ's projections anticipate headline inflation returning to its 1–3% target band by the middle of next year. The longer New Zealand continues to import significant inflationary pressures, the greater the risk that forecast will have to be pushed out further.
RBNZ rate hike bets accelerate
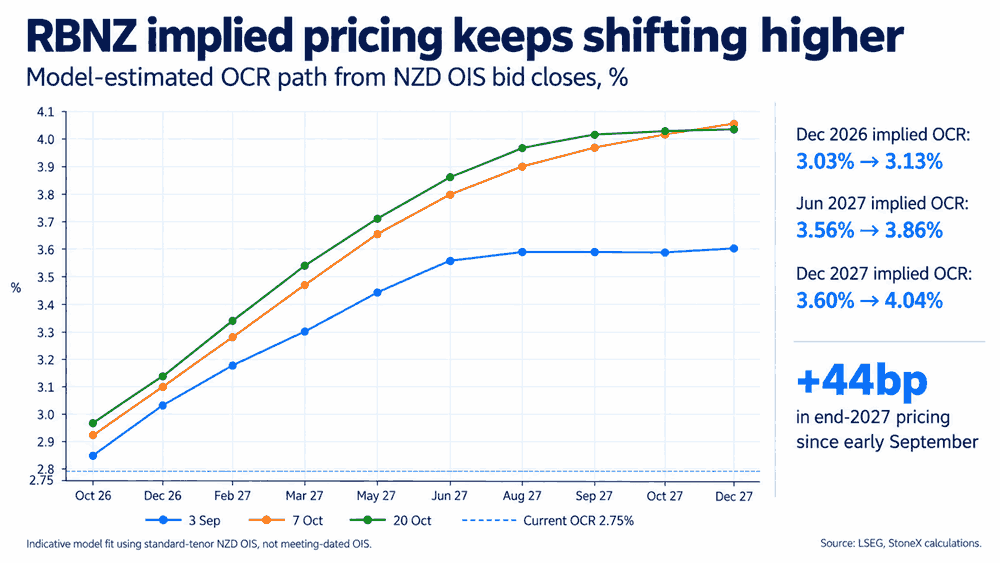
You can see the market recalibration in interest rate expectations in the graphic below, revealing a steady increase in hawkish pricing relative to when the RBNZ met in September.
Source: LSEG
With the cash rate currently sitting at 2.75%, OIS markets are now pricing roughly 40 basis points of tightening by the bank's December meeting, implying at least one full rate hike, with a greater than even probability of a second being delivered. By the middle of 2027, the cash rate is now seen sitting at around 3.9%, moving above 4% by the end of next year.
Clearly, that's a significant hawkish recalibration relative to what was seen back when the RBNZ last met, and significantly above where it saw the cash rate sitting over that same timeframe, at 3.1% and 3.2%, respectively.
Clearly, traders are anticipating that the persistent influx of imported inflationary pressures will force the RBNZ to become far more hawkish in its rate outlook, putting emphasis on Thursday's report. That means any substantial deviation in either direction could have meaningful impacts on the cash rate outlook and the Kiwi.
AI sentiment drives the dollar
While Thursday's inflation report has the potential to generate a knee-jerk reaction in NZD/USD, broader macro factors are likely to reassert control after that has played out.
Right now, sentiment towards the US AI build-out appears to be the key force influencing broader market movements, with traders seemingly using shifts in sentiment to assess the outlook for US economic growth, Fed interest rates and longer-term Treasury yields.
We've seen that play out during October, with the Nasdaq coming off the boil alongside US Treasury yields and the US dollar, all three retreating over the same period. The simultaneous moves suggest traders are reassessing what has been persistent US economic outperformance.
For NZD/USD, it means whatever reaction we see to Thursday's inflation report may be short-lived in duration.
NZD/USD technical outlook
Source: TradingView
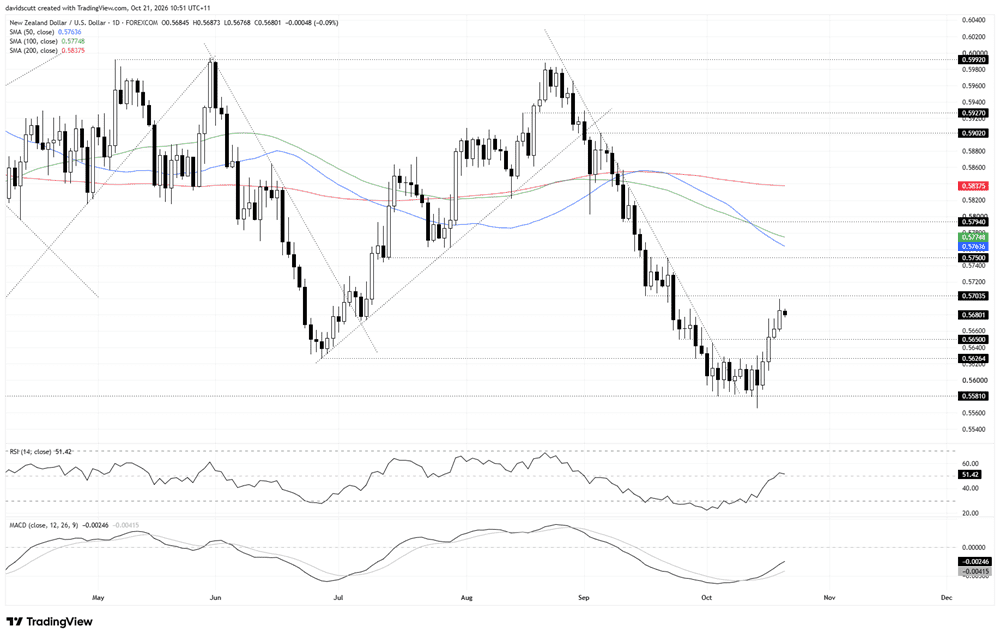
From a technical perspective, there's been a clear recovery in market momentum after what had been a prolonged bearish trend since the middle of August, with strong support at 0.5581 continually absorbing offers before the bears eventually capitulated, delivering a breakout of the downtrend and a subsequent pop higher over recent days.
The recovery has seen NZD/USD take out resistance at 0.56264, the swing low set back in June, along with 0.5650, a minor level that acted as support for a period in September. For now, the move has stalled beneath the next resistance level at 0.5704, with 0.5750 the next level of note should the price push higher.
The message from the oscillators is one of neutrality, with RSI (14) sitting around 50, while MACD has staged a bullish crossover and is now pushing back towards positive territory.
Despite the latest rebound, with the price remaining beneath its key medium and long term moving averages, it comes across more as something of a corrective bounce rather than the start of a prolonged bullish trend.
To get truly excited about the Kiwi's prospects against the dollar, we'd need a far brighter outlook for the global economy, meaning lower energy prices and lower interest rates that aren't accompanied by a global recession.
Australia's yield advantage narrows
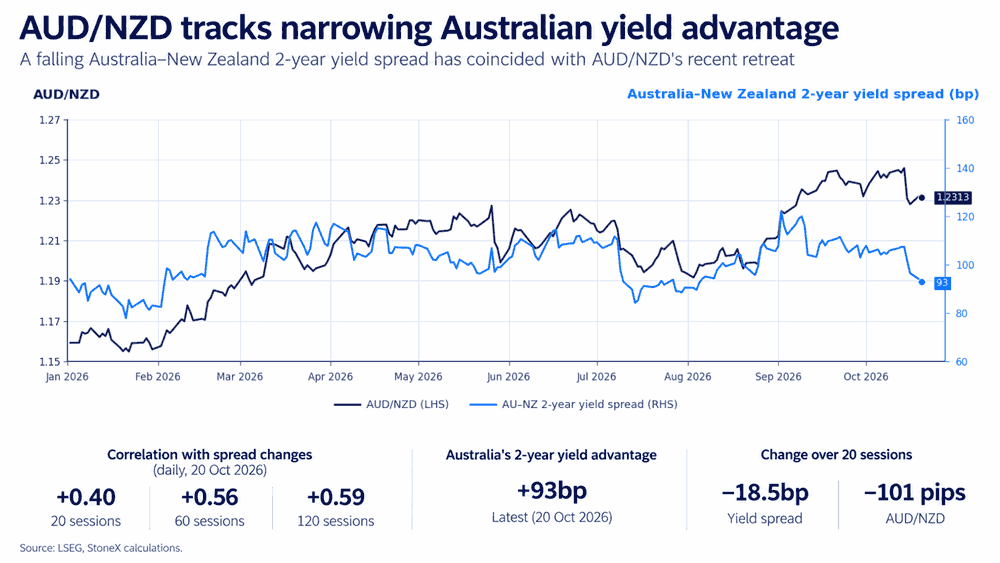
While broader US dollar movements are likely to remain the dominant influence on the Kiwi dollar, the outlook for relative interest rates is more important for the crosses, especially AUD/NZD.
Source: LSEG
Analysis of daily market movements reveals a relatively strong relationship between the pair and two-year government yield spreads between the two nations, with correlations of +0.56 and +0.59 over the past 60 and 120 sessions, respectively.
Recently, we've seen Australia's two-year yield advantage narrow by 18.5 basis points over the past 20 sessions, coinciding with a 101-pip decline in AUD/NZD.
The shift reflects primarily a curtailment in RBA rate hike pricing, along with a continued modest hawkish recalibration in the RBNZ cash rate outlook.
AUD/NZD technical outlook
Source: TradingView
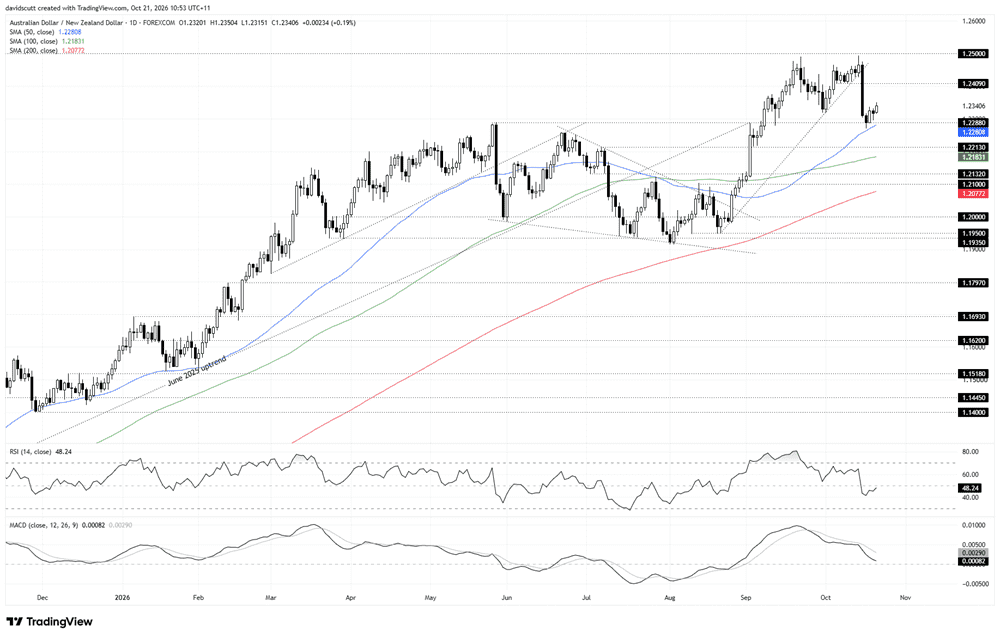
The narrowing in relative interest rate spreads has seen AUD/NZD pull back from just beneath 1.25 to 1.2288, the high set back in late May this year, which has subsequently acted as both support and resistance in the period since.
The pair attempted to break beneath that support zone but was unable to do so, seeing the price start to push higher again over recent days. With the 50-day moving average located just beneath 1.2288, it looms as the key downside support zone to watch, with 1.2213, the 100-day moving average, 1.2132 and 1.2100 the next downside levels of note before the important 200-day moving average comes into view.
Overhead, 1.2409 acted as support for a period in September, making it the first level of note, with 1.2490 where the pair stalled on two separate occasions recently. The 1.25 level also saw considerable price action either side of it back in late 2012 and early 2013, illustrating just how far AUD/NZD has rallied.
My assessment is that, if it hasn't already, AUD/NZD is getting very close to topping out.
Latest market news



Open an account in minutes
Experience award-winning platforms with fast and secure execution, and enjoy tight spreads from 0.5 pts on FX and 0.3 pts on indices.
Economic calendar
Web Trader platform
Our sophisticated web-based platform is packed with features.
Related articles

New Zealand inflation report puts spotlight on hawkish RBNZ pricing
New Zealand's recovery is barely underway, yet markets have priced a series of RBNZ rate hikes. Thursday's inflation report will put that hawkish recalibration under the microscope.
British Pound Rallies into CPI as BoE Hike Bets Firm - GBP/USD, GBP/AUD
Sterling rallies ahead of UK inflation as BoE hike bets firm. GBP/USD tests resistance while GBP/AUD forms a potential bullish reversal.
GBP/USD Analysis: Sterling Gains Momentum After Employment Surprise
Over recent trading sessions, the British pound has begun to show a notable recovery. This can be observed in the performance of GBP/USD, which has gained more than 1.3% over the last four sessions, reflecting a consistent improvement in sterling's strength against the U.S. dollar.

This report is intended for general circulation only. It should not be construed as a recommendation, or an offer (or solicitation of an offer) to buy or sell any financial products. The information provided does not take into account your specific investment objectives, financial situation or particular needs. Before you act on any recommendation that may be contained in this report, independent advice ought to be sought from a financial adviser regarding the suitability of the investment product, taking into account your specific investment objectives, financial situation or particular needs.
StoneX Financial Pte. Ltd., may distribute reports produced by its respective foreign entities or affiliates within the StoneX group of companies or third parties pursuant to an arrangement under Regulation 32C of the Financial Advisers Regulations. Where the report is distributed to a person in Singapore who is not an accredited investor, expert investor or an institutional investor (as defined in the Securities Futures Act), StoneX Financial Pte. Ltd. accepts legal responsibility to such persons for the contents of the report only to the extent required by law. Singapore recipients should contact StoneX Financial Pte. Ltd. at 6826 9988 for matters arising from, or in connection with the report.
In the case of all other recipients of this report, to the extent permitted by applicable laws and regulations neither StoneX Financial Pte. Ltd. nor its associated companies will be responsible or liable for any loss or damage incurred arising out of, or in connection with, any use of the information contained in this report and all such liability is hereby expressly disclaimed. No representation or warranty is made, express or implied, that the content of this report is complete or accurate.
StoneX Financial Pte. Ltd. is not under any obligation to update this report.
Trading CFDs carries a high level of risk that may not be suitable for some investors. Consider your investment objectives, level of experience, financial resources, risk appetite and other relevant circumstances carefully. The possibility exists that you could lose some or all of your investments, including your initial deposits. If in doubt, please seek independent expert advice. Visit www.forex.com/en-sg/terms-and-policies for the complete Risk Disclosure Statement.