



S&P 500 Analysis: SPX regains confidence in Middle East de-escalation expectations
As the trading week continues to unfold, the S&P 500 has started to show a consistent recovery in short-term confidence, with the index gaining more than 2.5% during the session while attempting to sustain relatively stable buying momentum.
Share this:

As the trading week continues to unfold, the S&P 500 has started to show a consistent recovery in short-term confidence, with the index gaining more than 2.5% during the session while attempting to sustain relatively stable buying momentum. For now, short-term confidence has managed to reestablish itself, as the market has interpreted recent comments from Trump as a potential de-escalation of the conflict in the Middle East, allowing demand for equities to stabilize. If this sense of temporary security holds, buying pressure could begin to gain relevance in the coming sessions.

Hopes pinned on de-escalation
During today’s session, President Trump stated that the war against Iran “will not last much longer,” suggesting that the United States has significantly weakened the country through recent air operations. He also noted that the situation around the Strait of Hormuz could be resolved once the U.S. decides to withdraw. These remarks introduced a more optimistic tone regarding the escalation of the conflict, opening the door to potential negotiations in the short term. Even if temporary, this has helped ease market risk sentiment.
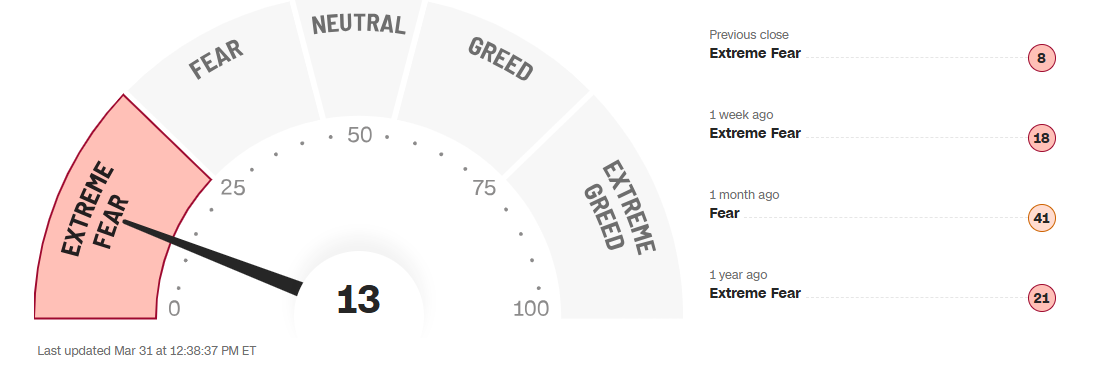
This can be seen in the CNN Fear and Greed Index, which improved from 8 points to around 13 points during the session. Although it remains in “extreme fear” territory, it shows a modest improvement in market sentiment, likely supported by recent comments from the U.S. government regarding efforts to contain the conflict in the Middle East.
Source: CNN
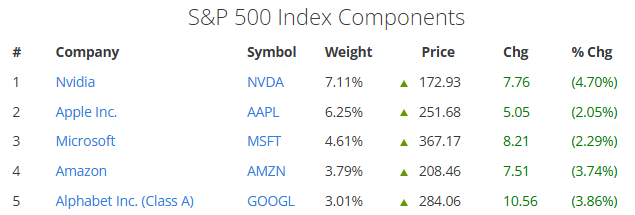
The slight rebound in confidence has allowed the main components of the SPX to post a notable short-term recovery. Nvidia is leading gains with an increase of around 4.7%, followed by Apple (2.05%), Microsoft (2.29%), Amazon (3.74%), and Google (3.86%). This reflects a temporary improvement in equity market confidence, supporting a mild bullish bias in the index.
Source: Slickcharts
In this context, SPX price action remains highly sensitive to developments in the Middle East, as this factor continues to shape overall market risk perception. As long as constructive comments persist, confidence may continue to recover in the short term, potentially translating into stronger buying pressure. However, any renewed escalation could quickly reverse recent gains and bring back a risk-off sentiment.
Long-term confidence remains fragile
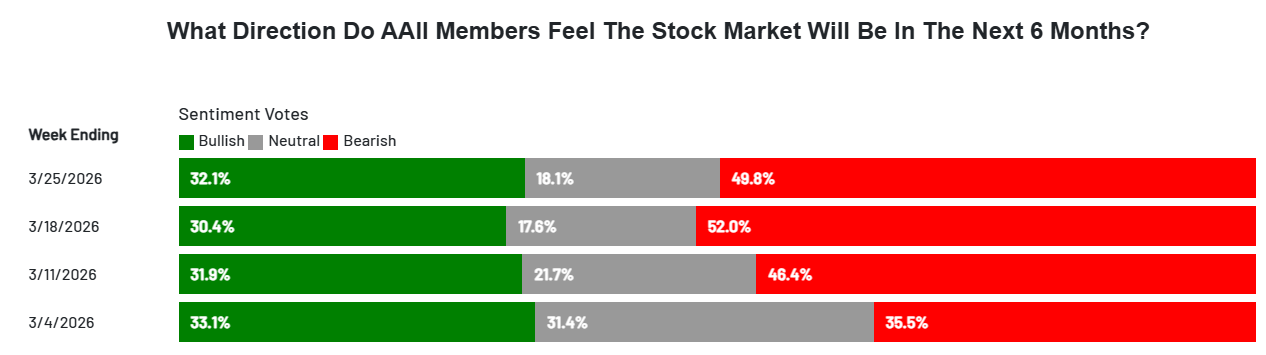
Despite the recent short-term recovery, the long-term outlook remains fragile. According to the AAII Investor Sentiment Survey, expectations for the next six months stand at 32.1% bullish, 18.1% neutral, and 49.8% bearish, suggesting that the market still does not anticipate a sustained recovery in equities.
Source: AAII
This environment could limit a structural recovery in equities, including indices like the Dow Jones, as persistent uncertainty restricts sustained demand. As long as sentiment remains skewed to the downside, the S&P 500 is likely to maintain a weaker medium-term dynamic.
S&P 500 Technical Outlook
Surce: StoneX, Tradingview
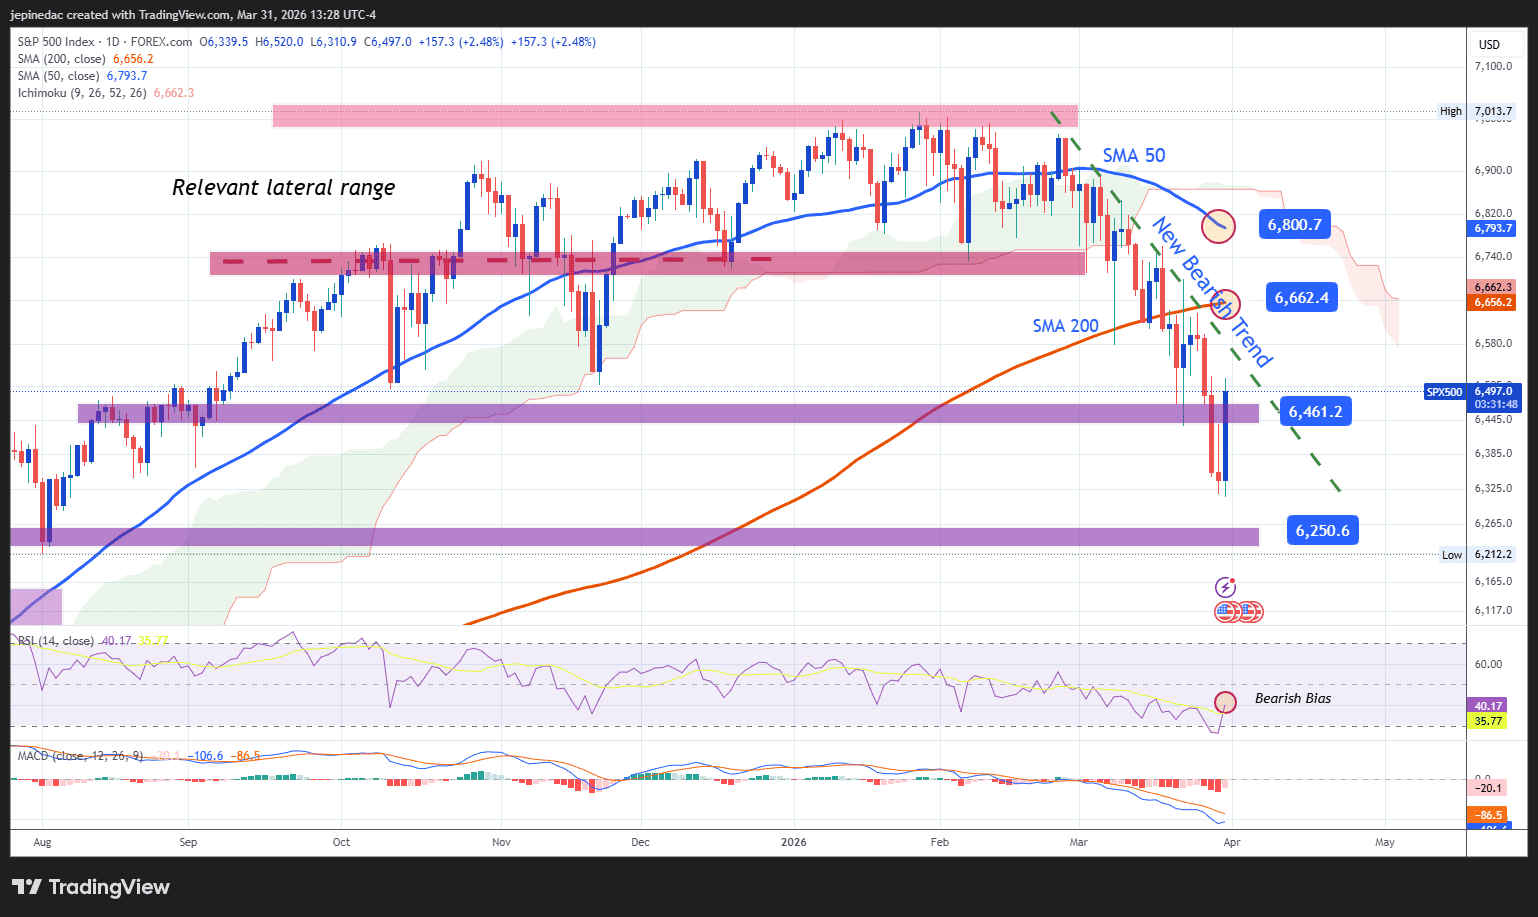
- Downtrend line remains intact: Since late February 2026, SPX price action has respected a consistent downward trendline, which continues to stand out as the most relevant technical structure. Despite the recent rebound, there has not been a strong enough move to challenge this trend, meaning the bearish structure still conditions price action in the near term.
- RSI: Despite the recent bounce, the indicator remains below the 50 neutral level, suggesting that momentum over the past 14 sessions still reflects a dominant bearish bias. Unless this level is clearly broken, downside pressure may remain relevant.
- MACD: The histogram remains below the zero line, indicating that short-term selling pressure is still significant. This reinforces the idea that the bearish bias continues to be part of SPX dynamics.
Key levels:
- 6,662 points – Key resistance: This level aligns with the 200-period simple moving average. A sustained move above it would not only invalidate the current downtrend but could also open the door for a stronger bullish bias.
- 6,461 points – Near-term barrier: A key neutral zone that has acted as a pullback area in previous months. Price action around this level could lead to a range-bound or indecisive scenario in the short term.
- 6,250 points – Key support: A level not seen since August 2025. A move toward this area could reactivate a more aggressive bearish bias and extend the current downtrend.
Written by Julian Pineda, CFA, CMT – Market Analyst
Follow him on: @julianpineda25
Latest market news




Open an account in minutes
Experience award-winning platforms with fast and secure execution, and enjoy tight spreads from 0.5 pts on FX and 0.3 pts on indices.
Economic calendar
Web Trader platform
Our sophisticated web-based platform is packed with features.
Related articles
S&P 500 Forecast: SPX set for a weekly decline led lower by tech as AI worries linger
U.S. stocks have opened mixed as investors continue to worry about the financing behind the AI trade while also looking ahead to more earnings next week.


Magnificent Seven Earnings Preview: Is the AI Boom Facing Its Biggest Test Yet?
After a wobble in the broader AI trade, the Magnificent Seven" stocks are reporting earnings in the coming week - see the key themes and Nasdaq 100 levels to watch!


Nasdaq 100 forecast: Tech stocks not out of woods yet
US index futures pushed higher in the first half of Friday’s session, taking cues from a strong performance from European equities. Both European and US equity futures extending yesterday’s impressive recovery after the sharp sell-off earlier in the week. But the lingering concerns around the AI investment cycle remain, while bond markets were easing lower again, lifting yields.

This report is intended for general circulation only. It should not be construed as a recommendation, or an offer (or solicitation of an offer) to buy or sell any financial products. The information provided does not take into account your specific investment objectives, financial situation or particular needs. Before you act on any recommendation that may be contained in this report, independent advice ought to be sought from a financial adviser regarding the suitability of the investment product, taking into account your specific investment objectives, financial situation or particular needs.
StoneX Financial Pte. Ltd., may distribute reports produced by its respective foreign entities or affiliates within the StoneX group of companies or third parties pursuant to an arrangement under Regulation 32C of the Financial Advisers Regulations. Where the report is distributed to a person in Singapore who is not an accredited investor, expert investor or an institutional investor (as defined in the Securities Futures Act), StoneX Financial Pte. Ltd. accepts legal responsibility to such persons for the contents of the report only to the extent required by law. Singapore recipients should contact StoneX Financial Pte. Ltd. at 6826 9988 for matters arising from, or in connection with the report.
In the case of all other recipients of this report, to the extent permitted by applicable laws and regulations neither StoneX Financial Pte. Ltd. nor its associated companies will be responsible or liable for any loss or damage incurred arising out of, or in connection with, any use of the information contained in this report and all such liability is hereby expressly disclaimed. No representation or warranty is made, express or implied, that the content of this report is complete or accurate.
StoneX Financial Pte. Ltd. is not under any obligation to update this report.
Trading CFDs carries a high level of risk that may not be suitable for some investors. Consider your investment objectives, level of experience, financial resources, risk appetite and other relevant circumstances carefully. The possibility exists that you could lose some or all of your investments, including your initial deposits. If in doubt, please seek independent expert advice. Visit www.forex.com/en-sg/terms-and-policies for the complete Risk Disclosure Statement.