



Tech stock technical picks: Tesla, Alphabet, Amazon
Share this:

Whilst Wall Street has mostly taken US debt-ceiling concerns within stride, the issue could severely hamper the economy (and therefore sentiment) if the US government defaults on its debt. So we may find that sentiment sours as the week progresses, if heated talks between Democrats and Republicans remain in a deadlock.
Conversely, an excellent buying opportunity could present itself if or when the debt ceiling is inevitably raised once more. And that leaves opportunities for both bulls and bears, depending on how this plays out. So today we look at opportunities for the long or short side on Tesla, Alphabet and Amazon.
Tesla (TSLA) daily chart:
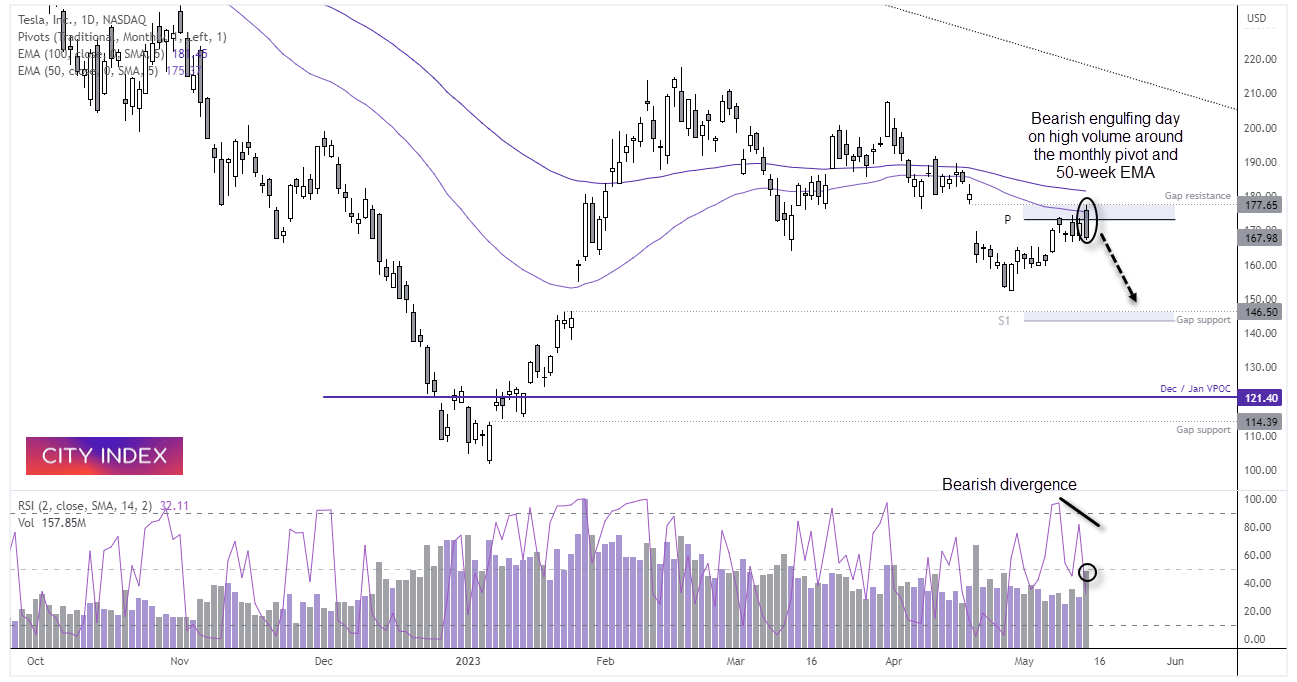

Price action on tesla has been relatively choppy will ill-defined trends on the daily chart. However, several technical factors have come together to provide a potential swing-trade short for bears over the near-term.
The recent rally effectively closed the gap at 177.65, and marked Friday’s high. A bearish engulfing / outside day formed on high volume to suggest a key reversal, and a bearish divergence formed on the RSI (2). Furthermore, the key reversal formed around the monthly pivot point, 50-day EMA and just below the 100-day EMA.
- The bias on the daily chart remains bearish whilst prices remain beneath Friday’s high
- Bears could seek to enter a break of last week’s low, or fade into minor rallies within Friday’s range
- Round numbers such as 160 and 150 make viable downside targets, but if risk-off prices markets it could potentially close the hap at 145.50 around the monthly S1 pivot
Alphabet (GOOG) daily chart:

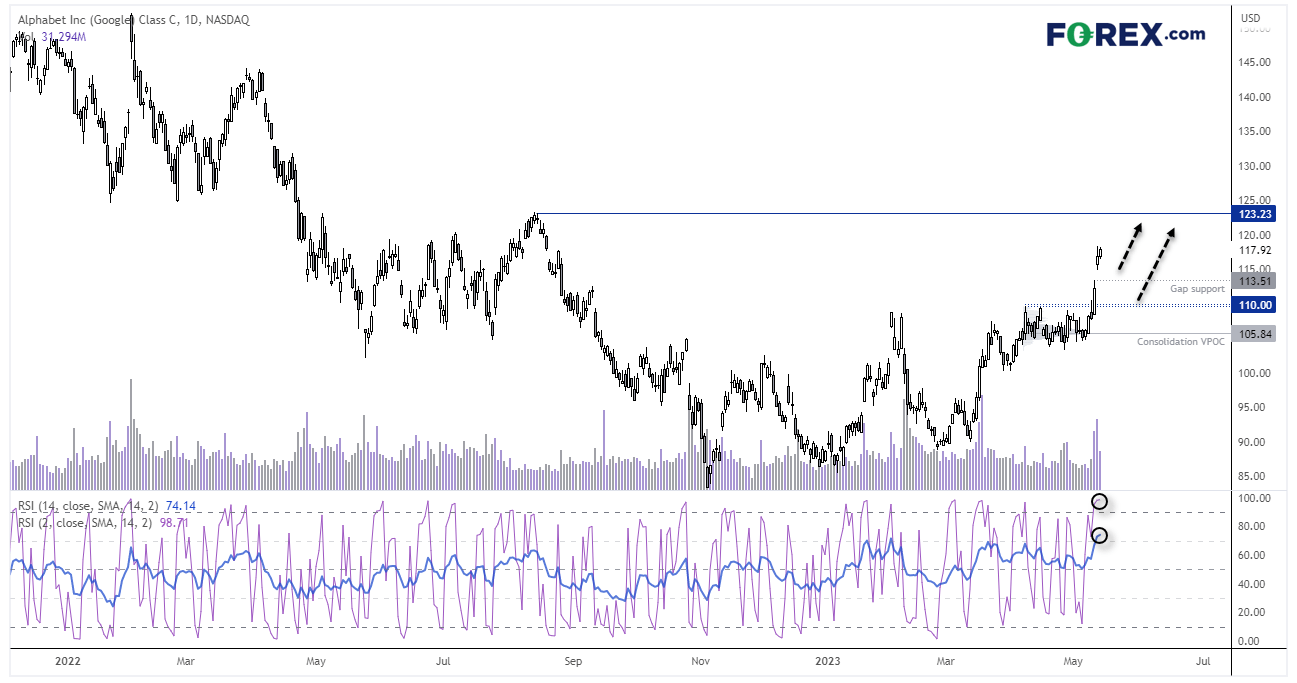
Alphabet posted a strong 11% rally last week, its second time this year to hit double digits. Wall Street clearly liked their announcement last week that AI will be incorporated into Google and helped the stock break convincingly out of a consolidation in the process.
Most of the trading activity within the consolidation took place at 105.84 to suggest this is where institutions were buying ahead of the breakout, and it is a level which could be defended upon any retracement. The rally was also accompanied with strong trading volumes to show initiative buying as prices rose.
However, RSI (2) and (14) have reached overbought levels, so we would prefer to wait for prices to consolidate or retrace against last week’s rally before seeking long opportunities.
- Bulls could seek long opportunities around gap support (113.51) or the highs around 110
- Alternatively, bulls could wait for prices to consolidate further around these highs and seek a bullish breakout on a lower timeframe
- Initial upside targets for bulls to consider include 120 and the 123.23 high
Amazon (AMZN) monthly chart:


The stock fell -56% from its all-time high to the 2022 low, which is its worst drawdown since the Nasdaq bubble burst. Yet the decline found support just above the 2020 low and formed a bullish outside month to show demand above $80.
We do not yet know whether this is part of a multi-year correction against its multi-year bull trend, but we can see that prices have reached a likely pivot area around, near the February high and 50% retracement level. Notice that the market revered lower around a 50% retracement level back in August 2022, so will history repeat this time around?
We have also noted that monthly trading volumes have diminished each month since the December low to suggest the current rally is losing steam, heading into these highs.
Amazon (AMZN) daily chart:

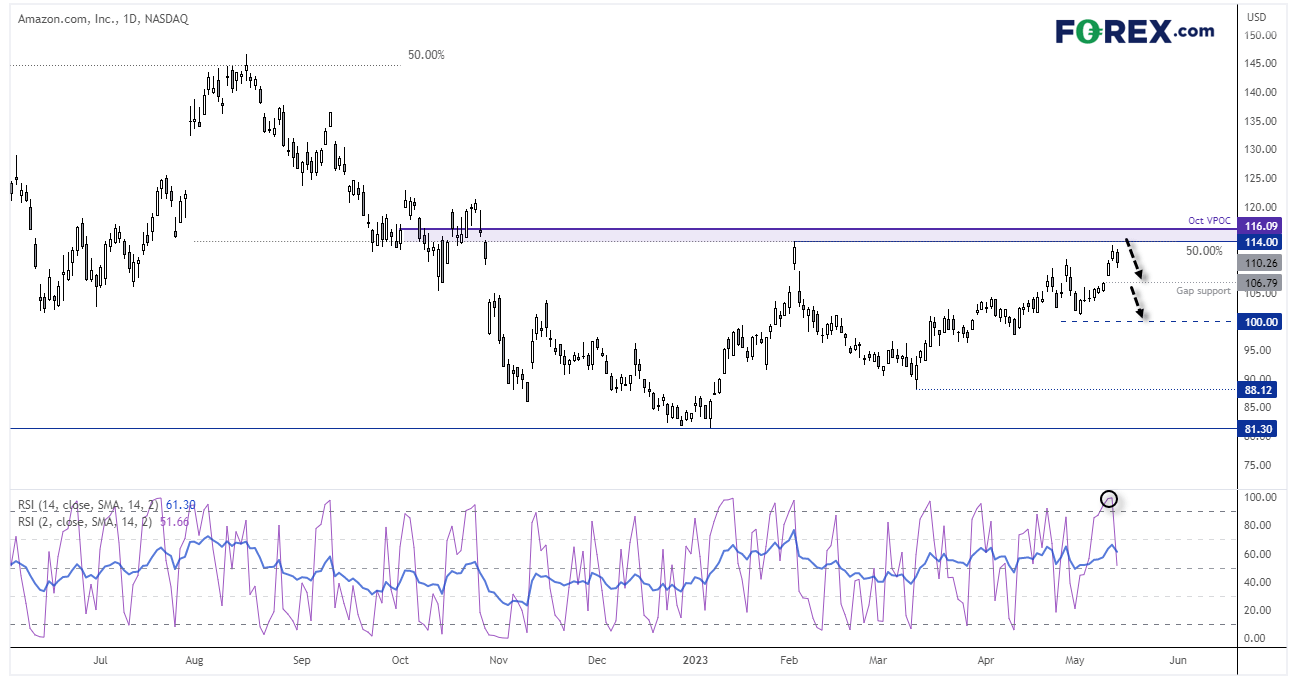
The daily chart shows prices are hesitant to immediately break above the February high, having pulled back on Friday. But we also note that October’s VPOC (volume point of control) is also overhead at $116, and that is a level which may be defended by bears. Over the near-term, we’re looking for prices to close the gap at 106.79, so would consider fading into rallies below $116, a break beneath which brings the lows around $100 into focus. And if that level breaks, we’ll assume it is part of a much larger risk-off move which brings $90 into view.
-- Written by Matt Simpson
Follow Matt on Twitter @cLeverEdge
How to trade with City Index
You can trade with City Index by following these four easy steps:
- Open an account, or log in if you’re already a customer
• Open an account in the UK
• Open an account in Australia
• Open an account in Singapore
- Search for the market you want to trade in our award-winning platform
- Choose your position and size, and your stop and limit levels
- Place the trade
Latest market news



Open an account in minutes
Experience award-winning platforms with fast and secure execution, and enjoy tight spreads from 0.5 pts on FX and 0.3 pts on indices.
Economic calendar
Web Trader platform
Our sophisticated web-based platform is packed with features.
Related articles
EUR/USD weekly outlook: Oil, inflation and NFP in focus
After coming under significant pressure in recent weeks, the EUR/USD came off its lows to finish the week on a positive note on Friday, albeit with only a mild rebound. That was not enough to prevent the exchange rate falling for the third consecutive week, as the US dollar and bond yields rallied across the board.

Gold Q4 2026 outlook: Resilience in the face of rallying dollar and yields
As we headed towards the latter stages of Q3 and into Q4, the Fed had just hiked rates in a hawkish FOMC meeting, while the likes of the ECB and BoJ had also tightened their respective policies. Oil prices remained elevated amid the prolonged US-Iran conflict. Meanwhile, bond yields were breaking out, and the dollar was higher across the board. Yet, remarkably, gold was still holding in the positive territory for the third quarter, even if it had weakened somewhat in September.

Oil Quietly Hands the Fed a Reason to Stay Hawkish
Oil prices and the U.S. dollar are both on the front foot as elevated energy costs feed Fed warnings that inflation may prove sticky.
This report is intended for general circulation only. It should not be construed as a recommendation, or an offer (or solicitation of an offer) to buy or sell any financial products. The information provided does not take into account your specific investment objectives, financial situation or particular needs. Before you act on any recommendation that may be contained in this report, independent advice ought to be sought from a financial adviser regarding the suitability of the investment product, taking into account your specific investment objectives, financial situation or particular needs.
StoneX Financial Pte. Ltd., may distribute reports produced by its respective foreign entities or affiliates within the StoneX group of companies or third parties pursuant to an arrangement under Regulation 32C of the Financial Advisers Regulations. Where the report is distributed to a person in Singapore who is not an accredited investor, expert investor or an institutional investor (as defined in the Securities Futures Act), StoneX Financial Pte. Ltd. accepts legal responsibility to such persons for the contents of the report only to the extent required by law. Singapore recipients should contact StoneX Financial Pte. Ltd. at 6826 9988 for matters arising from, or in connection with the report.
In the case of all other recipients of this report, to the extent permitted by applicable laws and regulations neither StoneX Financial Pte. Ltd. nor its associated companies will be responsible or liable for any loss or damage incurred arising out of, or in connection with, any use of the information contained in this report and all such liability is hereby expressly disclaimed. No representation or warranty is made, express or implied, that the content of this report is complete or accurate.
StoneX Financial Pte. Ltd. is not under any obligation to update this report.
Trading CFDs carries a high level of risk that may not be suitable for some investors. Consider your investment objectives, level of experience, financial resources, risk appetite and other relevant circumstances carefully. The possibility exists that you could lose some or all of your investments, including your initial deposits. If in doubt, please seek independent expert advice. Visit www.forex.com/en-sg/terms-and-policies for the complete Risk Disclosure Statement.